
Graphic With Python (GWP) is a user-friendly and simpler way to practise and imply Computer Graphic Concept . It is better then graphics.h as GWP is faster & easy to implement. The Aim for this library is to make Computer Graphic Visualization easier and understandable by providing Fuction for each Method and support.


Project description
Graphics With Python


A Computer Graphic Library for engineering in Python
Overview
Graphic With Python (GWP) is a user-friendly and simpler way to practise and imply Computer Graphic Concept . It is better then graphics.h as GWP is faster & easy to implement. The Aim for this library is to make Computer Graphic Visualization easier and understandable by providing Fuction for each Method and support.
Installation
Prerequisite
Python 3.6 +
VS Code / IDE / Replit
There are two methods to installation and using this library.
For Local Machine / IDE's
pip install GraphicswithPython
For Online IDE
- visit here www.replit.com
- Go to shell and enter
pip install GraphicswithPython
Usage/Examples
GraphicswithPython library support
manualfunction as well aspre-implementedfunction for refrence.
Manual
-
window()
It create a window for where your output is displayed. Every program must have a window
Parameter of Window
window(width: int, height: int)Example
from GraphicswithPython import window
window(700,700)
-
color()
Graphicswithpython supports rgb color. So to make this easy just pass a string of color example
redand it will return rgb tuple valueParameter
color("color") supported color for now are black, grey, red, white, blue, green, yellowExamples
from GraphicswithPython import color
color("red") # return (255, 0, 0)
color("blue") # return (0, 0, 255)
color("black") # return (0,0,0)
color("green") # return (0,255,0)
-
putpixel()
It put specific pixel at given x , y coordinate
Parameter
putpixel(xcordinates: int, ycordinates: int, color: str, intensity: int) # intensity is optional parameterExamples
from GraphicswithPython import putpixel,window
window(700,700)
putpixel(300,300,"black")
-
getpixel()
It returns RBG color data of specific pixel at provided x ,y co-ordinate
Parament
getpixel(xcordinates: int, ycordinates: int) -> return tuple color example (0,0,255)Examples
from GraphicswithPython import putpixel,window
window(700,700)
putpixel(300,300,"black") # Its return tuple color (0,0,225)
print(getpixel(300,300))   # we printed getpixel to get output in terminal
-
delay()
It delay the programe so you can see the animation
Parament
delay(Milliseconds)Examples
from GraphicswithPython import delay
delay(1000) # delay progaram for 1 sec
-
circle()
It create a circle of given radius
parameter
circle(xcordinates: int, ycordinates: int, radius: int, color: tuple)Examples
from graphicswithpython import circle , display , delay , color
display(700, 700 )
circle(300,300,40,color("green"))

delay(5000) # Used to make display visible for next 5 seconds after execution
-
rectangle()
It create a Rectangle
parameter
rectangle(left: int, top: int, width: int, height: int, color: tuple)Examples
from graphicswithpython import rectangle , display , delay , color
display(700, 700 )
rectangle(300,300,100,100,color("green"))

delay(5000) # Used to make display visible for next 5 seconds after execution
-
elipse()
It create a Elipse
parameter
elipse(left: int, top: int, width: int, height: int, color: tuple)Examples
from graphicswithpython import elipse , display , delay , color
display(700, 700 )
ellipse(200,200,100,100,color("white"))

delay(5000) # Used to make display visible for next 5 seconds after execution
-
polygon()
It create a Polygon
parameter
polygon(points: tuple, color: tuple)Examples
from graphicswithpython import polygon , window , delay ,color

window(700,700)

polygon(((300,300),(200,400),(300,500),(500,500),(300,400)),color("white"))

delay(5000)  # Used to make display visible for next 5 seconds after execution
-
point_in_circle()
It check wheater the point is in circle or not.
parameter
point_in_circle(centerx: int, centery: int, radius: int, x: int, y: int)Examples
from graphicswithpython import  window , delay ,color, pointInCircle ,circle

window(700,700)
circle(300,300,40,color("red"))
print(pointInCircle(300,300,40,500,500))  # it will return False , as point is outside circle
print(pointInCircle(300,300,40,320,320))  # It will return True , as point is inside circle


delay(5000)  # Used to make display visible for next 5 seconds after execution
PreImplemented
PreImplemented function are the
funtional Algorithmwhich are already implemented.
-
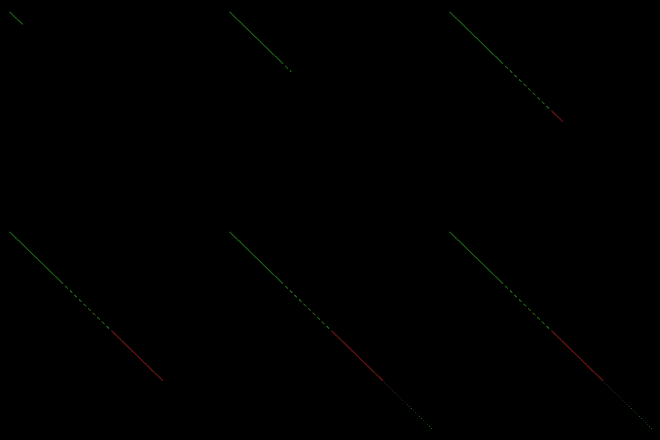
DDA
DDA stands for Digital Differential Analyzer. It is an incremental method of scan conversion of line
Parameter Explaination x1 Integer varible of x-coordinate y1 Interger variable for y-coordinate of x2 Integer variable for x-coordinate for 2nd point of line y2 Integer variable for y-coordinate for 2nd point of line DDA type Any of dda types required => Line,dash,solid,dotted.color color() funtion is required to mention the color of dda needed Parameter for DDA is
dda(x1: int, y1: int, x2: int, y2: int, DDatype: str, color: tupleExamples
from graphicswithpython import dda, window, delay, color

window(700, 700)  # first make window to get output there

# Line
dda(100, 100, 200, 200, "line", color("blue"))

# line Dash
dda(200, 200, 300, 300, "dash", color("white"))

# line Solid
dda(300, 300,400,400, "solid", color("blue"))

# line dotted
dda(400,400,500,500, "dotted", color("blue"))

delay(5000)     # make window visible more 5 sec after execution completes
-
Breshham
Bresenham's line algorithm is a line drawing algorithm that determines the points of an n-dimensional raster that should be selected in order to form a close approximation to a straight line between two points.
Required Explanation x1 x-coordinate for 1st point of line y1 y-coordinate for 1st point of line x2 x-coordinate for 2nd point of line y2 y-coordinate for 2nd point of line bresenhamstype Type of Bresenham needed => line,dash,solid,dottedcolor color() funtion is required (rgb tuple ) Parameter for Bresenham
bresenham(x1: int, y1: int, x2: int, y2: int, bresenhamstype: str, color: tuple)Examples
from graphicswithpython import bresenhams, window,delay,color
window(700,700)         #first make window to get output there

# Breshham  Line
bresenhams(100,100,200,200,"line",color("green"))

#Breshham  Line Dash
bresenhams(300,300,400,400,"dash",color("yellow"))

#Breshham  Line Solid
bresenhams(400,400,500,500,"solid",color("red"))

#Breshham  Line dotted
bresenhams(500,500,600,600,"dotted",color("white"))

delay(5000)     # make window visible more 5 sec after execution completes
-
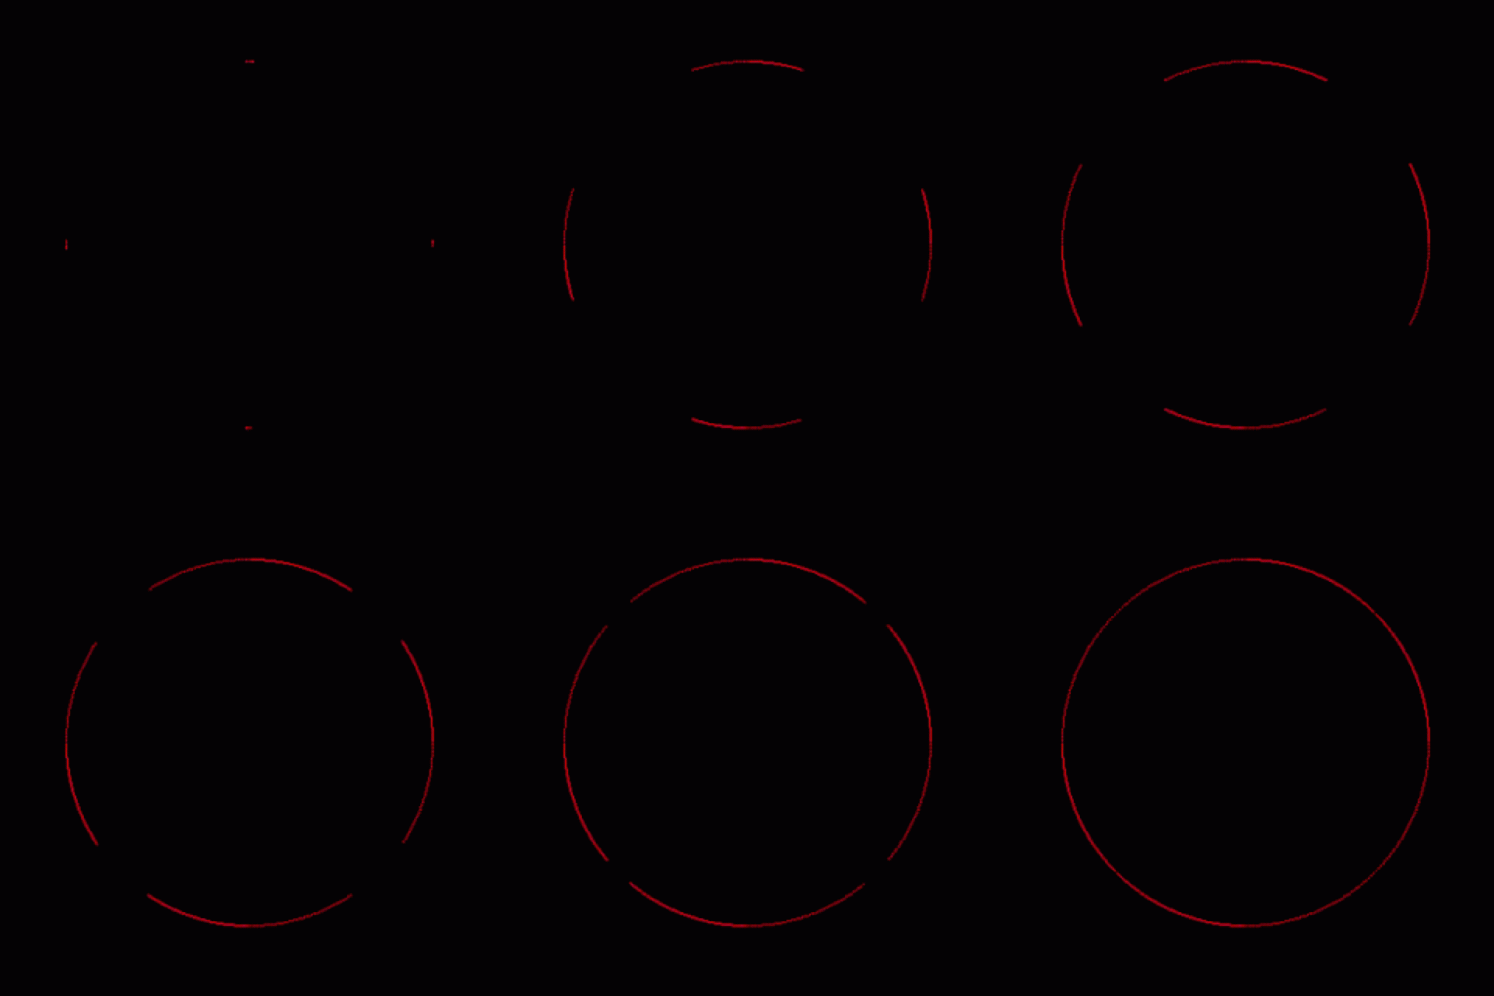
Midpointcircle
The midpoint circle algorithm is an algorithm used to determine the points needed for rasterizing a circle.
Required Explaination radius radius of circle xcenter x-coordinate for center of circle ycenter y-coordinate for center of circle midpointtype type of midpoint circle needed => LINE , Dash, solid, Dotted, DottedandLine color color() function is required (rgb tuple ) Parament for Midpointcircle
midpoint(radius: int, xcenter: int, ycenter: int, midpointtype: str, color: tuple)Examples
from graphicswithpython import  window, delay, color, midpointcircle

window(700,700)         #first make window to get output there

# Midpoint  Circle Line
midpointcircle(50,100,100,"line",color("red"))

# Midpoint Circle Dash
midpointcircle(50,200,200,"dash",color("green"))


# Midpoint Circle Solid
midpointcircle(50,300,300,"solid",color("white"))

# Midpoint Circle Dotted
midpointcircle(50,400,400,"dotted",color("blue"))

# Midpoint Circle Dash and Normal
midpointcircle(50,500,500,"dashandline",color("white"))

delay(5000)     # make window visible more 5 sec after execution completes
-
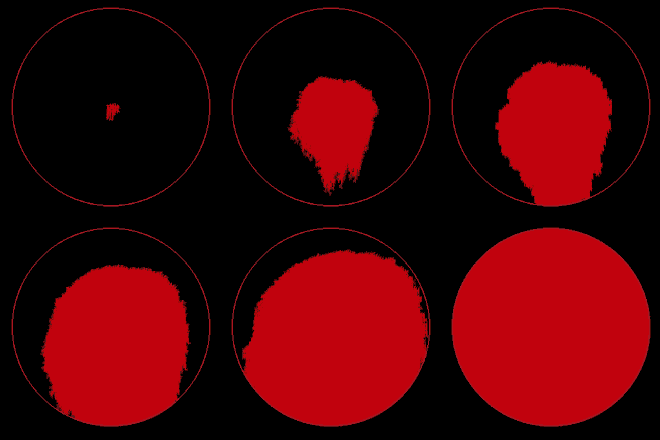
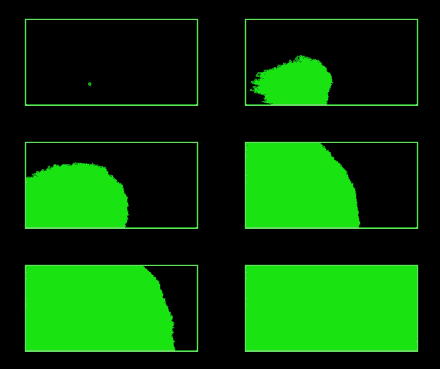
FloodFill
Flood fill, also called seed fill, is an algorithm that determines and alters the area connected to a given node in a multi-dimensional array with some matching attribute.
Required Explaination xcenter x-coordinate of center point ycenter y-coordinate of center point backgroundcolor exisiting backgroundcolor of window newcolor color() funtion required for new color to be filled seed number of seed you need for FloodFill radius radius of object in which doing floodfill. (optional) Note : Radius tuple is required for 8 seed floodfill
Parameter of FloodFill
xcenter: int, ycenter: int, backgroundcolor: tuple, newcolor: tuple, seeds: int, radius: int | None = NoneExamples (for 4 seed )
from graphicswithpython import floodfill, window,delay,color , circle ,rectangle,polygon

window(700,700)         #first make window to get output there

#  FloodFill 4 seed Circle
circle(100,100,40,color("red"))
floodfill(100,100,backgroundcolor=color("black"),newcolor=color("green"),seeds=4)       #floodfill(xcenter,ycenter,backgroundcolor,newcolor,seed)

# FloodFill 4 seed Square
rectangle(200,300,100,100,color("blue"))
floodfill(210,310,backgroundcolor=color("black"),newcolor=color("green"),seeds=4)

# FloodFill 4 seed polygon
polygon(points=((500,100),(500,200),(600,200),(630,150),(600,100)),color="red")
floodfill(530,150,backgroundcolor=color("black"),newcolor=color("green"),seeds=4)

# FloodFill 4 seed Rectangle
rectangle(350,550,140,100,color("red"))
floodfill(400,600,backgroundcolor=color("black"),newcolor=color("green"),seeds=4)

delay(5000)     # make window visible more 5 sec after execution completes
Examples (for 8 seed)
from graphicswithpython import floodfill, window, delay, color, circle, rectangle, polygon

window(700,700)         #first make window to get output there

#  FloodFill 8 seed Circle
circle(100,100,40,color("red"))
floodfill(100,100,backgroundcolor=color("black"),newcolor=color("green"),seeds=8,radius=40)  # Must specify radius in Circle only.

# FloodFill 8 seed Square
rectangle(200,300,100,100,color("blue"))
floodfill(210,310,backgroundcolor=color("black"),newcolor=color("green"),seeds=8)

# FloodFill 8 seed polygon
polygon(points=((500,100),(500,200),(600,200),(630,150),(600,100)),color="red")
floodfill(530,150,backgroundcolor=color("black"),newcolor=color("green"),seeds=8)

# FloodFill 8 seed Rectangle
rectangle(350,550,140,100,color("red"))
floodfill(400,600,backgroundcolor=color("black"),newcolor=color("green"),seeds=8)

delay(5000)     # make window visible more 5 sec after execution completes
-
Boundary Fill
Boundary fill is the algorithm used frequently in computer graphics to fill a desired color inside a closed polygon having the same boundary color for all of its sides.
Required Explaination xcenter x-coordinate of center point ycenter y-coordinate of center point bordercolor exisiting bordercolor of newcolor color() funtion required for new color to be filled seed number of seed you need for FloodFill radius radius of object in which doing floodfill. (optional) Parameter for Boundary FIll
xcenter: int, ycenter: int, bordercolor: tuple, newcolor: tuple, seeds: int, radius: int | None = None
Examples ( for 4 seed )
from graphicswithpython import boundaryfill, window,delay,color , circle ,rectangle,polygon

window(700,700)         #first make window to get output there
# boundaryfill 4 seed Rectangle
rectangle(350,550,140,100,color("red"))
boundaryfill(400,600,bordercolor=color("red"),newcolor=color("green"),seeds=4)


#  boundaryfill 4 seed Circle
circle(100,100,40,color("red"))
boundaryfill(100,100,bordercolor=color("red"),newcolor=color("green"),seeds=4)       #boundaryfill(xcenter,ycenter,bordercolor,newcolor,seed)

# boundaryfill 4 seed Square
rectangle(200,300,100,100,color("blue"))
boundaryfill(210,310,bordercolor=color("blue"),newcolor=color("green"),seeds=4)

# boundaryfill 4 seed polygon
polygon(points=((500,100),(500,200),(600,200),(630,150),(600,100)),color="red")
boundaryfill(530,150,bordercolor=color("red"),newcolor=color("green"),seeds=4)


delay(5000)     # make window visible more 5 sec after execution completes
Examples (for 8 seed)
from graphicswithpython import boundaryfill, window,delay,color , circle ,rectangle,polygon

  window(700,700)         #first make window to get output there

  #  boundaryfill 8 seed Circle
  circle(100,100,40,color("red"))
  boundaryfill(100,100,bordercolor=color("red"),newcolor=color("green"),seeds=8,radius=40) # Must specify radius in 8 seed only.

  # boundaryfill 8 seed Square
  rectangle(200,300,100,100,color("blue"))
  boundaryfill(210,310,bordercolor=color("blue"),newcolor=color("green"),seeds=8)

  # boundaryfill 8 seed polygon
  polygon(points=((500,100),(500,200),(600,200),(630,150),(600,100)),color="red")
  boundaryfill(530,150,bordercolor=color("red"),newcolor=color("green"),seeds=8)

  # boundaryfill 8 seed Rectangle
  rectangle(350,550,140,100,color("white"))
  boundaryfill(400,600,bordercolor=color("white"),newcolor=color("green"),seeds=8)

  delay(5000)     # make window visible more 5 sec after execution completes
Summary
-
Manual Method
Funtions Description Parameter Examples window() It create a window for output visualization. window(width: int, height: int) window(700,700) putpixel() It put specific pixel at given x , y coordinate putpixel(xcordinates: int, ycordinates: int, color: str) putpixel(300,300,"black") getpixel() It returns RBG color data of specific pixel at provided x ,y co-ordinate getpixel(xcordinates: int, ycordinates: int) xcordinates:int, ycordinates:int circle() It create a circle circle(xcordinates: int, ycordinates: int, radius: int, color: tuple) circle(300,300,40,color("green")) rectangle() It create a Rectangle rectangle(left: int, top: int, width: int, height: int, color: tuple) rectangle(300,300,100,100,color("green")) elipse() It create a Elipse elipse(left: int, top: int, width: int, height: int, color: tuple) ellipse(200,200,100,100,color("white")) polygon() It create a Polygon polygon(points: tuple, color: tuple) unknown triangle() It create a Triangle triangle(x1: int, y1: int, x2: int, y2: int, x3: int, y3: int, color: tuple) triangle(200,200,200,300,300,200,color("red")) frame_limiter() Can specify number of frame per second (FPS) of window. point_in_circle() It check wheater the point is in circle or not. point_in_circle(centerx: int, centery: int, radius: int, x: int, y: int) centerx:int, centery:int, radius:int, x:int, y:int -
PreImplemented Methods
Funtions Description DDA Line DDA stands for Digital Differential Analyzer. It is an incremental method of scan conversion of line DDA Dash Draws a dashed line using DDA Algorithm. Takes the line co-ordinates from the user to plot the desired dashed line. DDA Solid Draws a Solid line using DDA Algorithm. Takes the line co-ordinates from the user to plot the desired Solid line. DDA Dotted Draws a dashed & line using DDA Algorithm. Takes the line co-ordinates from the user to plot the desired line. Breshham Line This algorithm is used for scan converting a line. Breshham Line Dotted This algorithm is used for scan converting a line. Midpoint Circle This algorithm is used to draw Circle using Center point co-ordinate Midpoint Circle Dash This algorithm is used to draw Circle with dash border using Center point co-ordinate Midpoint Circle Solid This algorithm is used to draw Circle with solid Border using Center point co-ordinate Midpoint Circle Dotted This algorithm is used to draw Circle with Dotted Borderusing Center point co-ordinate Midpoint Circle Dash and Normal This algorithm is used to draw Circle with Oppsosite side Dashed using Center point co-ordinate FloodFill 4 seed It flood the fill pattern and fill color in area bounded by color border with 4 seed point. FloodFill 4 seed polygon It flood the fill pattern and fill color in area of Polygon bounded by color border with 4 seed point. FloodFill 4 seed Circle It flood the fill pattern and fill color in area of Circle bounded by color border with 4 seed point. FloodFill 8 seed It flood the fill pattern and fill color in area of polygon bounded by color border with 8 seed point. FloodFill 8 seed Square It flood the fill pattern and fill color in area of Square bounded by color border with 8 seed point. FloodFill 8 seed Polygon It flood the fill pattern and fill color in area of Polygon bounded by color border with 8 seed point. FloodFill 8 seed Rectangle It flood the fill pattern and fill color in area of Rectangle bounded by color border with 8 seed point. FloodFill 8 seed Circle It flood the fill pattern and fill color in area of Circle bounded by color border with 8 seed point. Boundary Fill 4 seed It fill a desired color inside a closed Polygon having the same boundary color for all of its sides using 4 seeds. Boundary Fill 4 seed Square It fill a desired color inside a closed Sqaure having the same boundary color for all of its sides using 4 seeds. Boundary Fill 4 seed Rectangle It fill a desired color inside a closed Reactangle having the same boundary color for all of its sides using 4 seeds. Boundary Fill 4 seed Circle It fill a desired color inside a closed Circle having the same boundary color for all of its sides using 4 seeds. Boundary Fill 8 seed It fill a desired color inside a closed Polygon having the same boundary color for all of its sides using 8 seeds. Boundary Fill 8 seed Square It fill a desired color inside a closed Square having the same boundary color for all of its sides using 8 seeds. Boundary Fill 8 seed Polygon It fill a desired color inside a closed Polygon having the same boundary color for all of its sides using 8 seeds. Boundary Fill 8 seed Rectangle It fill a desired color inside a closed Rectangle having the same boundary color for all of its sides using 8 seeds. Boundary Fill 8 seed Circle It fill a desired color inside a closed Circle having the same boundary color for all of its sides using 8 seeds.
Release history Release notifications | RSS feed


Download files
Download the file for your platform. If you're not sure which to choose, learn more about installing packages.
Source Distribution
Built Distribution
Filter files by name, interpreter, ABI, and platform.
If you're not sure about the file name format, learn more about wheel file names.
Copy a direct link to the current filters
File details
Details for the file GraphicswithPython-0.0.9.tar.gz.
File metadata
- Download URL: GraphicswithPython-0.0.9.tar.gz
- Upload date:
- Size: 15.9 kB
- Tags: Source
- Uploaded using Trusted Publishing? No
- Uploaded via: twine/3.6.0 importlib_metadata/4.8.2 pkginfo/1.8.1 requests/2.26.0 requests-toolbelt/0.9.1 tqdm/4.62.3 CPython/3.8.10
File hashes
| Algorithm | Hash digest | |
|---|---|---|
| SHA256 |
7936c77c31674dad27639f37ad72250412a009618087837c8f8ade96c847018f
|
|
| MD5 |
e926737a8a2f80fc42ba3260823a7e36
|
|
| BLAKE2b-256 |
c0cdf124dfb1a5a72cbe8f2128ef91b4cdf18df483904ada980a17a265200193
|
File details
Details for the file GraphicswithPython-0.0.9-py3-none-any.whl.
File metadata
- Download URL: GraphicswithPython-0.0.9-py3-none-any.whl
- Upload date:
- Size: 12.3 kB
- Tags: Python 3
- Uploaded using Trusted Publishing? No
- Uploaded via: twine/3.6.0 importlib_metadata/4.8.2 pkginfo/1.8.1 requests/2.26.0 requests-toolbelt/0.9.1 tqdm/4.62.3 CPython/3.8.10
File hashes
| Algorithm | Hash digest | |
|---|---|---|
| SHA256 |
dc6e2910669d757846f35af1ace49269118da41fe7ea1ca22bd673cded0c9554
|
|
| MD5 |
5e88379c4fb115e2a5fad9d6755b8e5d
|
|
| BLAKE2b-256 |
46891e31817c751979ba1831274215897386994520cf8b649e4522abb43193cb
|






