A scikit-learn-compatible modulefor estimating prediction intervals.


Project description


MAPIE - Model Agnostic Prediction Interval Estimator
MAPIE allows you to easily estimate prediction intervals on single-output data using your favourite scikit-learn-compatible regressor.
Prediction intervals output by MAPIE encompass both aleatoric and epistemic uncertainty and are backed by strong theoretical guarantees [1].
🔗 Requirements
Python 3.7+
MAPIE stands on the shoulders of giants.
Its only internal dependency is scikit-learn.
🛠 Installation
Install via pip:
pip install mapieTo install directly from the github repository :
pip install git+https://github.com/simai-ml/MAPIE⚡️ Quickstart
Let us start with a basic regression problem. Here, we generate one-dimensional noisy data that we fit with a linear model.
import numpy as np
from sklearn.linear_model import LinearRegression
from sklearn.datasets import make_regression

regressor = LinearRegression()
X, y = make_regression(n_samples=500, n_features=1, noise=20, random_state=59)
Since MAPIE is compliant with the standard scikit-learn API, we follow the standard sequential fit and predict process like any scikit-learn regressor. We set two values for alpha to estimate prediction intervals at approximately one and two standard deviations from the mean.
from mapie.estimators import MapieRegressor
alpha = [0.05, 0.32]
mapie = MapieRegressor(regressor, alpha=alpha)
mapie.fit(X, y)
y_preds = mapie.predict(X)
MAPIE returns a np.ndarray of shape (n_samples, 3, len(alpha)) giving the predictions, as well as the lower and upper bounds of the prediction intervals for the target quantile for each desired alpha value. The estimated prediction intervals can then be plotted as follows.
from matplotlib import pyplot as plt
from mapie.metrics import coverage_score
plt.xlabel("x")
plt.ylabel("y")
plt.scatter(X, y, alpha=0.3)
plt.plot(X, y_preds[:, 0, 0], color="C1")
order = np.argsort(X[:, 0])
plt.plot(X[order], y_preds[order][:, 1, 1], color="C1", ls="--")
plt.plot(X[order], y_preds[order][:, 2, 1], color="C1", ls="--")
plt.fill_between(
X[order].ravel(),
y_preds[:, 1, 0][order].ravel(),
y_preds[:, 2, 0][order].ravel(),
alpha=0.2
)
coverage_scores = [
coverage_score(y, y_preds[:, 1, i], y_preds[:, 2, i])
for i, _ in enumerate(alpha)
]
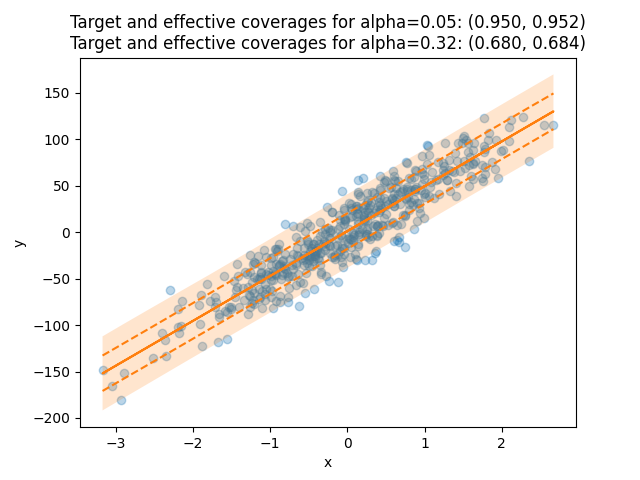
plt.title(
f"Target and effective coverages for "
f"alpha={alpha[0]:.2f}: ({1-alpha[0]:.3f}, {coverage_scores[0]:.3f})\n"
f"Target and effective coverages for "
f"alpha={alpha[1]:.2f}: ({1-alpha[1]:.3f}, {coverage_scores[1]:.3f})"
)
plt.show()The title of the plot compares the target coverages with the effective coverages. The target coverage, or the confidence interval, is the fraction of true labels lying in the prediction intervals that we aim to obtain for a given dataset. It is given by the alpha parameter defined in MapieRegressor, here equal to 0.05 and 0.32, thus giving target coverages of 0.95 and 0.68. The effective coverage is the actual fraction of true labels lying in the prediction intervals.
📘 Documentation
The documentation can be found on this link. It contains the following sections:
📝 Contributing
You are welcome to propose and contribute new ideas. We encourage you to open an issue so that we can align on the work to be done. It is generally a good idea to have a quick discussion before opening a pull request that is potentially out-of-scope. For more information on the contribution process, please go here.
🤝 Affiliations
MAPIE has been developed through a collaboration between Quantmetry, Michelin, and ENS Paris-Saclay with the financial support from Région Ile de France.


🔍 References
MAPIE methods are based on the work by Foygel-Barber et al. (2020).
[1] Rina Foygel Barber, Emmanuel J. Candès, Aaditya Ramdas, and Ryan J. Tibshirani. Predictive inference with the jackknife+. Ann. Statist., 49(1):486–507, 022021
📝 License
MAPIE is free and open-source software licensed under the 3-clause BSD license.
Release history Release notifications | RSS feed


Download files
Download the file for your platform. If you're not sure which to choose, learn more about installing packages.
Source Distribution
Built Distribution
Filter files by name, interpreter, ABI, and platform.
If you're not sure about the file name format, learn more about wheel file names.
Copy a direct link to the current filters
File details
Details for the file MAPIE-0.2.1.tar.gz.
File metadata
- Download URL: MAPIE-0.2.1.tar.gz
- Upload date:
- Size: 23.7 kB
- Tags: Source
- Uploaded using Trusted Publishing? No
- Uploaded via: twine/3.4.1 importlib_metadata/4.5.0 pkginfo/1.7.0 requests/2.25.1 requests-toolbelt/0.9.1 tqdm/4.61.0 CPython/3.9.5
File hashes
| Algorithm | Hash digest | |
|---|---|---|
| SHA256 |
f1ddabea0e8d5f8f7338e14f019aec184bc1d51fdf3f26edb1aae1b96535b4a2
|
|
| MD5 |
d1e4f320eeae0b8bd1ebc4b8ec646091
|
|
| BLAKE2b-256 |
a5a1b1cc69853637f8fe8f94ef41b60d7698ca7a06fe363567612da80bfd6e60
|
File details
Details for the file MAPIE-0.2.1-py3-none-any.whl.
File metadata
- Download URL: MAPIE-0.2.1-py3-none-any.whl
- Upload date:
- Size: 24.2 kB
- Tags: Python 3
- Uploaded using Trusted Publishing? No
- Uploaded via: twine/3.4.1 importlib_metadata/4.5.0 pkginfo/1.7.0 requests/2.25.1 requests-toolbelt/0.9.1 tqdm/4.61.0 CPython/3.9.5
File hashes
| Algorithm | Hash digest | |
|---|---|---|
| SHA256 |
b7503dc2c8be96d6e28e0b728ad576cd282017041dcb10e14395fdd0eda847aa
|
|
| MD5 |
9737986ed6a0aed84aec9c8a5038a492
|
|
| BLAKE2b-256 |
f6cd301be8614082b09b2cb23d63b70481ed5caf5a2e6d4922a5caa271d84249
|


