

MVTS-Analyzer is an open-source Python app/package for plotting, analyzing and annotating multivariate time series. The app was mainly implemented using PySide6, Pandas and Matplotlib and makes it easy to quickly load, display and manipulate multivariate time-series data from a .CSV, .XLSX or pandas-dataframe-pickle file.
Features
Display-control
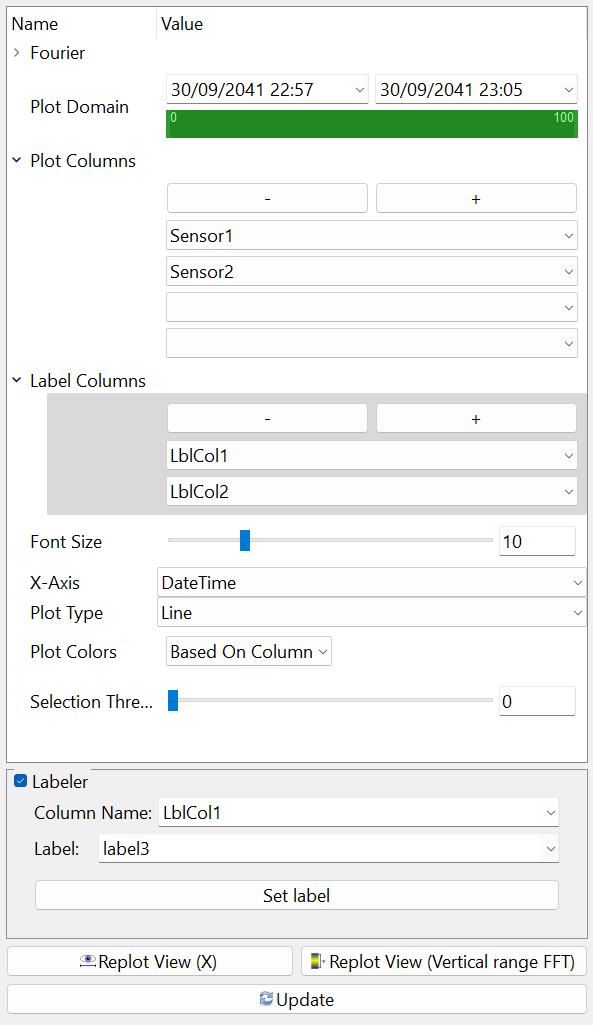
We can select what columns/sensors to display using the plot-settings, each sensor gets its own axis on which the data is plotted. All data is normalized to the view to enable visualization of data with widely different scales. Individual axes can be controlled (pan/zoom) by dragging the axis using left- or right mouse button. We can plot label-columns (pandas-category/integer/string) underneath the main-plot to visualize the annotation for the data-points.

What data to plot is also controlled using the side-window with the plot-settings.
Datapoint Selection and Annotation
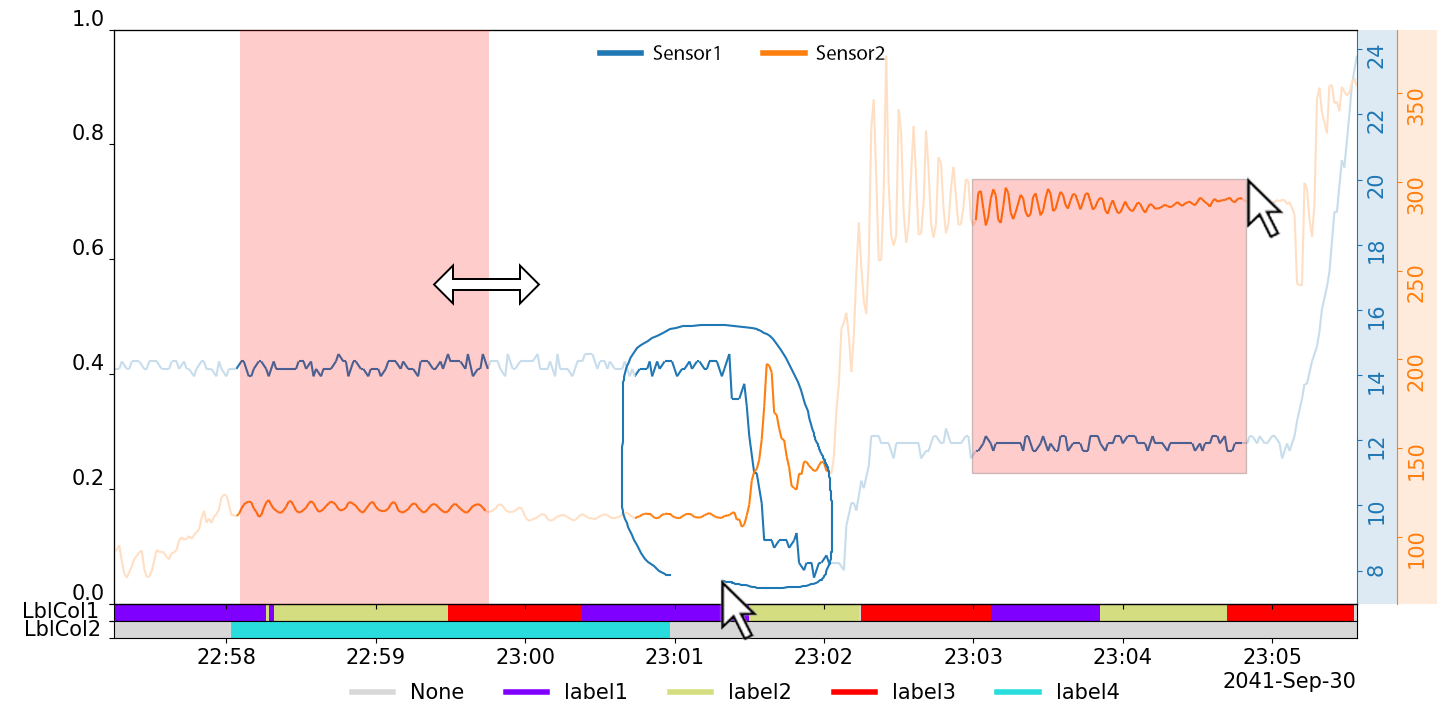
We can use domain (Right Mouse Button), lasso- (LMB) and rectangle-selection (MMB) methods to select and annotate data. The user can select new datapoints either complementary, subtractively or additively. Selected datapoints are highlighted in the plot and can be hidden/shown and annotated.
Multiple Views
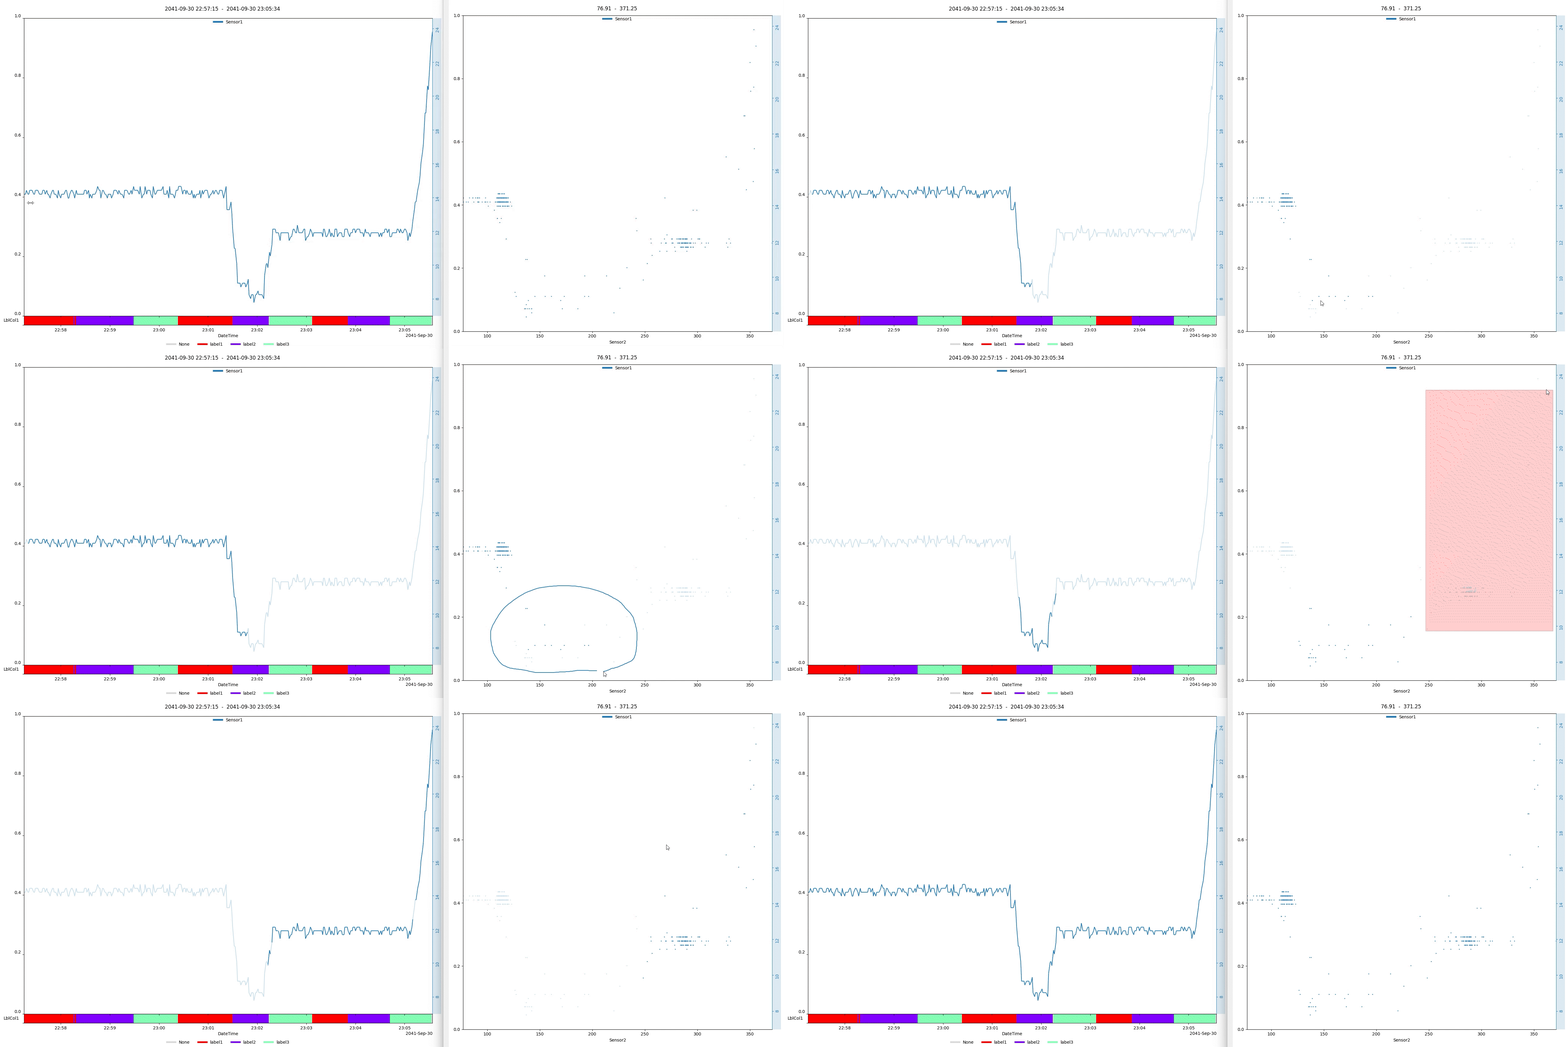
We can open multiple views and plot the same data in different ways using line- and scatter-plots. Point-selection is shared between views, so we can plot different sensors against each other, and select point in one view to highlight them in the other views. This is useful for example to quickly identify and annotate outliers in the data - or to select certain patterns in the data.
Python Code
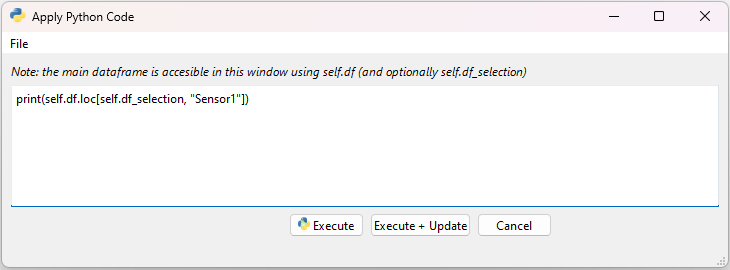
We can run python-scripts to manipulate the loaded Dataframe using the built-in python-console. This allows us to quickly manipulate the (selected) data and plot the results. Python-scripts can be saved and loaded, allowing us to quickly apply the same manipulations to different datasets.
Several example-scripts (e.g. data normalization) are included and can be found under the "Apply"-tab in the main-window.
Supported formats
MVTS-Analyzer supports CSV (',' or ';' delimited), XLSX and Pandas-dataframe-pickle files. The app will automatically detect the file-format and load the data accordingly. An example of the supported formats can be found under /mvts_analyzer/example/.
For FFT-analyses - a datetime column with the exact nameDateTime is required, formatted as YYYY-MM-DD HH:MM:SS or YYYY-MM-DD HH:MM:SS.ffffff.
And more!
Other features include:
- Renaming and deleting columns
- Renaming and deleting annotations
- Copying the currently displayed figure
- Exporting the currently displayed figure
- Displaying fft-plots behind the main-plot, pandas columns with numpy arrays are automatically detected
Future and Contributing
If you have any suggestions, bug-reports or feature-requests, feel free to open an issue or submit a pull-request.
Installation
GitHub
Clone the repository and install the requirements (e.g. using pip):
git clone https://github.com/Woutah/MVTS-Analyzer.git
cd MVTS-Analyzer
pip install -r requirements.txt
PyPi
MVTS-Analyzer is also available as a python-package on PyPi, and can be installed using package managers such as pip:
pip install mvts-analyzer
Running
If the package was installed, the app can be started using the mvts-analyzer command:
mvts-analyzer <options>
Or the short-hand version:
mvtsa <options>
To check if everything is working, we can pass the --example option to launch the app and load the example data:
mvtsa --example
If the package was only cloned from GitHub, the app can instead be started by running the main.py file:
python main.py <options>
(or we can first install the app using "pip install ." in the root directory of the repository to install it, at which point we can launch it using the mvts-analyzer command)
We can use the --help option to see what options are available:
| Option | Argument(s) | Description |
|---|---|---|
-h or --help |
- | Show help message and exit |
-e or --example |
- | Load the example data |
-f or --file |
FILE | Path to the initial data to load (.xlsx, .csv or pickled Pandas Dataframe) |
-m or --use_monitor |
MONITOR | Integer-index on which to launch the app |
-d or --dark_mode |
- | Enables dark mode for the app |
--default_plot_list |
LIST[STR] | List of columns that we want to try to add to the plot-list when loading new dataframes |
Loading Dataframes
We can also launch the app with a dataframe directly. For example:
import sys
from PySide6 import QtGui, QtWidgets
from mvts_analyzer.windows.main_window import MainWindow
import numpy as np
import pandas as pd
import datetime

if __name__ == "__main__":
	timestamps = pd.date_range("2024-01-01 00:00:00", periods=50, freq=datetime.timedelta(seconds=5))
	data = {
		"sensor_A": np.random.normal(loc=20, scale=2, size=50),
		"sensor_B": np.random.normal(loc=50, scale=5, size=50),
		"sensor_C": np.random.normal(loc=100, scale=10, size=50),
	}
	new_df : pd.DataFrame = pd.DataFrame(data)
	app = QtWidgets.QApplication(sys.argv)
	main_win = MainWindow()
	main_win.graph_data_model.load_existing_df(new_df)
	main_win.show()
	app.exec_()
Tested on
- Windows 11 - Python 3.10.8
- Windows 11 - Python 3.8.17
- Ubuntu 22.04.2 LTS - Python 3.8.0
- Windows 10 - Python 3.8.17
Acknowledgments
This project uses several Icons from the Tango-Icons library. The icons can be found here and here.
1 maintainer

Download files
Download the file for your platform. If you're not sure which to choose, learn more about installing packages.
Source Distribution
Built Distribution
Filter files by name, interpreter, ABI, and platform.
If you're not sure about the file name format, learn more about wheel file names.
Copy a direct link to the current filters
File details
Details for the file mvts_analyzer-0.0.3.tar.gz.
File metadata
- Download URL: mvts_analyzer-0.0.3.tar.gz
- Upload date:
- Size: 1.9 MB
- Tags: Source
- Uploaded using Trusted Publishing? Yes
- Uploaded via:
twine/6.1.0 CPython/3.13.7
File hashes
| Algorithm | Hash digest | |
|---|---|---|
| SHA256 |
272d3e953932d64884efbebd5aa64f3dfc4fc36d3cd1ae65909ea049862bea96
|
|
| MD5 |
9d324bd9119f7e7b409f300fff76b622
|
|
| BLAKE2b-256 |
a82997261c814fcd8d7dd3148a4057fd5c9aa5e16dc208fb4bf6b8b9d309fa88
|
Provenance
The following attestation bundles were made for mvts_analyzer-0.0.3.tar.gz:
Publisher:
python-publish-to-pypi.yml on Woutah/MVTS-Analyzer
-
Statement:
-
Statement type:
https://in-toto.io/Statement/v1 -
Predicate type:
https://docs.pypi.org/attestations/publish/v1 -
Subject name:
mvts_analyzer-0.0.3.tar.gz -
Subject digest:
272d3e953932d64884efbebd5aa64f3dfc4fc36d3cd1ae65909ea049862bea96 - Sigstore transparency entry: 1032955543
- Sigstore integration time:
-
Permalink:
Woutah/MVTS-Analyzer@dd3346b478674c397f054c08e078639317515b35 -
Branch / Tag:
refs/tags/0.0.3 - Owner: https://github.com/Woutah
-
Access:
public
-
Token Issuer:
https://token.actions.githubusercontent.com -
Runner Environment:
github-hosted -
Publication workflow:
python-publish-to-pypi.yml@dd3346b478674c397f054c08e078639317515b35 -
Trigger Event:
release
-
Statement type:
File details
Details for the file mvts_analyzer-0.0.3-py3-none-any.whl.
File metadata
- Download URL: mvts_analyzer-0.0.3-py3-none-any.whl
- Upload date:
- Size: 1.9 MB
- Tags: Python 3
- Uploaded using Trusted Publishing? Yes
- Uploaded via:
twine/6.1.0 CPython/3.13.7
File hashes
| Algorithm | Hash digest | |
|---|---|---|
| SHA256 |
0d0ea828ed029c744e3b992dca3bab5f3675549273945840349905b745b2ee52
|
|
| MD5 |
b03474accc2f1c65927d1ef5002d35a5
|
|
| BLAKE2b-256 |
58bce41a8400d39bd276ba755f87f02deac140f2c6c1294f7051699a104fe0c7
|
Provenance
The following attestation bundles were made for mvts_analyzer-0.0.3-py3-none-any.whl:
Publisher:
python-publish-to-pypi.yml on Woutah/MVTS-Analyzer
-
Statement:
-
Statement type:
https://in-toto.io/Statement/v1 -
Predicate type:
https://docs.pypi.org/attestations/publish/v1 -
Subject name:
mvts_analyzer-0.0.3-py3-none-any.whl -
Subject digest:
0d0ea828ed029c744e3b992dca3bab5f3675549273945840349905b745b2ee52 - Sigstore transparency entry: 1032955663
- Sigstore integration time:
-
Permalink:
Woutah/MVTS-Analyzer@dd3346b478674c397f054c08e078639317515b35 -
Branch / Tag:
refs/tags/0.0.3 - Owner: https://github.com/Woutah
-
Access:
public
-
Token Issuer:
https://token.actions.githubusercontent.com -
Runner Environment:
github-hosted -
Publication workflow:
python-publish-to-pypi.yml@dd3346b478674c397f054c08e078639317515b35 -
Trigger Event:
release
-
Statement type:














