Source code for Multi-objective n-dimensional embeddings
Project description
Python implementation for MoDE (Multi-objective nD Embeddings)
Important modules
- "MoDE": Contains the main class that implements MoDE.
- "metrics": Contains the functions to compute the three metrics introduced in the paper, i.e, distance, correlation, and order preservation metrics.
- "waterfilling_compression": Contains the implementation of waterfilling algorithm.
Usage
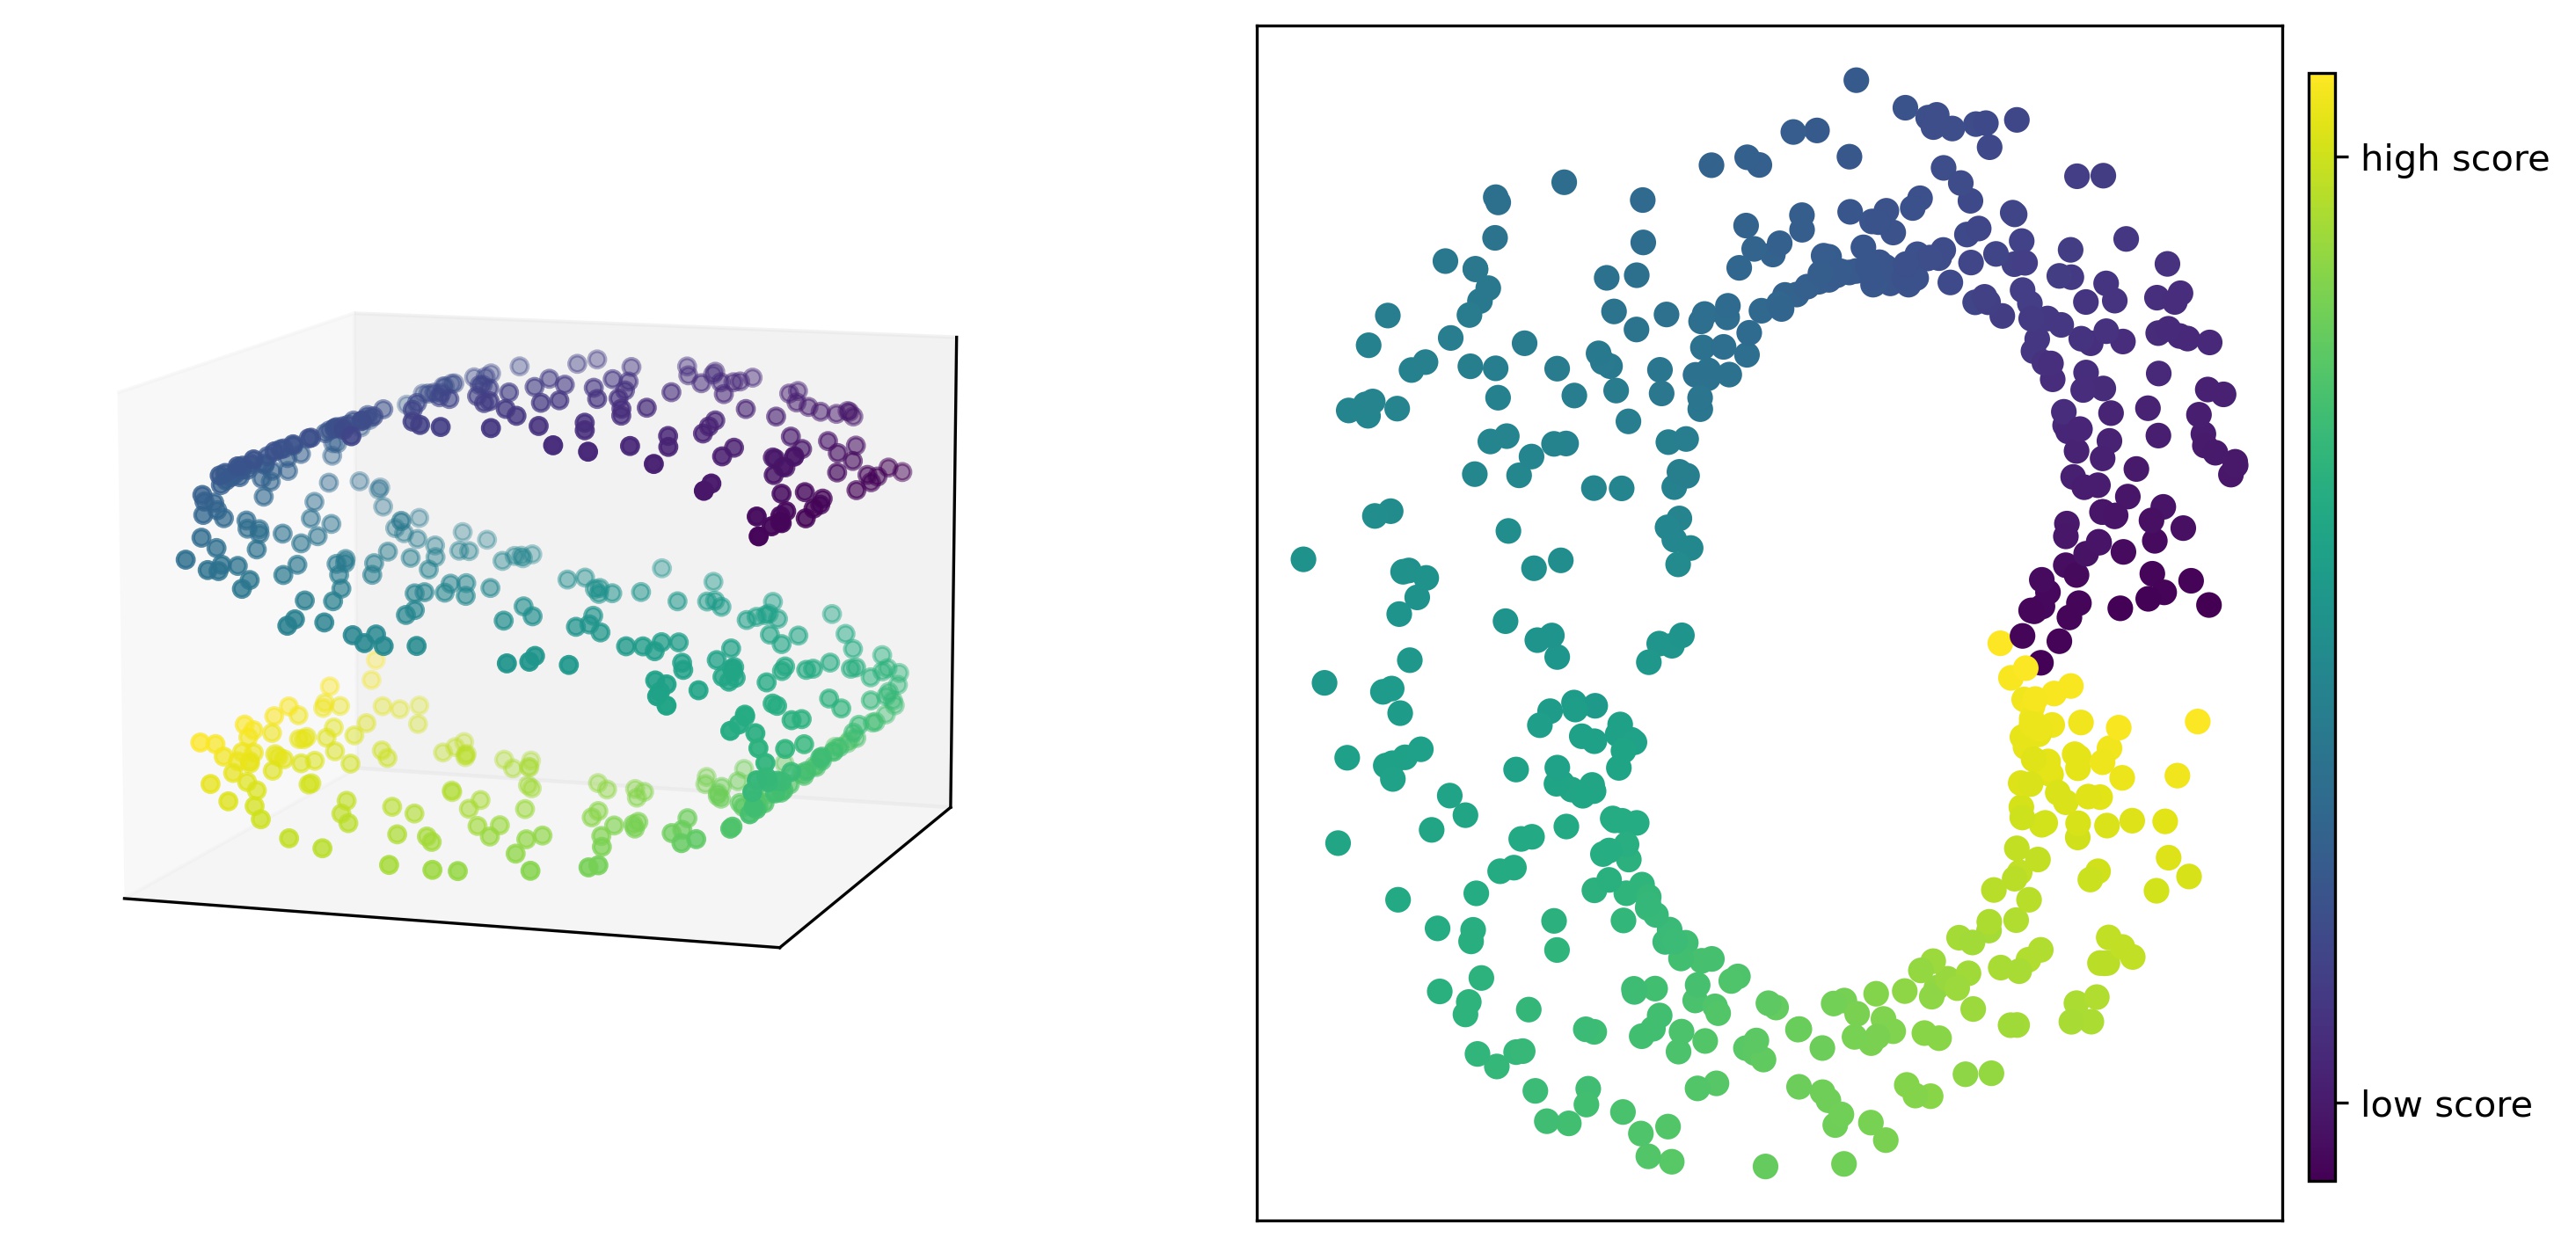
MoDE embeddings can be trained on exact or inexact distance matrices. In the case of inexact distance information, ranges of lower and upper bounds on the distances in the form of seperate lower and upper bound distance matrices should be given to the fit_transform function. MoDe can provide embeddings in a n-dimensional space, specifically in the case of 2-dimensional embeddings the data points are placed in the embedding space such that samples with higher scores are placed in higher angles (in polar coordinates).
The following examples shows how to use this package to compute MoDE embeddings for the S curve dataset with
500 data points.
import numpy as np
import matplotlib.pyplot as plt
from mpl_toolkits.mplot3d import Axes3D
%matplotlib inline
from MoDE_embeddings.MoDE import MoDE
from sklearn import datasets
n_points = 500
X, color = datasets.make_s_curve(n_points, random_state=0)
mode = MoDE(n_neighbor=10, max_iter=40000, tol=0.001, n_components=2, verbose=True)
x_2d_mode = mode.fit_transform(X, color)
Axes3D
fig = plt.figure(figsize=(8, 5))
ax = fig.add_subplot(121, projection='3d')
ax.scatter(X[:, 0], X[:, 1], X[:, 2], c=color)
ax.view_init(10, -72)
ax.set_xticks([])
ax.set_yticks([])
ax.set_zticks([])
ax = fig.add_subplot(122)
im = ax.scatter(x_2d_mode[:, 0], x_2d_mode[:,1], c=color)
ax.set_xticks([])
ax.set_yticks([])
fig.subplots_adjust(right=0.98)
cbar_ax = fig.add_axes([0.99, 0.15, 0.01, 0.7])
cbar = fig.colorbar(im, cax=cbar_ax)
cbar.set_ticks([-4, 4])
cbar.set_ticklabels(["low score", "high score"])

Once the MoDE embeddings are trained, you can measure the fidelity of the embedded dataset to the original dataset in terms of preserving distances, correlations and orders. To do so, you can use the metric functions available from metrics module.
from MoDE_embeddings.metrics import distance_metric, correlation_metric, order_preservation
print("R_d:", distance_metric(X, x_2d_mode, n_neighbor=10))
print("R_c:", correlation_metric(X, x_2d_mode, n_neighbor=10))
print("R_o:", order_preservation(X, mode.P, n_neighbor=10, score=color.squeeze()))
R_d: 0.8581267537775847
R_c: 0.9915859179657047
R_o: 0.9506003430531732
Waterfilling algorithm (for data compression)
With waterfilling algorithm you can find tight lower and upper bounds on the pair-wise distances between data points that have been compressed using orthonormal
transforms, e.g, fourier transform. Using the WaterfillingCompression class you can compress the data by keeping only a small portion of fourier transform
coefficients. Then by calling the compute_distance_bounds method you are able to compute tight lower and upper bounds on pair-wise distances. For more information
on the waterfilling algorithm check out the paper: https://arxiv.org/pdf/1405.5873.pdf
from MoDE_embeddings.waterfilling_compression import WaterfillingCompression
comp = WaterfillingCompression(num_coeffs=4, coeffs_to_keep='optimal')
dm_ub, dm_lb = comp.compute_distance_bounds(data)
Project details
Download files
Download the file for your platform. If you're not sure which to choose, learn more about installing packages.
Source Distribution
Built Distribution
Hashes for MoDE_embeddings-0.0.8-py3-none-any.whl
| Algorithm | Hash digest | |
|---|---|---|
| SHA256 | e42ba20c3561449952bb68775fb30e3b742e41e2d9b4c5092e0faf8fc49432c4 |
|
| MD5 | cdad69e97f35b90be3b4638207b7df37 |
|
| BLAKE2b-256 | 0477642a4ed30823181e4f324e35af29a1182011fd5b179daa30e9e8e8b33e15 |


