A Multi Y axis Plotting Library based on Plotly

Project description
PolyY: A Flexible Multi Y-Axis (A Plotly based Library)
PolyY is a lightweight and intuitive Python library built on top of Plotly Graph Objects, designed to simplify the creation of multi–Y-axis interactive charts.With PolyY, you can easily visualize multiple datasets with different scales on the same figure — without losing clarity, interactivity, or control. The library provides a clean object-oriented interface to build, customize, and update complex figures in just a few lines of code.
Key Features
🔹 Multi Y-Axis Support: Effortlessly plot multiple series with independent Y-axes while maintaining alignment and scale integrity.
🔹 Built on Plotly Graph Objects: Leverages Plotly’s powerful graph_objects module for high-quality, interactive visualization.
🔹 Full Interactivity: Zoom, pan, hover, and toggle traces directly in the figure — no static images or re-renders needed.
🔹 Fine Figure Control: Access and modify each trace, axis, and layout component with full Plotly compatibility.
🔹 Dynamic Trace Management: Add, update, or restyle traces after creation — ideal for data exploration and dashboard integration.
New Enhancements:
*As of Version 0.1.5 : X title, auto color assign, enhanced documentation.
*As of Version 0.1.3 you can manually control right domain value (part of plotly subplot xaxis domain parameter)
Check the Layout.xaxis domain for more info.
*Transparecy is supported and controlled via opacity parameter, currently support for scatter, bar, line, step.
*Legend is Visible.
How to Use it Effectively.
The library is built as a single class interface to plotly via MakeFigure.It's built on OOP and it can be expanded with ease and new features can be implemented.Each line/element in the chart is added by using add_trace function (same function found in plotly.graph_objects module), each time this function is called, a single trace will be added to the chart.
1-Create the figure
from polyY.plotly import MakeFigure
fig = MakeFigure(right_domain=0.88) #if not provided, it will be calculated automatically and it can't take more than 50% or right domain
2-Add Traces
fig.add_trace(xdata, ydata, name_of_the_trace_goes_here, the_color, opacity)
#fig.add_trace(xdata, ydata, "Daily Sales", "red", opacity=0.3) =>  30%  trasparency
3-Show the Figure
fig.show()
4-Plotly Customizations fully applies to the figure
fig.update_layout(...)
fig.update_xaxes(...)
fig.update_yaxes(...)
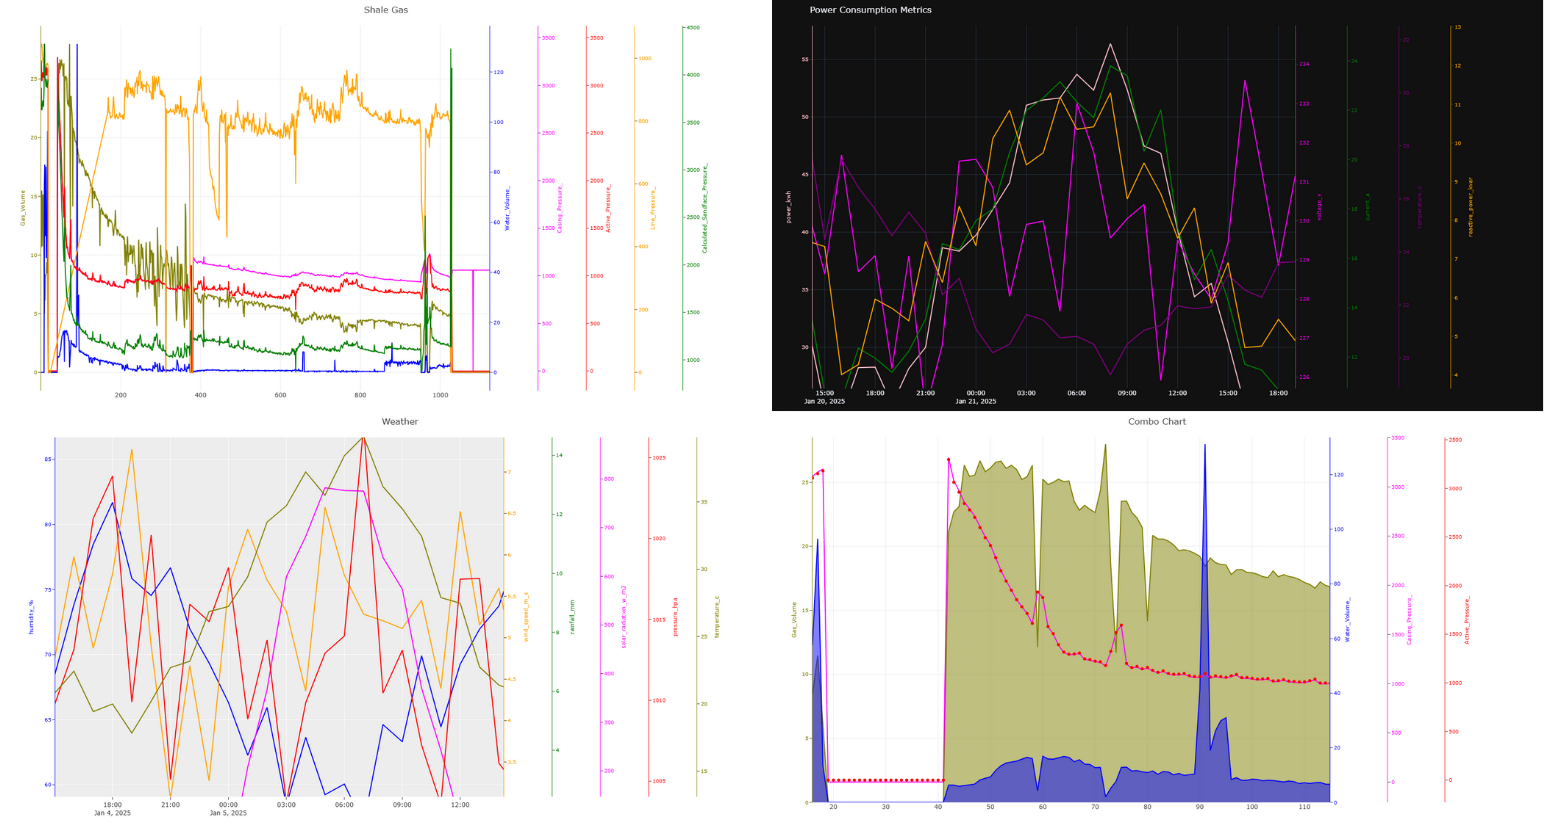
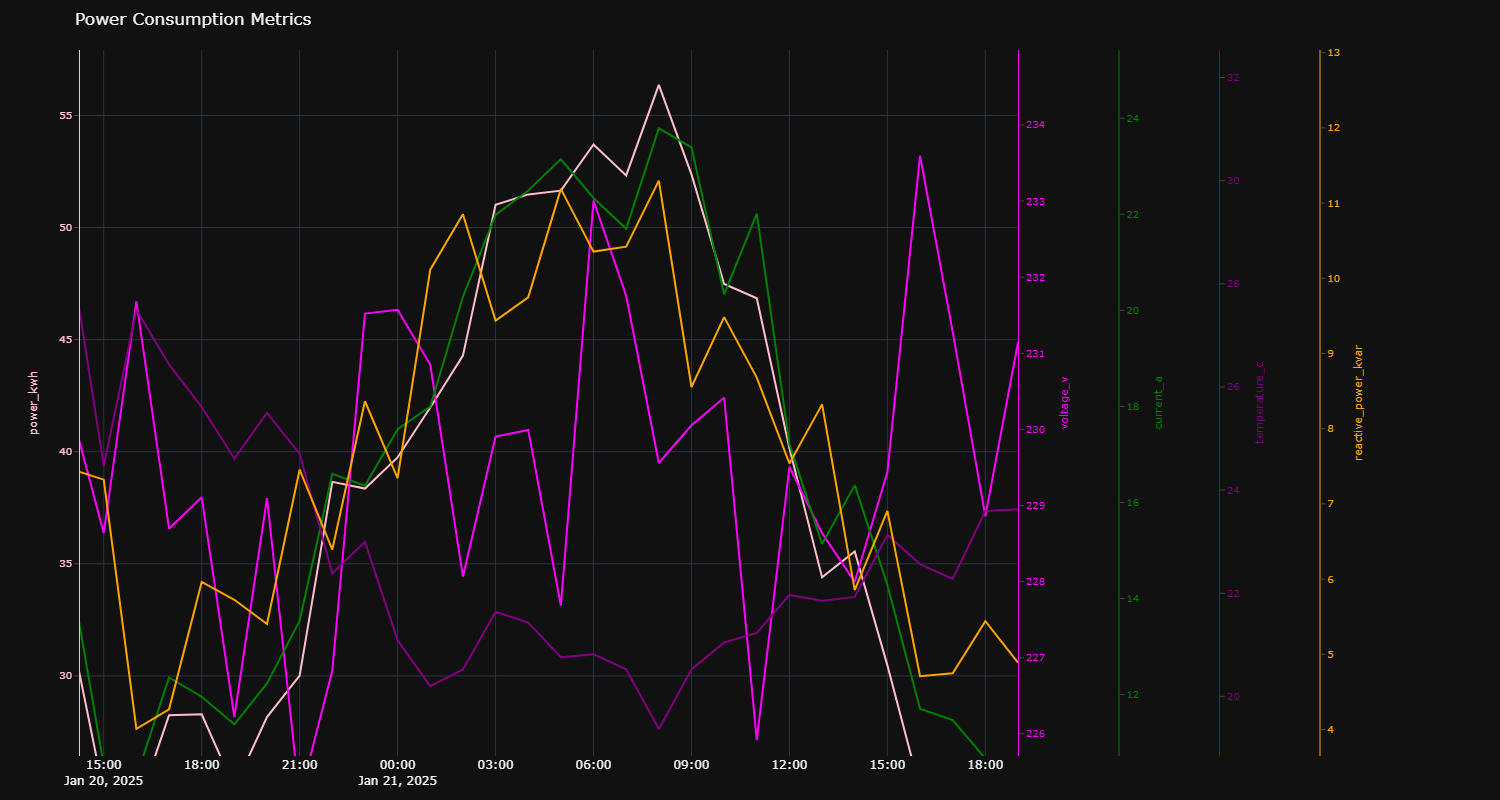
Example 1: Energy Industry Data
import polyY.plotly as plot
import pandas as pd

elect = pd.read_csv(r"data\electricity_consumption_data.csv")
x = elect.timestamp
ys = ['power_kwh', 'voltage_v', 'current_a', 'temperature_c', 'reactive_power_kvar']
clrs = ["pink", "magenta", "green", "purple", "orange"]

figure = plot.MakeFigure("Power Consumption Metrics", "plotly_dark")
for i in range(5):
    figure.add_trace(x, elect[ys[i]].to_list(), name=ys[i], kind="line", color=clrs[i])
figure.get_figure().update_layout(width=1500, height=800)
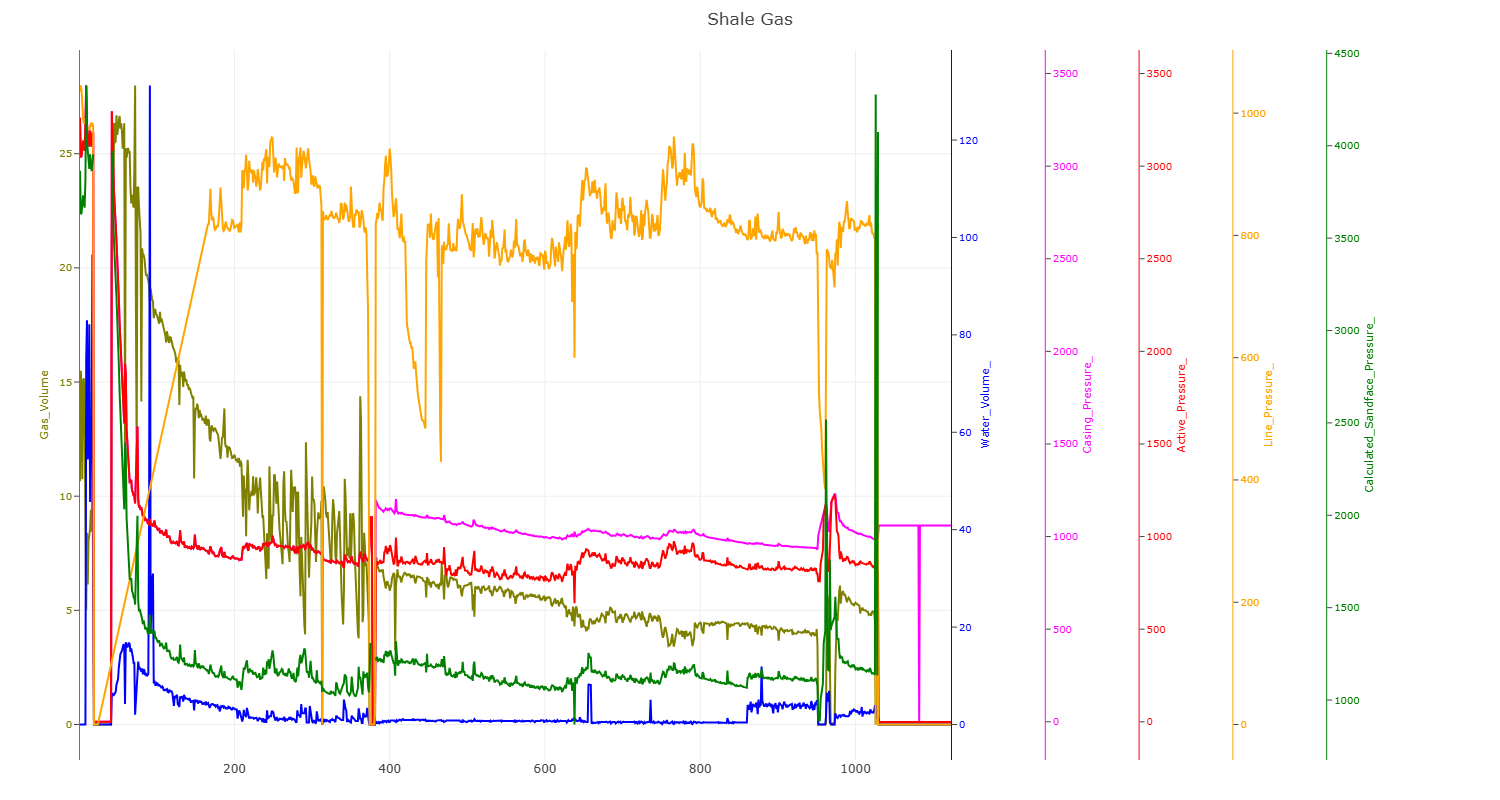
Example 2: Oil and Gas Data
import polyY.plotly as plot
import pandas as pd

data = pd.read_csv(r"data\oil and gas.txt", sep="\t")
x = data.Time_Days
ys = ['Gas_Volume', 'Water_Volume_', 'Casing_Pressure_', 'Active_Pressure_', 'Line_Pressure_', 'Calculated_Sandface_Pressure_']
clrs = ["olive", "blue", "magenta", "red", "orange", "green"]

figure = plot.MakeFigure("Oil and Gas Production Metrics", "none")
for i in range(6):
    figure.add_trace(x, data[ys[i]].to_list(), name=ys[i], kind="line", color=clrs[i])
figure.get_figure().update_layout(width=1500, height=800)
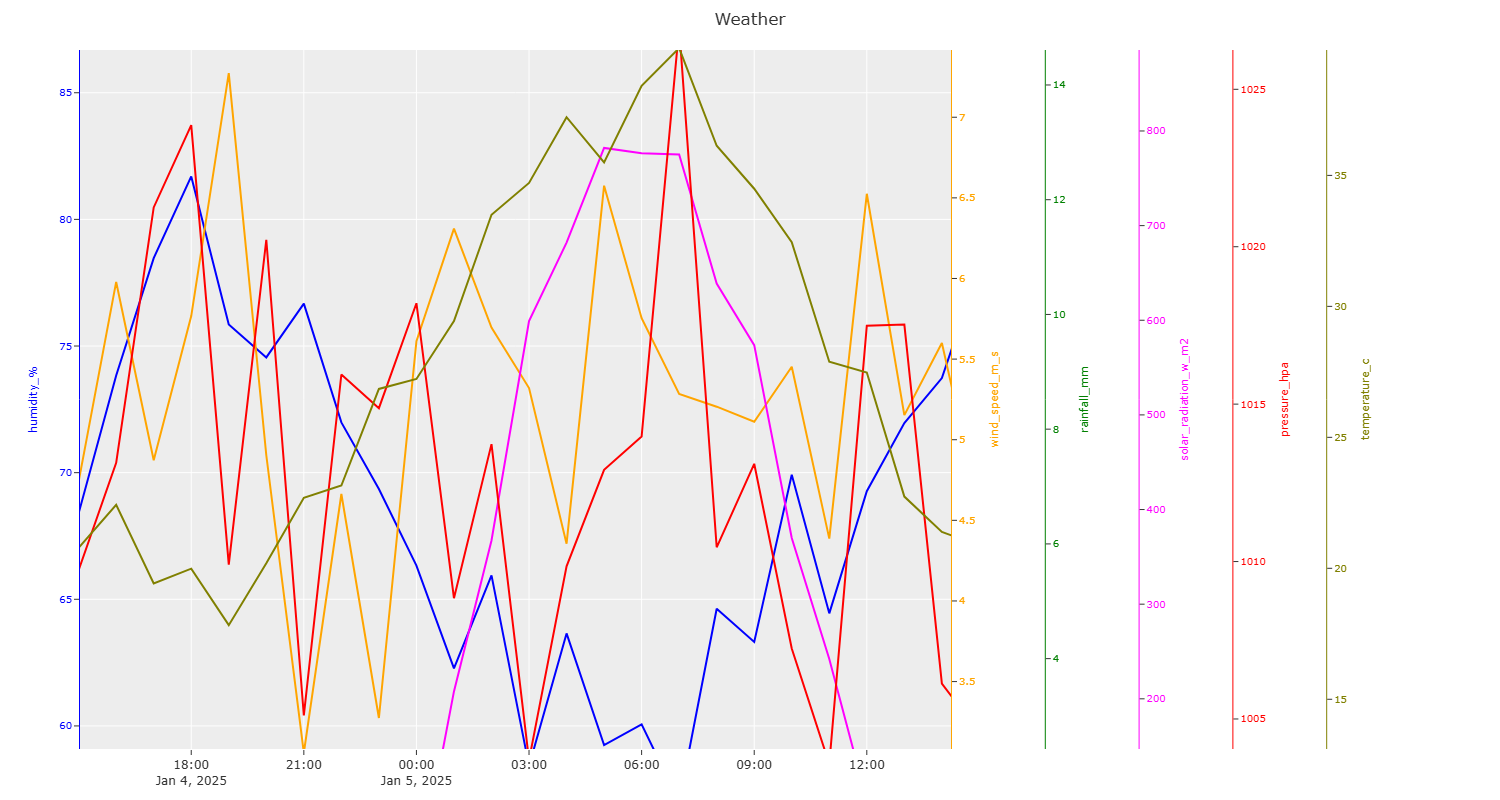
Example 3: Weather and Forecast Data
import polyY.plotly as plot
import pandas as pd

data = pd.read_csv(r"data\weather_data_500.csv")
x = data.timestamp
ys = ['humidity_%', 'wind_speed_m_s', 'rainfall_mm', 'solar_radiation_w_m2', 'pressure_hpa', 'temperature_c']
clrs = ["blue", "orange", "green", "magenta", "red", "olive"]

figure = plot.MakeFigure("Weather and Forecast Metrics", "ggplot2")
for i in range(6):
    figure.add_trace(x, data[ys[i]].to_list(), name=ys[i], kind="line", color=clrs[i])
figure.get_figure().update_layout(width=1500, height=800)
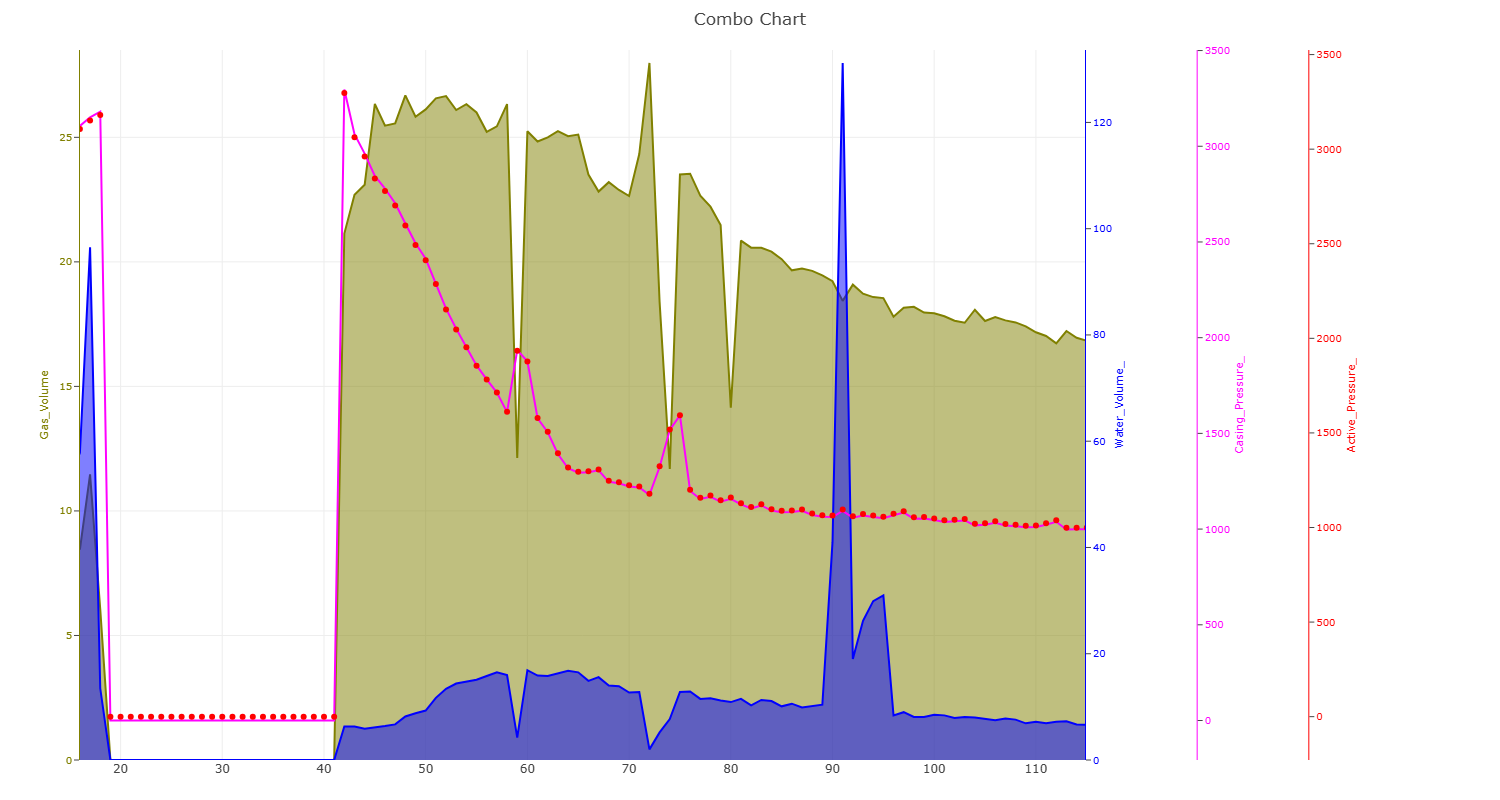
Example 4: Combo Chart
import polyY.plotly as plot
import pandas as pd

data = pd.read_csv(r"data\oil and gas.txt", sep="\t")
x = data.Time_Days
ys = ['Gas_Volume', 'Water_Volume_', 'Casing_Pressure_', 'Active_Pressure_']
clrs = ["olive", "blue", "magenta", "red"]
types = ["area", "area", "line", "scatter"]

figure = plot.MakeFigure("Combo Chart Example", "none")
for i in range(4):
    figure.add_trace(x, data[ys[i]].to_list(), name=ys[i], kind=types[i], color=clrs[i])
figure.get_figure().update_layout(width=1500, height=800)
Example 5: Add Charting Elements Selectively
import polyY.plotly as plot
import plolty.graph_objects as go
import pandas as pd

data = pd.read_csv(r"data\oil and gas.txt", sep="\t")
x = data.Time_Days
ys = ['Gas_Volume', 'Water_Volume_', 'Casing_Pressure_', 'Active_Pressure_']
clrs = ["olive", "blue", "magenta", "red"]
types = ["area", "area", "line", "scatter"]

figure = plot.MakeFigure("Combo Chart Example", "none")
for i in range(4):
    figure.add_trace(x, data[ys[i]].to_list(), name=ys[i], kind=types[i], color=clrs[i])
for n in other_data:
    # for yaxis, you can choose from y,   y2,             y3,                  y4
    # yaxis as created : 'Gas_Volume', 'Water_Volume_', 'Casing_Pressure_', 'Active_Pressure_'
    figure.get_figure().add_trace(go.Line(data.Time_Days, data[n], name="Suplementary Curves"+n, yaxis="y2"))

figure.get_figure().update_layout(width=1500, height=800)
Release history Release notifications | RSS feed


Download files
Download the file for your platform. If you're not sure which to choose, learn more about installing packages.
Source Distribution
Built Distribution
Filter files by name, interpreter, ABI, and platform.
If you're not sure about the file name format, learn more about wheel file names.
Copy a direct link to the current filters
File details
Details for the file polyy-0.1.5.tar.gz.
File metadata
- Download URL: polyy-0.1.5.tar.gz
- Upload date:
- Size: 5.9 kB
- Tags: Source
- Uploaded using Trusted Publishing? No
- Uploaded via: twine/6.2.0 CPython/3.13.9
File hashes
| Algorithm | Hash digest | |
|---|---|---|
| SHA256 |
20a9284ee157995cfc1aab79bd9afa68fed34201a8874040e67fe2b37634c307
|
|
| MD5 |
f7f79f70531ea57204443ed8de737959
|
|
| BLAKE2b-256 |
d41ec7799da88e0856ce70fde39b5e3a3533765cf324841edba06597035bbaa2
|
File details
Details for the file polyy-0.1.5-py3-none-any.whl.
File metadata
- Download URL: polyy-0.1.5-py3-none-any.whl
- Upload date:
- Size: 5.9 kB
- Tags: Python 3
- Uploaded using Trusted Publishing? No
- Uploaded via: twine/6.2.0 CPython/3.13.9
File hashes
| Algorithm | Hash digest | |
|---|---|---|
| SHA256 |
5ac1d15a93c1b83f988c4988e3a191577c2cd8e96bff13ced83a86e6a5c9d42e
|
|
| MD5 |
8074cacdc4b078aee551744c15c3f506
|
|
| BLAKE2b-256 |
154a81f345dd005dc345722512e3471331a87a89363d7f28f8664b768bda738e
|


