Wrapper for SignalHound spectrum analysers.

Project description
pySignalHound
=============
A python wrapper for the Test Equipment Plus SignalHound series of spectrum
analyzers.
The primary file is "SignalHound.py". It defines one class, "SignalHound()",
that currently can only open the first signal-hound analyser it finds.
Predominantly, all C API errors should be caught, and re-raised as python
exceptions with helpful error messages.
Also, there is *some* error checking for function parameters. I should probably
go through and add `{library}.{function}.restype = {something}` type hints to
all the function calls, but I think the fact that I'm explicitly casting all
parameters to ctypes values should somewhat ameliorate that need.
~~At the moment, the one function that takes a callback (`bbStartRawSweepLoop`)
properly wraps a passed python function, so it gets called via the C callback,
though it still relys on the user decoding the C function call arguments. I
want to do something about that in the near future.~~ (Raw sweep mode is
depreciated.)
Currently, I can only test with a BB60C, as that is the only unit I have
on-hand. It should work with a BB60A without too much trouble, though (it has
provisions for it, and I did my initial dev work with a BB60A. I just upgraded
later).
---
Installation:
`python setup.py install`
This will drop the `bb_api.dll` dll in your `{python-dir}/DLLs/` directory, as
well as install the SignalHound wrapper.
---
The primary API contained in the `SignalHound/__init__.py` file.
`bb_api_h.py` is a transliteration of the bb_api.h file from the C api, and
primarily defines most of the configuration constants used for controlling
the SignalHound. It contains no executable code.
`tests.py` contains a number of different hardware test facilities.
`tests.py` is a good proof-of-concept demo. It's currently messy, but it shows
the capabilities of both python and the SignalHound.
- `python tests.py radio {frequency-in-hz}` will do real-time software
decoding and playback of FM radio.
- `python tests.py raw-pipe` will log the full-rate 160 MBPS data-stream to
disk in real-time (requires a SSD).
- `python tests.py callback` demonstrates the ability to have the C api
callback into pure python code
Utilities:
- `python tests.py status` prints the connected hardware version, serial,
- firmware version, and API version, as well as querying the hardware
- diagnostics values.
- `python tests.py reset` triggers a firmware-level reset of the hardware,
- equivalent to disconnecting and reconnecting the USB interface.
While `tests.py` is functional, it's very messily written. Cleanup is needed.
The API files themselves are fairly coherent, however.
The ability to configure some of the test-modes is also a good idea, though it
also needs to be implemented.
`spectraLog.py` is the script that is why I wrote the API in the first place.
It does long-duration (days!) spectrum logging for site-survey purposes and
analysis. It is a fully-multi-process tool that does on-the-fly averaging of
the incoming data-stream to reduce disk load.
Note: `spectraLog.py` is aggressively multi-process, and you **must** stop it
by typing "q" + \[enter\], to properly signal all the running processes to
exit. A typical Ctrl+C will just signal the process attached to the console to
exit, but due to a quirk in the `multiprocessing` module, I cannot properly
install a signal handler to catch the Ctrl+C in a proper manner. Yes, this is
irritating. I will probably look at solving it eventually.
All the behaviour of `spectraLog.py` is controlled by the configuration
variables in `settings.py` in the `SpectraLogger` directory. This file also
contains fairly extensive documentation, and should be fairly self-explanitory.
The `spectraLog.py` tool exposes *most* of the functionality of the signalhound,
though most of the raw-data modes are either not supported or poorly
(or entirely un)tested.
---
Currently, there is also a prototype visualization tool as well (`main.py` in
the `RealtimeSpectraLogTool` directory):
The visualization tool connects to a running acquisition session, and retreives
scans from the currently running acquisition. The advantage of this is that it
can connect and disconnect from a running acquisition, all without interrupting
the actual data-logging in the acquisition.
Also, the current interface for the visualization and acquisition scripts is
over TCP, so you can connect to a running acquisition on one computer, and view
the plots of the data on a different computer
(`python main.py {computer running acq's IP}`).
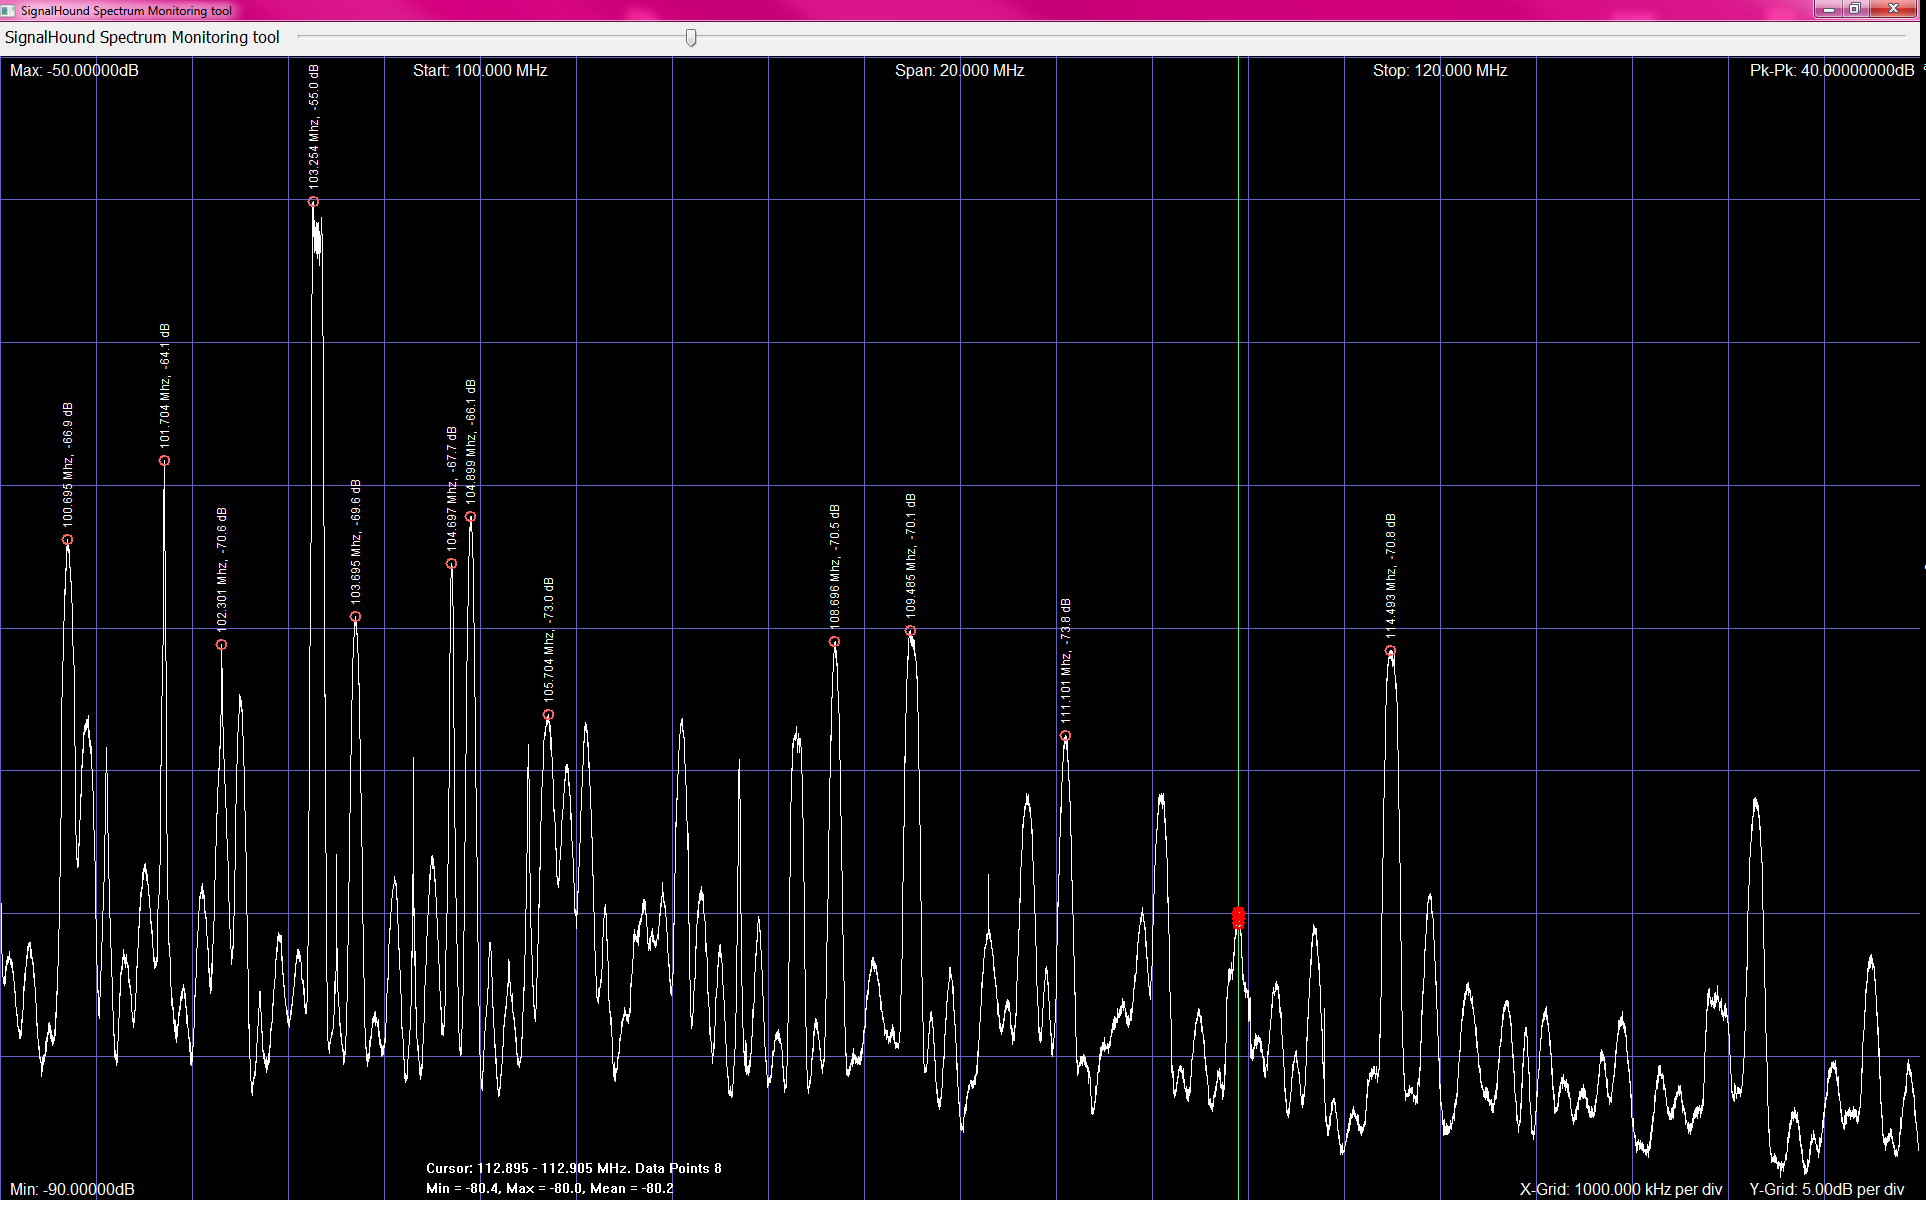
The visualization tool also generates some simple statistics for the acquired
data, as well as automatically highlighting all the peaks above a certain
threshold in the display (adjustable with the slider at the top of the window).
Lastly, it features a mouse-cursor that gives the minimum, maximum, and mean
value of the data under the mouse cursor in realtime, as well as highlighting
the data-points in the column that is mouse-overed (each column is 1 pixel, and
given the fact that displays are typically 1000-3000 pixels wide, and the sweeps
are generally ~16Kitems, each pixel "column" has >10 items).
The cursor is the vertical green line in the screenshots.
Each datapoint is highlighted with a red circle.
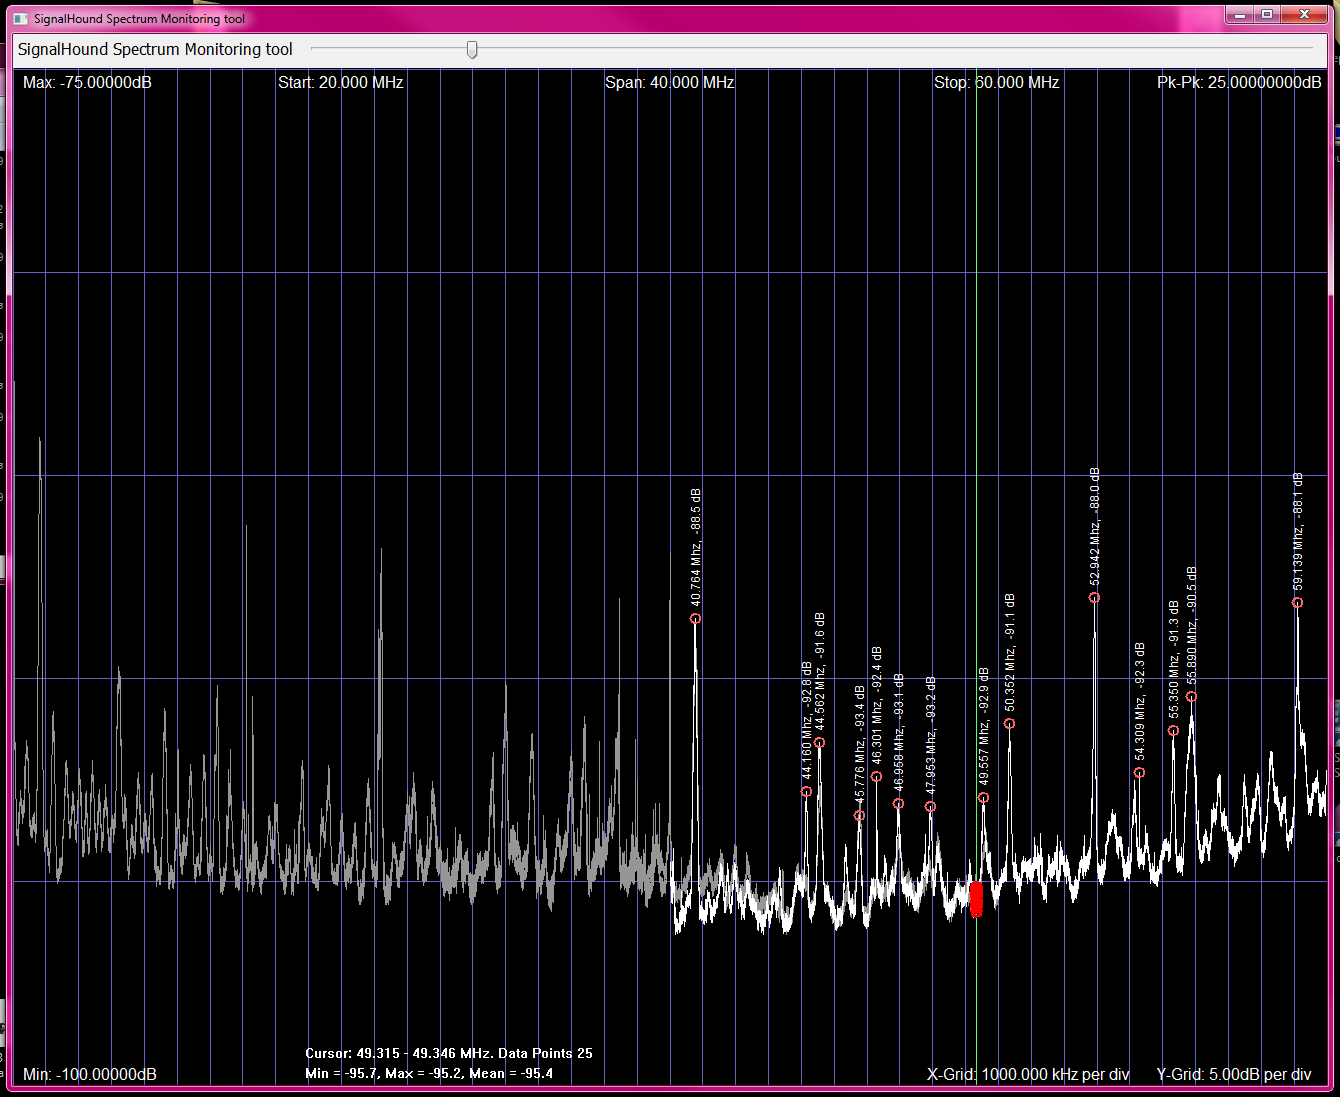
The visualization also has extensions to support the custom pseudo-sweeping
mode that is implemented in `internalSweepSpectraAcqThread.py`. This is a
special acquisition mode that is implemented for some of the astrophysics
data-acquisition we want to do. Basically, it runs the hardware in `realtime`
mode, but every `n` scans in realtime mode, it halts the acquisition, changes
the frequency, and starts acquiring in realtime at the new frequency. It has
configurable overlap for each frequency step. as well as configurable frequency
and span.
In the stepped mode, only the latest data row is active with regard to the
cursor, though the entire swept range is displayed. The older data is the
slightly darker grey colour.
---
The special pseudo-sweeping mode is specifically to allow much greater control
and insight into the integration time of the SignalHound. One of the issues
with the SignalHound's internal `sweeping` mode is the actual percentage of the
time the system is *actually* acquiring data is not well known. In the
`realtime` mode, the observation time is 100%, so it's clearly established,
but the bandwidth is limited to 20 Mhz.
By stepping the system through frequencies at a low rate (typically > 10
seconds per frequency), we can achieve a observation time efficiency of nearly
100% / number of observation bands, which allows us to rigidly quantify actual
signal strength when integrating data over many hours.
Since the signals we're interested in are astrophysical phenomenon, and we
expect to *need* many hours or days of integration time to resolve the signals
from both the system and physical noise, being able to define precisely the
actual duration each frequency was acquired for is vital.
The SignalHound does take some time to re-tune the frontend when stepping
frequencies (~1 second), which is unfortunate, but the loss here can simply be
offset by integrating at each frequency for a longer period of time.
Unfortunately, the SignalHound API does not allow re-tuning of the frontend
while acquiring in `realtime` mode. Interestingly enough, you *can* call the `configureCenterSpan` function on a running acquisition, and it returns with
a "succeeded" call status, but appears to do nothing.
---
Dependencies:
`SignalHound.py` requires:
- Numpy
- Windows or Linux Python 2.7.* install (cygwin's python install does not
have a functional `ctypes.wintypes`)
`tests.py` additionally requires:
- `pyaudio` (for the "radio" test only)
The `SpectraLogger\main.py` long-term spectra logging tool additionally requires:
- h5py (For writing log files)
- colorama (better console output)
The `RealtimeSpectraLogTool\main.py` also requires:
- wxPython >= 2.9
---
* ----------------------------------------------------------------------------
* "THE BEER-WARE LICENSE":
* Connor Wolf <wolf@imaginaryindustries.com> wrote this file. As long as you retain
* this notice you can do whatever you want with this stuff. If we meet some day,
* and you think this stuff is worth it, you can buy me a beer in return.
* (Only I don't drink, so a soda will do). Connor
* Also, support the Signal-Hound devs. Their hardware is pretty damn awesome.
* ----------------------------------------------------------------------------
=============
A python wrapper for the Test Equipment Plus SignalHound series of spectrum
analyzers.
The primary file is "SignalHound.py". It defines one class, "SignalHound()",
that currently can only open the first signal-hound analyser it finds.
Predominantly, all C API errors should be caught, and re-raised as python
exceptions with helpful error messages.
Also, there is *some* error checking for function parameters. I should probably
go through and add `{library}.{function}.restype = {something}` type hints to
all the function calls, but I think the fact that I'm explicitly casting all
parameters to ctypes values should somewhat ameliorate that need.
~~At the moment, the one function that takes a callback (`bbStartRawSweepLoop`)
properly wraps a passed python function, so it gets called via the C callback,
though it still relys on the user decoding the C function call arguments. I
want to do something about that in the near future.~~ (Raw sweep mode is
depreciated.)
Currently, I can only test with a BB60C, as that is the only unit I have
on-hand. It should work with a BB60A without too much trouble, though (it has
provisions for it, and I did my initial dev work with a BB60A. I just upgraded
later).
---
Installation:
`python setup.py install`
This will drop the `bb_api.dll` dll in your `{python-dir}/DLLs/` directory, as
well as install the SignalHound wrapper.
---
The primary API contained in the `SignalHound/__init__.py` file.
`bb_api_h.py` is a transliteration of the bb_api.h file from the C api, and
primarily defines most of the configuration constants used for controlling
the SignalHound. It contains no executable code.
`tests.py` contains a number of different hardware test facilities.
`tests.py` is a good proof-of-concept demo. It's currently messy, but it shows
the capabilities of both python and the SignalHound.
- `python tests.py radio {frequency-in-hz}` will do real-time software
decoding and playback of FM radio.
- `python tests.py raw-pipe` will log the full-rate 160 MBPS data-stream to
disk in real-time (requires a SSD).
- `python tests.py callback` demonstrates the ability to have the C api
callback into pure python code
Utilities:
- `python tests.py status` prints the connected hardware version, serial,
- firmware version, and API version, as well as querying the hardware
- diagnostics values.
- `python tests.py reset` triggers a firmware-level reset of the hardware,
- equivalent to disconnecting and reconnecting the USB interface.
While `tests.py` is functional, it's very messily written. Cleanup is needed.
The API files themselves are fairly coherent, however.
The ability to configure some of the test-modes is also a good idea, though it
also needs to be implemented.
`spectraLog.py` is the script that is why I wrote the API in the first place.
It does long-duration (days!) spectrum logging for site-survey purposes and
analysis. It is a fully-multi-process tool that does on-the-fly averaging of
the incoming data-stream to reduce disk load.
Note: `spectraLog.py` is aggressively multi-process, and you **must** stop it
by typing "q" + \[enter\], to properly signal all the running processes to
exit. A typical Ctrl+C will just signal the process attached to the console to
exit, but due to a quirk in the `multiprocessing` module, I cannot properly
install a signal handler to catch the Ctrl+C in a proper manner. Yes, this is
irritating. I will probably look at solving it eventually.
All the behaviour of `spectraLog.py` is controlled by the configuration
variables in `settings.py` in the `SpectraLogger` directory. This file also
contains fairly extensive documentation, and should be fairly self-explanitory.
The `spectraLog.py` tool exposes *most* of the functionality of the signalhound,
though most of the raw-data modes are either not supported or poorly
(or entirely un)tested.
---
Currently, there is also a prototype visualization tool as well (`main.py` in
the `RealtimeSpectraLogTool` directory):

The visualization tool connects to a running acquisition session, and retreives
scans from the currently running acquisition. The advantage of this is that it
can connect and disconnect from a running acquisition, all without interrupting
the actual data-logging in the acquisition.
Also, the current interface for the visualization and acquisition scripts is
over TCP, so you can connect to a running acquisition on one computer, and view
the plots of the data on a different computer
(`python main.py {computer running acq's IP}`).
The visualization tool also generates some simple statistics for the acquired
data, as well as automatically highlighting all the peaks above a certain
threshold in the display (adjustable with the slider at the top of the window).
Lastly, it features a mouse-cursor that gives the minimum, maximum, and mean
value of the data under the mouse cursor in realtime, as well as highlighting
the data-points in the column that is mouse-overed (each column is 1 pixel, and
given the fact that displays are typically 1000-3000 pixels wide, and the sweeps
are generally ~16Kitems, each pixel "column" has >10 items).
The cursor is the vertical green line in the screenshots.
Each datapoint is highlighted with a red circle.

The visualization also has extensions to support the custom pseudo-sweeping
mode that is implemented in `internalSweepSpectraAcqThread.py`. This is a
special acquisition mode that is implemented for some of the astrophysics
data-acquisition we want to do. Basically, it runs the hardware in `realtime`
mode, but every `n` scans in realtime mode, it halts the acquisition, changes
the frequency, and starts acquiring in realtime at the new frequency. It has
configurable overlap for each frequency step. as well as configurable frequency
and span.
In the stepped mode, only the latest data row is active with regard to the
cursor, though the entire swept range is displayed. The older data is the
slightly darker grey colour.
---
The special pseudo-sweeping mode is specifically to allow much greater control
and insight into the integration time of the SignalHound. One of the issues
with the SignalHound's internal `sweeping` mode is the actual percentage of the
time the system is *actually* acquiring data is not well known. In the
`realtime` mode, the observation time is 100%, so it's clearly established,
but the bandwidth is limited to 20 Mhz.
By stepping the system through frequencies at a low rate (typically > 10
seconds per frequency), we can achieve a observation time efficiency of nearly
100% / number of observation bands, which allows us to rigidly quantify actual
signal strength when integrating data over many hours.
Since the signals we're interested in are astrophysical phenomenon, and we
expect to *need* many hours or days of integration time to resolve the signals
from both the system and physical noise, being able to define precisely the
actual duration each frequency was acquired for is vital.
The SignalHound does take some time to re-tune the frontend when stepping
frequencies (~1 second), which is unfortunate, but the loss here can simply be
offset by integrating at each frequency for a longer period of time.
Unfortunately, the SignalHound API does not allow re-tuning of the frontend
while acquiring in `realtime` mode. Interestingly enough, you *can* call the `configureCenterSpan` function on a running acquisition, and it returns with
a "succeeded" call status, but appears to do nothing.
---
Dependencies:
`SignalHound.py` requires:
- Numpy
- Windows or Linux Python 2.7.* install (cygwin's python install does not
have a functional `ctypes.wintypes`)
`tests.py` additionally requires:
- `pyaudio` (for the "radio" test only)
The `SpectraLogger\main.py` long-term spectra logging tool additionally requires:
- h5py (For writing log files)
- colorama (better console output)
The `RealtimeSpectraLogTool\main.py` also requires:
- wxPython >= 2.9
---
* ----------------------------------------------------------------------------
* "THE BEER-WARE LICENSE":
* Connor Wolf <wolf@imaginaryindustries.com> wrote this file. As long as you retain
* this notice you can do whatever you want with this stuff. If we meet some day,
* and you think this stuff is worth it, you can buy me a beer in return.
* (Only I don't drink, so a soda will do). Connor
* Also, support the Signal-Hound devs. Their hardware is pretty damn awesome.
* ----------------------------------------------------------------------------
Release history Release notifications | RSS feed


Download files
Download the file for your platform. If you're not sure which to choose, learn more about installing packages.
Source Distribution
PySignalHound-0.0.2.zip
(39.1 kB
view details)
File details
Details for the file PySignalHound-0.0.2.zip.
File metadata
- Download URL: PySignalHound-0.0.2.zip
- Upload date:
- Size: 39.1 kB
- Tags: Source
- Uploaded using Trusted Publishing? No
File hashes
| Algorithm | Hash digest | |
|---|---|---|
| SHA256 |
eedca60ad18151c797862a53c2384d36535f8cf43be48a7687f6d61fecd640b0
|
|
| MD5 |
f2d3e20c72fff11256ba4749830805c5
|
|
| BLAKE2b-256 |
a21a620bc407ec24960d37c197ec2a355b94731f23009b0f193f08527ee079ae
|


