
██████╗ ██╗   ██╗███╗   ██╗███████╗ ██████╗ ██████╗
██╔══██╗╚██╗ ██╔╝████╗  ██║╚══███╔╝██╔═══██╗██╔══██╗
██████╔╝ ╚████╔╝ ██╔██╗ ██║  ███╔╝ ██║   ██║██████╔╝
██╔═══╝   ╚██╔╝  ██║╚██╗██║ ███╔╝  ██║   ██║██╔══██╗
██║        ██║   ██║ ╚████║███████╗╚██████╔╝██║  ██║
╚═╝        ╚═╝   ╚═╝  ╚═══╝╚══════╝ ╚═════╝ ╚═╝  ╚═╝
CTF and lab web recon from one interactive dashboard — or one clean Python CLI.




Ports · Directories · Headers · SQLi probes · XSS probes · Subdomains · JSON/HTML reports
Why Pynzor
Pynzor is built for fast, authorized web recon in CTFs, training labs, and internal test environments. It gives you the common first-pass checks in one place without turning into an exploitation framework.
- Interactive by default: run
Pynzorwith no arguments for a full-screen dashboard with live progress, streaming results, and one-key export. - CTF/lab friendly: quick scans, bundled wordlists, readable terminal output.
- Recon coverage: port checks, directory fuzzing, security headers, SQLi/XSS detection probes, and subdomain enumeration.
- Async-first:
httpx-powered HTTP workflows with configurable concurrency. - Operator output: colorized tables for humans plus JSON/HTML reports for notes and handoff.
- Safe by design: detection and probing only. No dumping, shelling, persistence, or destructive payloads.
Install
Use pipx for an isolated CLI install:
pipx install Pynzor
Pynzor --help
The CLI is available as both Pynzor and the lowercase pynzor — the two are
interchangeable, so use whichever you prefer.
Install with pip if you prefer managing the environment yourself:
pip install Pynzor
Run from source:
git clone https://github.com/yal212/Pynzor.git
cd Pynzor
uv sync
uv run Pynzor --help
Dashboard
Run Pynzor with no arguments in a terminal and you get the dashboard, laid
out like lazygit: a column of side panels you jump to by number, a main panel
that always shows whatever the focused panel is pointing at, a command log, and
a bottom bar listing the keys that work right here.
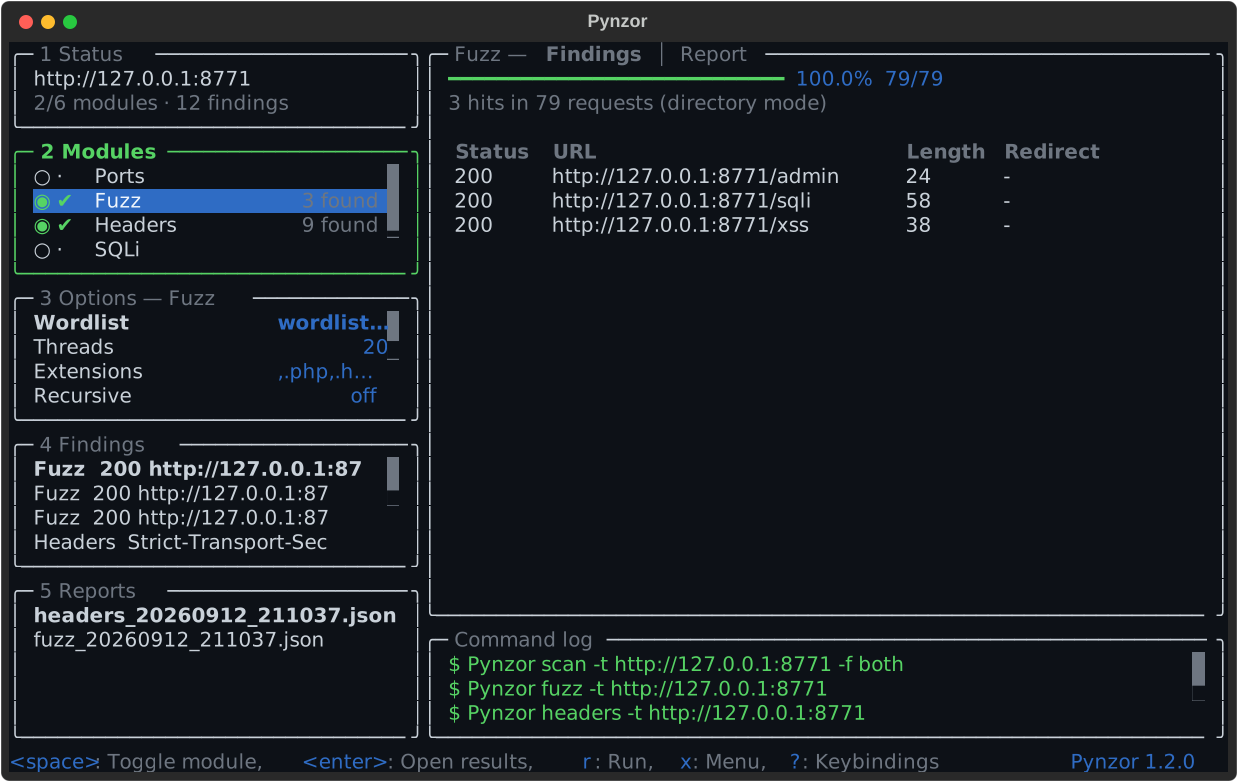
Five side panels, numbered in their borders, jumped to with 1-5 or cycled
with <tab>; l and h move between the column and the main panel. All five
stay open and share the height, as lazygit does, so focus moves the border
rather than reflowing the column. It also fits 80x24, the smallest terminal it
targets, where each panel is down to two or three rows and scrolls.
That screenshot is generated, not drawn: docs/images/make_screenshot.py runs
the real dashboard against a local HTTP fixture, lets a scan finish, and exports
what Textual rendered. Regenerate it with
uv run python docs/images/make_screenshot.py whenever the layout changes.
Colours come from your terminal, not from Pynzor: the dashboard draws in the sixteen ANSI colours and leaves the background alone, so it picks up your theme and stays translucent if your terminal is. A static image has to commit to one palette, so the screenshot above is not what it will look like for you — it will look like your terminal.
| # | Panel | The main panel then shows |
|---|---|---|
| 1 | Status | The session: target, selection, findings, equivalent CLI command |
| 2 | Modules | That module's progress, verdict, and findings table |
| 3 | Options | The highlighted option's help, value, and config.yaml path |
| 4 | Findings | The highlighted finding, expanded field by field |
| 5 | Reports | The saved report envelope |
Press ? for the cheatsheet or x for a menu of everything available right
now — you never have to remember a key to find one.
Keys
| Key | Scope | Does |
|---|---|---|
1 |
Panels | Status panel |
2 |
Panels | Modules panel |
3 |
Panels | Options panel |
4 |
Panels | Findings panel |
5 |
Panels | Reports panel |
<tab> |
Panels | Next panel |
<s-tab> |
Panels | Previous panel |
l |
Panels | Focus main panel |
h |
Panels | Focus side panel |
0 |
Panels | Main view |
j |
Navigation | Down |
k |
Navigation | Up |
g |
Navigation | Top |
G |
Navigation | Bottom |
. |
Navigation | Page down |
, |
Navigation | Page up |
<c-d> |
Navigation | Scroll main down |
<c-u> |
Navigation | Scroll main up |
<esc> |
Navigation | Back |
r |
Run | Run |
s |
Run | Stop |
e |
Run | Export reports |
c |
Run | Copy CLI command |
+ |
View | Bigger main panel |
_ |
View | Smaller main panel |
@ |
View | Command log |
/ |
View | Filter |
x |
App | Menu |
? |
App | Keybindings |
<c-p> |
App | Command palette |
q |
App | Quit |
<enter> |
Status | Set target |
<space> |
Modules | Toggle module |
<enter> |
Modules | Open results |
] |
Modules | Next tab |
[ |
Modules | Previous tab |
<enter> |
Options | Edit value |
d |
Options | Reset to config default |
<enter> |
Findings | Expand |
<enter> |
Reports | Open report |
d |
Reports | Refresh listing |
What it does:
- Live progress — per-module bars fill as ports, words, and payloads complete, and hits stream into the table the moment they are found rather than appearing all at once at the end.
- The main panel follows you — move the cursor in any side panel and the
right-hand side re-renders for whatever is under it.
<enter>pushes focus into it for a closer look,<esc>comes back, and<c-d>/<c-u>scroll it without giving up your place in the list. - Findings in one place — panel
4is every finding from the last run, flattened across modules, with the full evidence, payload, banner, or remediation note the summary table clips. - Options are a panel, not a mode — panel
3always shows the options for the module you are looking at, seeded from yourconfig.yaml.<enter>edits one,dputs the default back. - It teaches the CLI — the command log shows the exact
Pynzor <command>each module corresponds to as it runs.ccopies it, ready for a writeup. - Sized for real terminals —
+/_cycle the main panel between normal, half, and full screen;@hides the command log;/filters a list.
Export (e) writes the same schema_version: 1 JSON the CLI writes, through
the same reporter — dashboard output and Pynzor <command> output are
interchangeable.
Launch it with a target already filled in:
Pynzor tui -t https://target.lab
The CLI is unchanged. Passing any argument takes the normal flag-driven path, and a bare run that is not attached to a terminal (a pipe, a script, CI) prints help exactly as it always has — so scripts and the recorded demo keep working.
Quickstart
Run a full recon pass and write reports:
Pynzor scan -t https://target.lab -f both
Check exposed ports with service detection:
Pynzor ports -t target.lab -p 22,80,443,8000-9000 -sV -oN notes/ports.txt
Fuzz web content with the bundled directory wordlist:
Pynzor fuzz -t https://target.lab --threads 30
Use ffuf-style request fuzzing with the FUZZ keyword:
Pynzor fuzz -t https://target.lab/login -X POST \
  -H 'Content-Type: application/x-www-form-urlencoded' \
  -d 'username=admin&password=FUZZ' \
  -w ./wordlists/passwords.txt -fc 401
Review a saved JSON report:
Pynzor report docs/samples/sample_report.json
Commands
| Command | Purpose |
|---|---|
Pynzor scan |
Run the full recon workflow against a target. |
Pynzor ports |
Scan TCP ports with optional service/version detection. |
Pynzor fuzz |
Run directory fuzzing or FUZZ-keyword request fuzzing. |
Pynzor headers |
Score common security headers. |
Pynzor sqli |
Probe URL parameters for SQL injection indicators. |
Pynzor xss |
Probe reflected XSS indicators. |
Pynzor subdomain |
Enumerate subdomains from a wordlist. |
Pynzor report |
Print a saved JSON report. |
Pynzor tui |
Launch the interactive dashboard (the default with no arguments). |
Global helpers:
Pynzor --help
Pynzor --version
Reports
Pynzor writes reports to ./reports by default.
Pynzor scan -t https://target.lab -f json
Pynzor scan -t https://target.lab -f html
Pynzor scan -t https://target.lab -f both
Sample outputs:
Demo
A recorded terminal session is tracked as an asciinema cast at
docs/demo/pynzor-demo.cast. It walks through
--version, headers, ports, fuzz, and report against a local
127.0.0.1 fixture — no public target is scanned. Replay it locally with:
asciinema play docs/demo/pynzor-demo.cast
or upload it to asciinema.org to share a web player.
Regenerate the cast at any time (it captures real CLI output against the local fixture, so no external network is used):
uv run python docs/demo/record_demo.py
Prefer a manual recording? Start a local fixture and run asciinema rec while
you drive the commands yourself. The step-by-step written walkthrough is in
docs/demo/terminal-demo.md.
Video demo:
Configuration
Pynzor ships a single canonical default config, bundled inside the package at
src/pynzor/cli/config.yaml. It is loaded automatically on every run — no setup
required. To customize, copy it somewhere writable and point --config at your
copy:
# copy the bundled default out of the installed package
python -c "import importlib.resources as r, shutil; shutil.copy(r.files('pynzor.cli') / 'config.yaml', 'pynzor.config.yaml')"
Pynzor scan -t https://target.lab --config ./pynzor.config.yaml
Bundled wordlists (src/pynzor/cli/wordlists/) and the HTML report template are
resolved relative to the config file, so both editable installs and standalone
binaries find them without any extra configuration.
Going faster in a lab
Every module's request rate is configurable. The shipped defaults are deliberately polite; against a local target you can drop them.
Copy the bundled default as shown above — a config file must currently be complete, since some commands read their section directly (#17) — then change the rate limits:
fuzzer:
  rate_limit: 0        # default 0.1s between requests
  threads: 50
sqli:
  rate_limit: 0        # default 0.2
xss:
  rate_limit: 0        # default 0.2
Pynzor fuzz -t http://127.0.0.1:8888 -c my-lab.yaml
Pynzor tui -c my-lab.yaml
Only turn this down on targets you own. The defaults exist so Pynzor doesn't trip rate limiting or WAFs on shared CTF infrastructure.
Configurable areas:
- HTTP timeout, retries, user-agent, redirect behavior, and SSL verification.
- Per-module request rate limits (
fuzzer,sqli,xss,subdomain). - Scanner ports, timeouts, service detection, and concurrency.
- Fuzzer status codes, request match/filter rules, extensions, recursion depth, and wordlists.
- Subdomain wordlist and concurrency.
- Output format and report directory.
Download Binaries
Tagged GitHub releases build PyInstaller binaries for Windows, macOS, and Linux:
| Platform | File | Run |
|---|---|---|
| Windows | Pynzor.exe |
Pynzor.exe --help |
| macOS | Pynzor-macos |
chmod +x Pynzor-macos && ./Pynzor-macos --help |
| Linux | Pynzor-linux |
chmod +x Pynzor-linux && ./Pynzor-linux --help |
The binaries are self-contained: the default config, wordlists, and HTML report
template are bundled inside and resolved at runtime, so reports can be written to
any output directory you pass with -o. Each release build is smoke-tested
(--version, --help, headers --help) on its native runner in CI.
Platform notes:
-
macOS — binaries are unsigned. If Gatekeeper blocks the binary, allow it from System Settings or clear the quarantine attribute:
xattr -d com.apple.quarantine ./Pynzor-macos
Built on Apple Silicon runners (
arm64); run under Rosetta on Intel Macs if needed. -
Linux — built on
ubuntu-latestagainst that image's glibc; very old distros may not be compatible. Preferpipx install Pynzorthere. -
Windows — TLS uses the bundled
certifiCA store, so HTTPS targets work without a system Python. -
UPX — the spec enables UPX compression; if a corporate AV flags the binary, rebuild with
upx=FalseinPynzor.spec.
Development
uv sync
uv run pytest
uv run Pynzor --help
The project targets Python 3.10+ and keeps dependencies intentionally small.
The dashboard is built on Textual, which is
pure Python and shares the rich renderer the CLI already uses.
Release history is tracked in CHANGELOG.md, and the maintainer release process is documented in RELEASING.md.
Safety
Pynzor is for authorized testing only. Use it only on systems you own, CTF/lab targets you are allowed to test, or environments where you have explicit written permission. Unauthorized scanning or probing can be illegal and harmful.
Pynzor performs detection-oriented probes and recon. It does not include destructive payloads, exploit chains, credential dumping, persistence, or data exfiltration features.
License
MIT License. See LICENSE.md.
1 maintainer

Metadata
1 maintainer
Release files for Pynzor 1.2.0
For a detailed explanation of source distributions (sdists) and built distributions (wheels), please see the package formats documentation.
Source distribution (sdist)
| File | Size | Uploaded | |
|---|---|---|---|
| pynzor-1.2.0.tar.gz | 103.3 kB | Details |
Built distribution (wheel)
| File | Interpreter | ABI | Platform | Reset |
|---|---|---|---|---|
| pynzor-1.2.0-py3-none-any.whl | Python 3 | none | any | Details |
Total release size: 214.6 kB
Release files / pynzor-1.2.0.tar.gz
| Download URL | pynzor-1.2.0.tar.gz |
|---|---|
| Size | 103.3 kB |
| Tags | Source |
|
SHA-256 checksum How to use checksums |
e3726fea95ca7047a3d9ed079d67180582cc62b50cf5a357bcae0e90fb8f46b2
|
|
BLAKE2b-256 checksum How to use checksums |
3703c44eae23fe1fd6e2f4bf3f62a50f7ee1b2798d63912b94e0d22f8bd401ce
|
| Upload date | |
|
Uploaded using Trusted Publishing? What is trusted publishing? |
Yes |
| Uploaded via |
twine/7.0.0 CPython/3.13.14
|
Provenance
Provenance describes where a file came from. On PyPI, provenance is shared via attestations, which provide a verifiable record of the build or publishing details. View details, limitations and caveats.


PyPI Publish Attestation
PyPI verified that this artifact, at this checksum, originated from the publisher listed below.
Signed by GitHub Actions, verified by PyPI on Sep 12, 2026.
Transparency logRelease files / pynzor-1.2.0-py3-none-any.whl
| Download URL | pynzor-1.2.0-py3-none-any.whl |
|---|---|
| Size | 111.2 kB |
| Tags | Python 3 |
|
SHA-256 checksum How to use checksums |
04e997e0070036c307f47e270a13691512f9c3ef76d131aee83e2285fd8335ce
|
|
BLAKE2b-256 checksum How to use checksums |
a429afc32450bdb00e33868f35a94d5f0ea370b05ed13d623196fcbcfa56b529
|
| Upload date | |
|
Uploaded using Trusted Publishing? What is trusted publishing? |
Yes |
| Uploaded via |
twine/7.0.0 CPython/3.13.14
|
Provenance
Provenance describes where a file came from. On PyPI, provenance is shared via attestations, which provide a verifiable record of the build or publishing details. View details, limitations and caveats.
PyPI Publish Attestation
PyPI verified that this artifact, at this checksum, originated from the publisher listed below.
Signed by GitHub Actions, verified by PyPI on Sep 12, 2026.
Transparency log













