
QBMP - Quoins, Bricks, Mortar & Pointing
- Declarative synthetic dataset generation through mathematical modelling.
- Declare a model - inputs with ranges or categories, outputs with rule functions, and the weights that bind them - and QBMP fills every output's declared range with no gaps, then publishes a datasheet certifying exactly how well it did.
- Check out the example code in repo ( https://github.com/Palani-SN/QBMP ) for reference.
Installation
- Requires Python 3.11+.
pandasandopenpyxlare installed with it -openpyxlis what writesformat="xlsx". - use pip command to install the library, refer pypi page : https://pypi.org/project/QBMP/
python -m pip install QBMP
Usage
- A model is a class that subclasses
QBMPand declares two things:Inputs(what varies) andOutputs(what gets computed), wired together by aweightsdict per output. Each output also names a rule method, decorated with@rule(...), that turns a row of input values into that output's value. - Sample code as shown below declares a two-output slice of a real-estate pricing model (refer Demo.py under EXAMPLES/ for the full seven-output version).
from typing import ClassVar
from QBMP.engine import QBMP, rule


class Real_Estate_Pricing_Model(QBMP):
    model: ClassVar[dict] = {
        "Outputs": {
            "price_lakhs": {
                # weights order the inputs quoins -> bricks -> mortar
                "weights": {
                    "area_sqft": 100,
                    "property_type": 55,
                    "distance_km": 43,
                    "age_years": 20,
                    "floor": 12,
                    "bedrooms": 4,
                },
                "range": (7, 418),
                "engine": "populate_price_lakhs",
            },
            "price_band": {
                # a COMBINATIONAL output - categories, not a range. The weights
                # dict is the dependency edge list, so it names every input the
                # engine below takes - an engine is only ever handed the inputs
                # its own weights declare.
                "weights": {
                    "area_sqft": 100,
                    "property_type": 55,
                    "distance_km": 43,
                    "age_years": 20,
                    "floor": 12,
                    "bedrooms": 4,
                },
                "categories": ["Budget", "Mid", "Premium", "Luxury"],
                "engine": "populate_price_band",
            },
        },
        "Inputs": {
            "area_sqft": {"range": (500, 3500), "default": 1500},
            "property_type": {
                "categories": ["Studio", "Apartment", "Rowhouse", "Villa"],
                "default": "Apartment",
            },
            "bedrooms": {"range": (1, 5), "default": 2},
            "age_years": {"range": (0, 50), "default": 10},
            "distance_km": {"range": (1, 30), "default": 10},
            "floor": {"range": (0, 20), "default": 3},
        },
    }

    # What each build type does to the headline rate. Without it nothing
    # separates a Studio from a Villa, and the top of the declared range
    # becomes unreachable.
    RATE_BY_TYPE: ClassVar[dict] = {
        "Studio": 0.90,
        "Apartment": 1.00,
        "Rowhouse": 1.10,
        "Villa": 1.25,
    }

    @rule("price_lakhs")
    def populate_price_lakhs(
        self, area_sqft, bedrooms, age_years, distance_km, floor, property_type
    ):
        rate = 8000 - 150 * distance_km - 40 * age_years + 60 * floor + 100 * bedrooms
        rate *= self.RATE_BY_TYPE[property_type]
        return round(rate * area_sqft / 1e5, 2)

    @rule("price_band")
    def populate_price_band(
        self, area_sqft, bedrooms, age_years, distance_km, floor, property_type
    ):
        price = self.populate_price_lakhs(
            area_sqft=area_sqft,
            bedrooms=bedrooms,
            age_years=age_years,
            distance_km=distance_km,
            floor=floor,
            property_type=property_type,
        )
        return (
            "Budget"
            if price < 80
            else "Mid"
            if price < 180
            else "Premium"
            if price < 300
            else "Luxury"
        )


if __name__ == "__main__":
    data_set = Real_Estate_Pricing_Model(seed=24)
    data_set.save(
        min_rows=1000,
        dataset="prices",
        format="csv",
        max_bins=4096,
        outputs=["price_lakhs", "price_band"],
    )
save()is the single entrypoint: it generates rows, qualifies them, checks coherence, and publishes a folder named for the dataset.
prices/
    index.html      the datasheet - self-contained, drag-to-zoom
    prices.csv      the dataset
- Console output on a run looks like this - a preview of the rows, the coverage report per output, and where the folder landed:

- And the published datasheet (
index.html) looks like this:
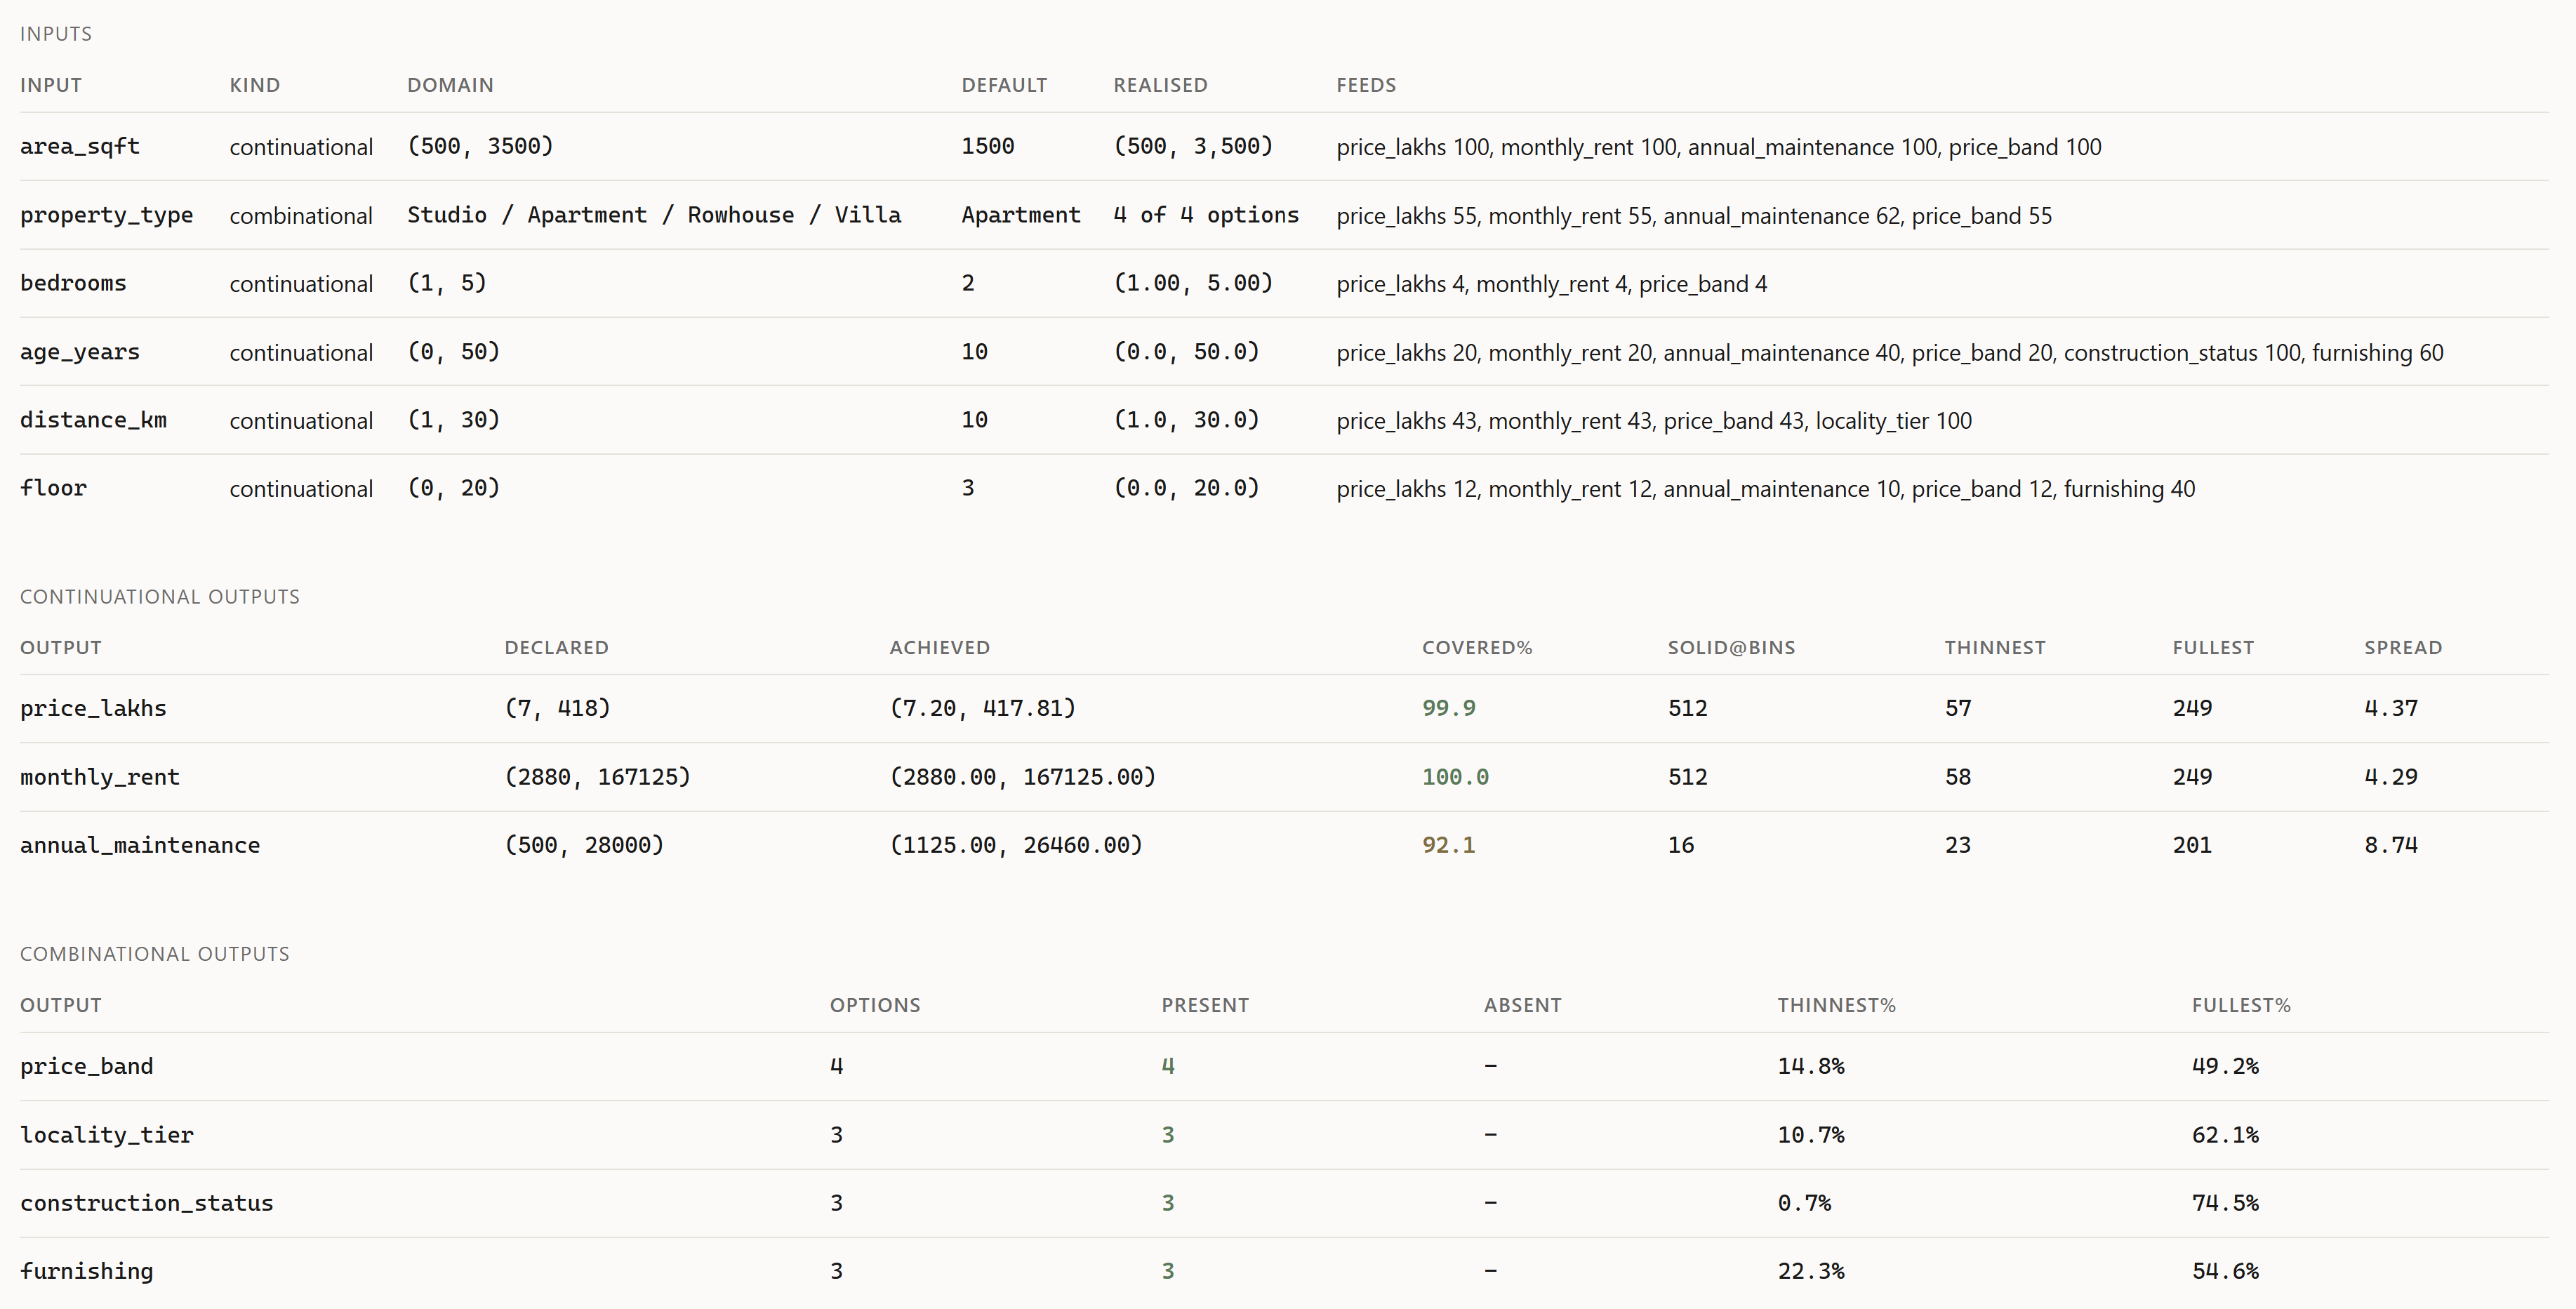
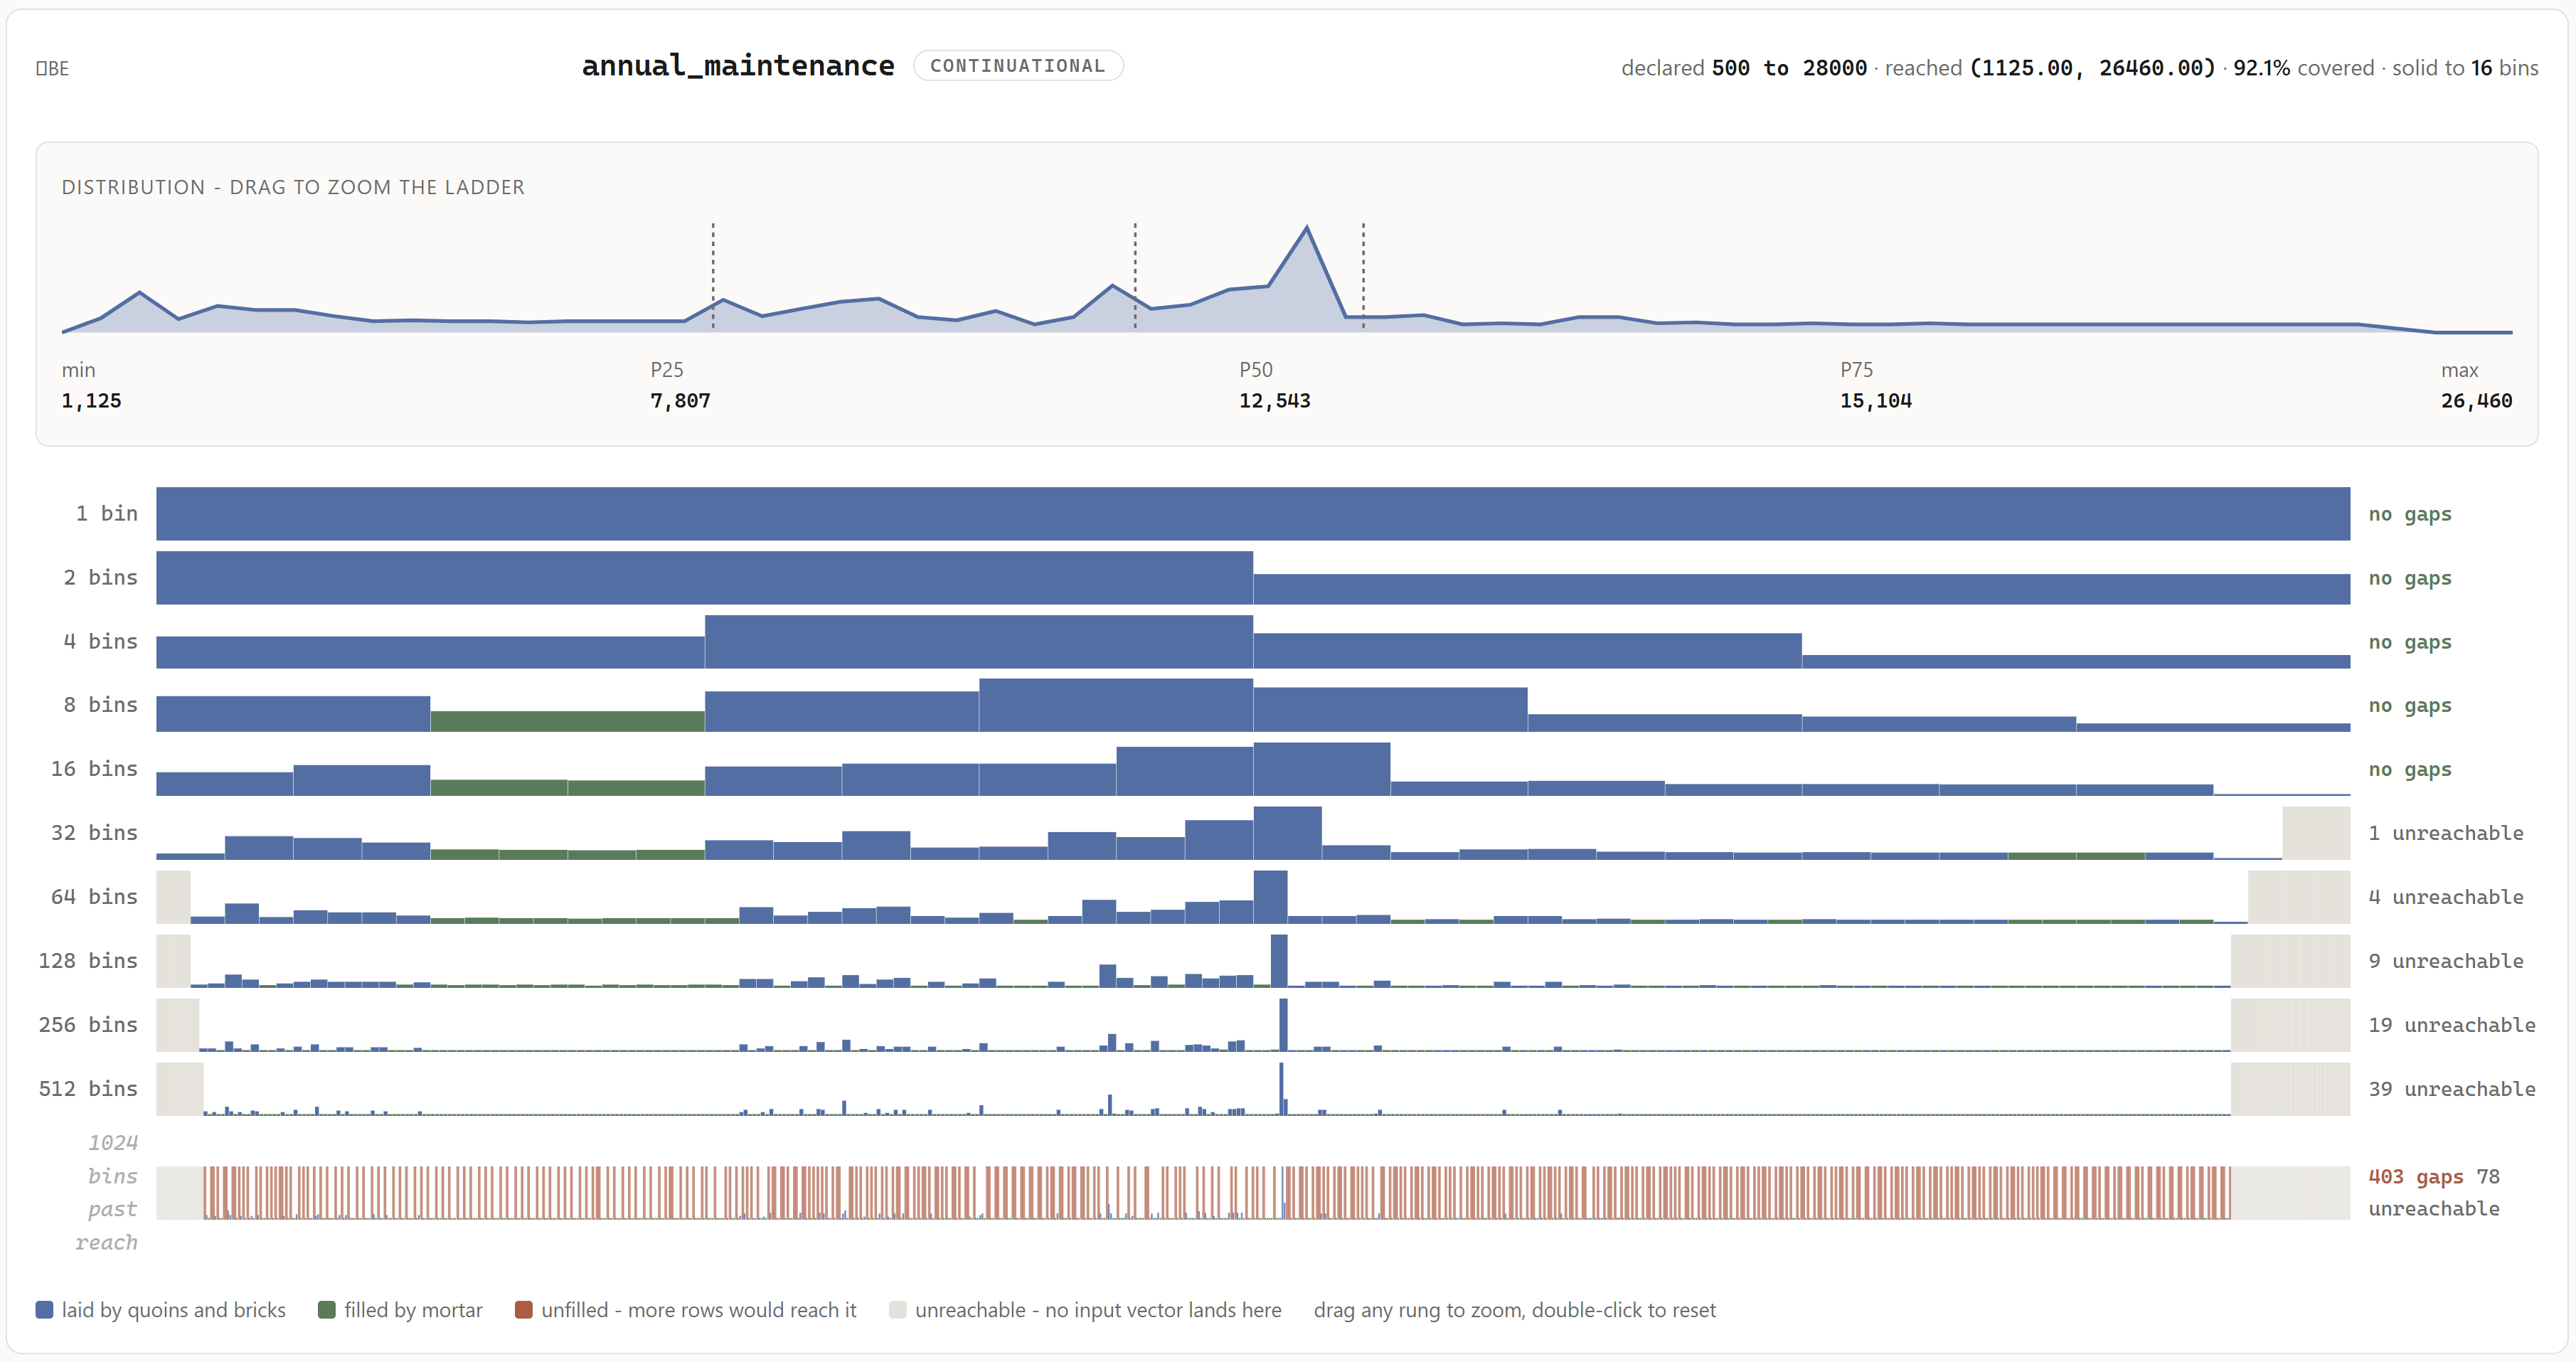
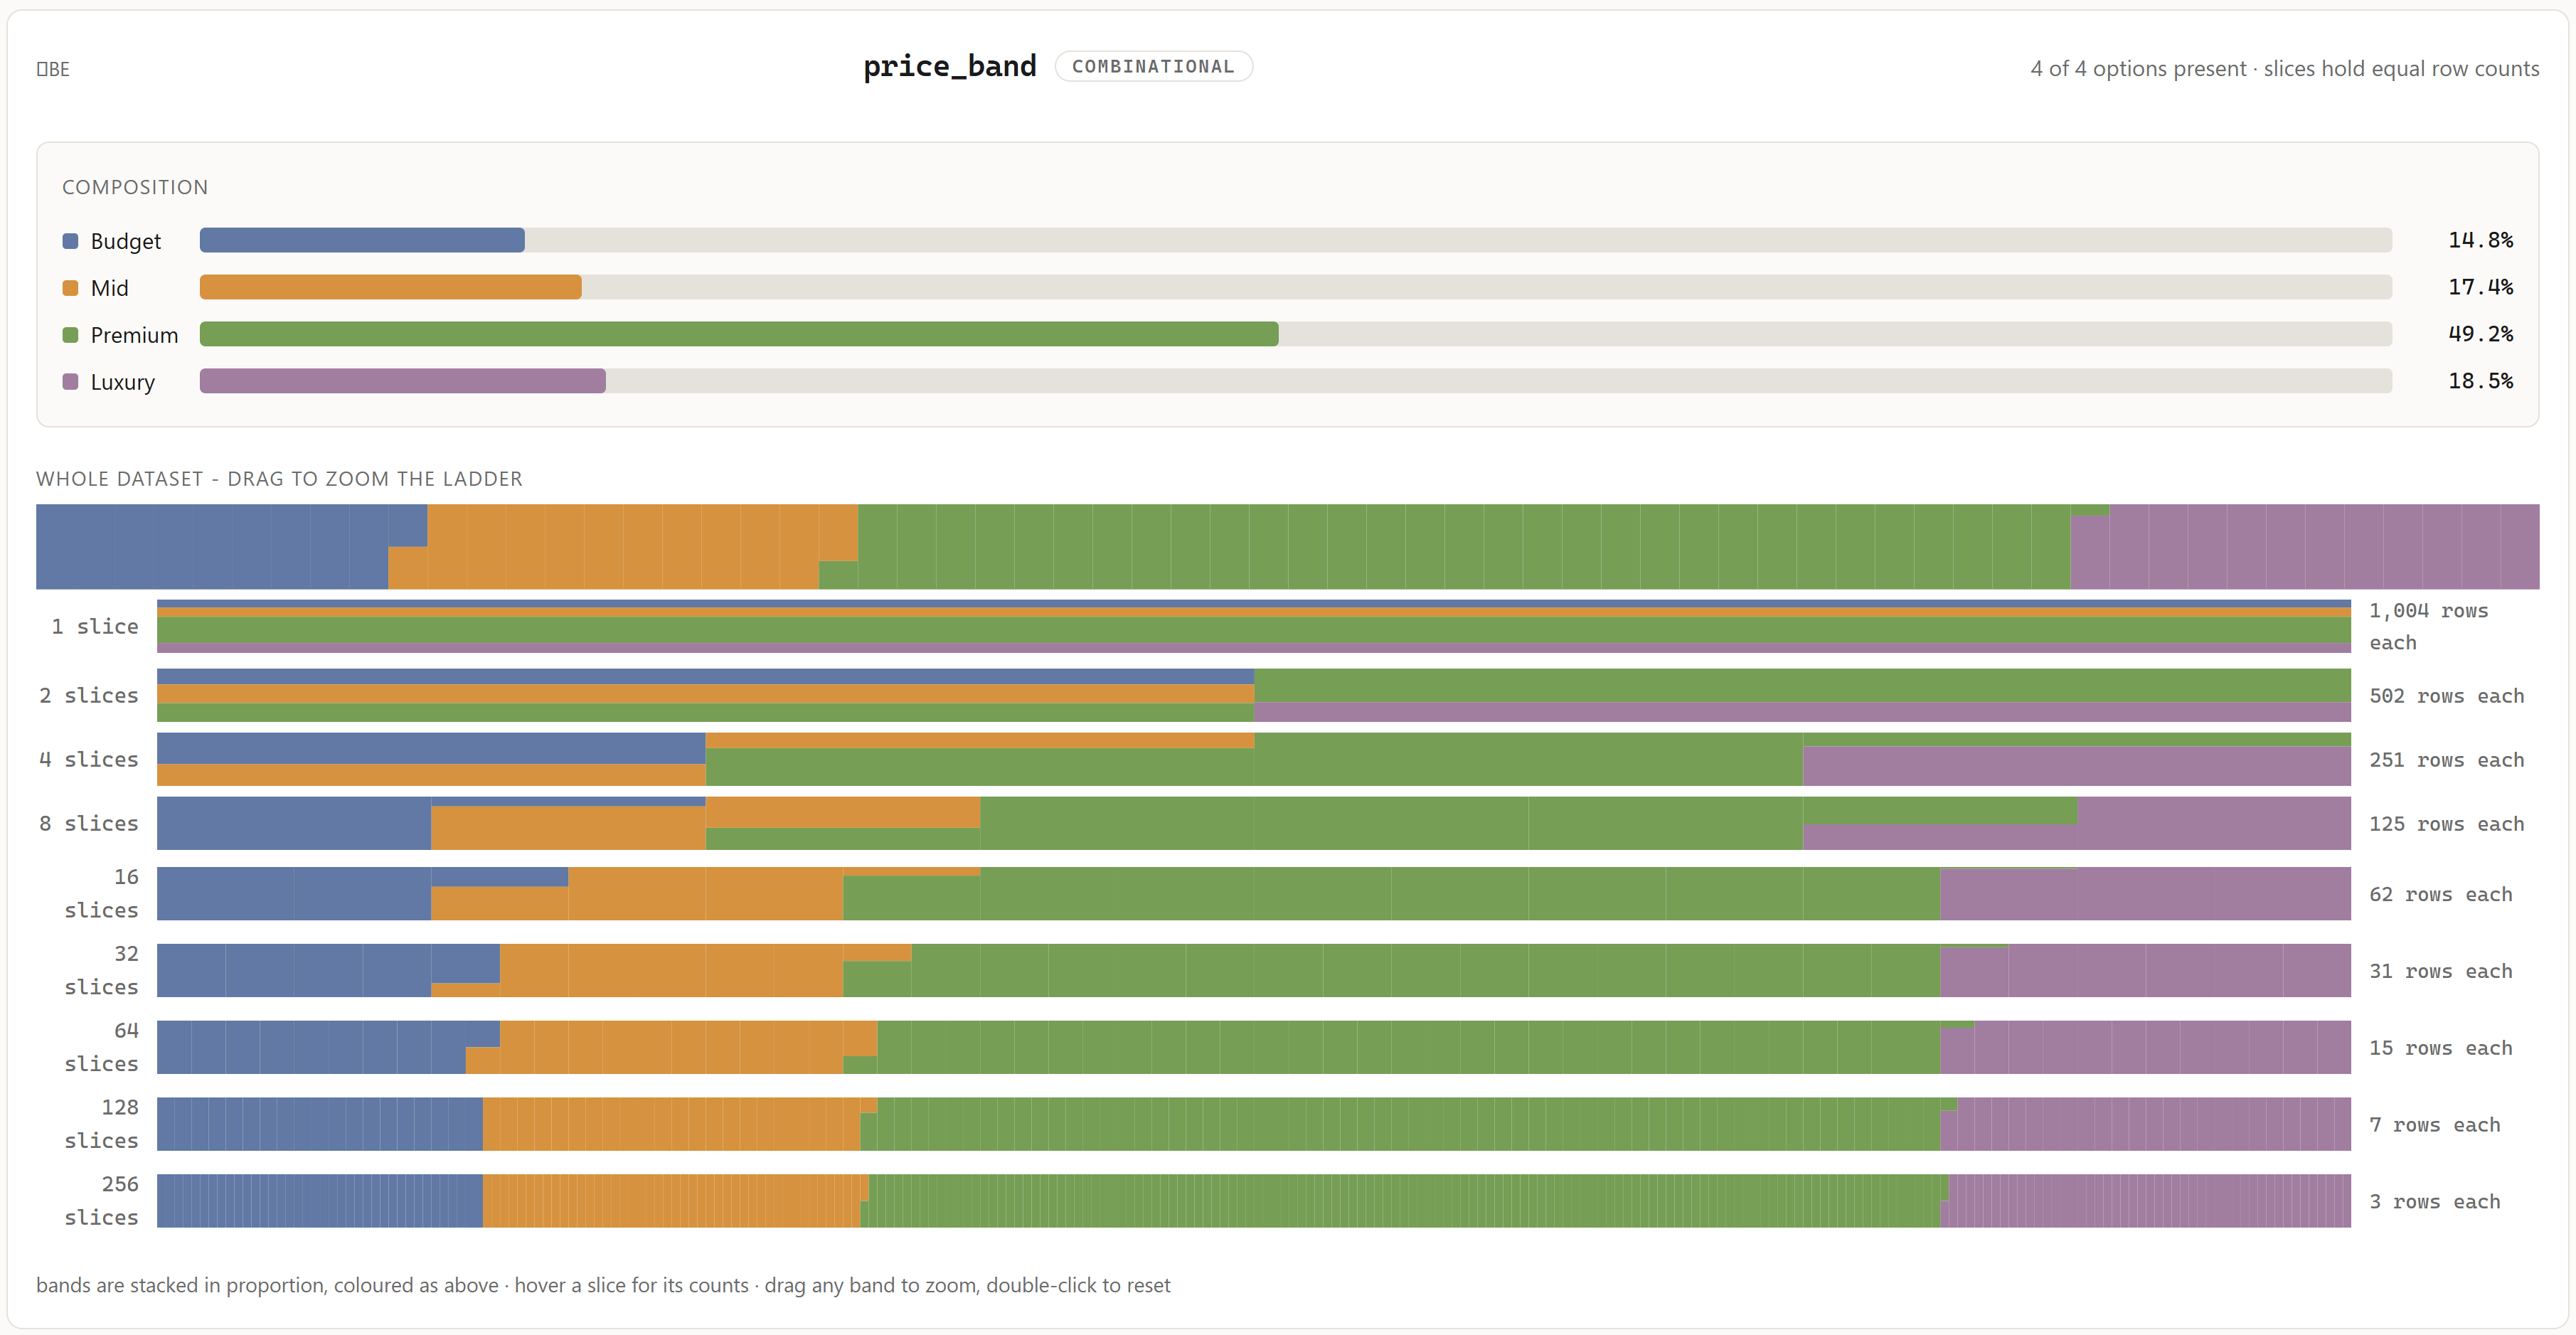
outputstakes a name, a list, orNonefor every output declared in the model.formatis"csv"or"xlsx"-openpyxlships as a dependency, so both work out of the box.min_rowsis a floor, not an exact count, andmax_binsis the resolution mortar aims for - capped atQBMP.MAX_BINS(2048), and capped again by how many rows there are, since filling N bins needs at least N rows. The run above asks for 4096 and is told, on the console and on the datasheet, exactly what it got instead.
Design
In masonry, quoins, bricks and mortar are laid in that order. Quoins are the large dressed cornerstones set first - few in number, widely spaced, fixing the geometry of the whole wall. Bricks fill the field between them. Mortar closes whatever gap is left, at the finest grain of all. Pointing then goes back over the joints and finesses them.
That is exactly what filling an output's range needs, and the courses map onto three passes plus a fourth on the roadmap:

An input's weight decides which course it belongs to: heavy inputs (most leverage on the output) place the landmarks, light inputs perturb the value just enough to fill gaps. Quoins and bricks are blind - they subdivide on a schedule without checking where the gaps are. Mortar is targeted - it bins the output, finds the empty bins, and solves a row into each one specifically.
Every input and output is exactly one of two kinds:
| Continuational | Combinational | |
|---|---|---|
| declared with | "range": (min, max) |
"categories": [...] |
| values are | swept and solved | enumerated |
| coverage means | the span is spanned, no gaps | every declared option appears |
A combinational output can never drive the sampling hierarchy - there is no span to place landmarks across - so it just rides the rows the continuational outputs produce.
Principles
- Coverage is chosen over uniformity. These genuinely compete; QBMP optimises for reaching every corner of the declared range rather than for a flat histogram. Rebalancing toward uniformity is future work ("pointing").
- The coherence invariant. A row is only ever produced by choosing inputs and running the rule engines - output values are never written, interpolated, or carried across passes. Every
save()re-derives each output from its own row and reports the worst disagreement (0.0when everything checks out). - Declared ranges are not silently corrected. If a model's declared range is wider than it can actually produce, the unreachable bins are reported and greyed on the datasheet rather than hidden - a declaration exceeding reality is worth seeing.
min_rowsis a floor, not a target. Row totals are products of per-pass counts, so the sampler lands on the closest reachable count at or above what was asked, not on the exact number.- The datasheet is self-contained. Inline CSS, SVG and script, no network requests - it opens from a
file://path on any machine, with drag-to-zoom on every ladder.
API at a glance
@rule(output_name) |
decorator binding a method as an output's rule engine; completes its kwargs from declared defaults |
QBMP(seed) |
binds every engine and validates that wiring - an engine that is missing, or not decorated with @rule for its own output, raises here rather than mid-run |
save(min_rows, dataset, format, outputs, max_bins, ...) |
the single entrypoint: generate, qualify, check coherence, publish a folder - returns the DataFrame, with self.report / self.mix / self.drift left on the instance |
License
GPL-3.0-or-later. See LICENSE.txt.
1 maintainer

Metadata
1 maintainer
Release files for QBMP 0.0.2
For a detailed explanation of source distributions (sdists) and built distributions (wheels), please see the package formats documentation.
Source distribution (sdist)
| File | Size | Uploaded | |
|---|---|---|---|
| qbmp-0.0.2.tar.gz | 42.9 kB | Details |
Release files / qbmp-0.0.2.tar.gz
| Download URL | qbmp-0.0.2.tar.gz |
|---|---|
| Size | 42.9 kB |
| Tags | Source |
|
SHA-256 checksum How to use checksums |
dcefebcc2c34eab2267ed70b85625b341dbfa630300b6ae384bc7cf1eb195350
|
|
BLAKE2b-256 checksum How to use checksums |
d8a7f14790c63a4a9ff32d87eb70fce682fa9fc60a39816a100cfb4bcbbdb377
|
| Upload date | |
|
Uploaded using Trusted Publishing? What is trusted publishing? |
No |
| Uploaded via |
twine/3.4.2 importlib_metadata/9.0.1 pkginfo/1.13 requests/2.34.2 requests-toolbelt/1.0.0 tqdm/4.70.0 CPython/3.14.7
|














