Bayesian changepoint detection and time series decomposition

Project description
Rbeast: A Python package for Bayesian changepoint detection and time series decomposition
BEAST (Bayesian Estimator of Abrupt change, Seasonality, and Trend) is a fast, generic Bayesian model averaging algorithm to decompose time series or 1D sequential data into individual components, such as abrupt changes, trends, and periodic/seasonal variations, as described in Zhao et al. (2019). BEAST is useful for changepoint detection (e.g., breakpoints, structural breaks, regime shifts, or anomalies), trend analysis, time series decomposition (e.g., trend vs seasonality), time series segmentation, and interrupted time series analysis. See a list of selected studies using BEAST .
Quick Installation
BEAST was implemented in C/C++ but accessible from R, Python, Matlab, and Octave. Run the following to install:
- Python:
pip install Rbeast - Matlab:
eval(webread('http://b.link/rbeast',weboptions('cert',''))) - Octave:
eval(webread('http://b.link/rbeast')) - R lang:
install.packages("Rbeast")
Quick Usage
One-liner code for Python, Matlab and R. Check github.com/zhaokg/Rbeast for more details.
# Python example
import Rbeast as rb; (Nile, Year)=rb.load_example('nile'); o=rb.beast(Nile,season='none'); rb.plot(o)

# Matlab/Octave example
load('Nile'); o = beast(Nile, 'season','none'); plotbeast(o)

# R example
library(Rbeast); data(Nile); o = beast(Nile); plot(o)
Installation for Python
A package Rbeast has been deposited here at PyPI: https://pypi.org/project/Rbeast/. Install from a binary wheel using:
pip install Rbeast
Currently, binary wheel files were built for common OS platforms and CPU architectures (e.g., Linux, Windows, and macOS for both x86_64 and arm64 CPUs). If the pre-built wheel doesn't work on your computer, please try to install from the source:
pip install Rbeast --no-binary :none:
The installation from sources requires a C/C++ compiler (e.g., gcc, and clang) to build the binary package, which should be hassle-free on Linux ( with gcc) or Mac (with clang or xcode) and may be tricky on Windows systems. If needed, contact Kaiguang Zhao (zhao.1423@osu.edu) to help build the package for your specific OS platforms and Python versions.
Run and test Rbeast in Python
Import the Rbeast package as rb:
import Rbeast as rb
help(rb.load_example)
help(rb.beast)
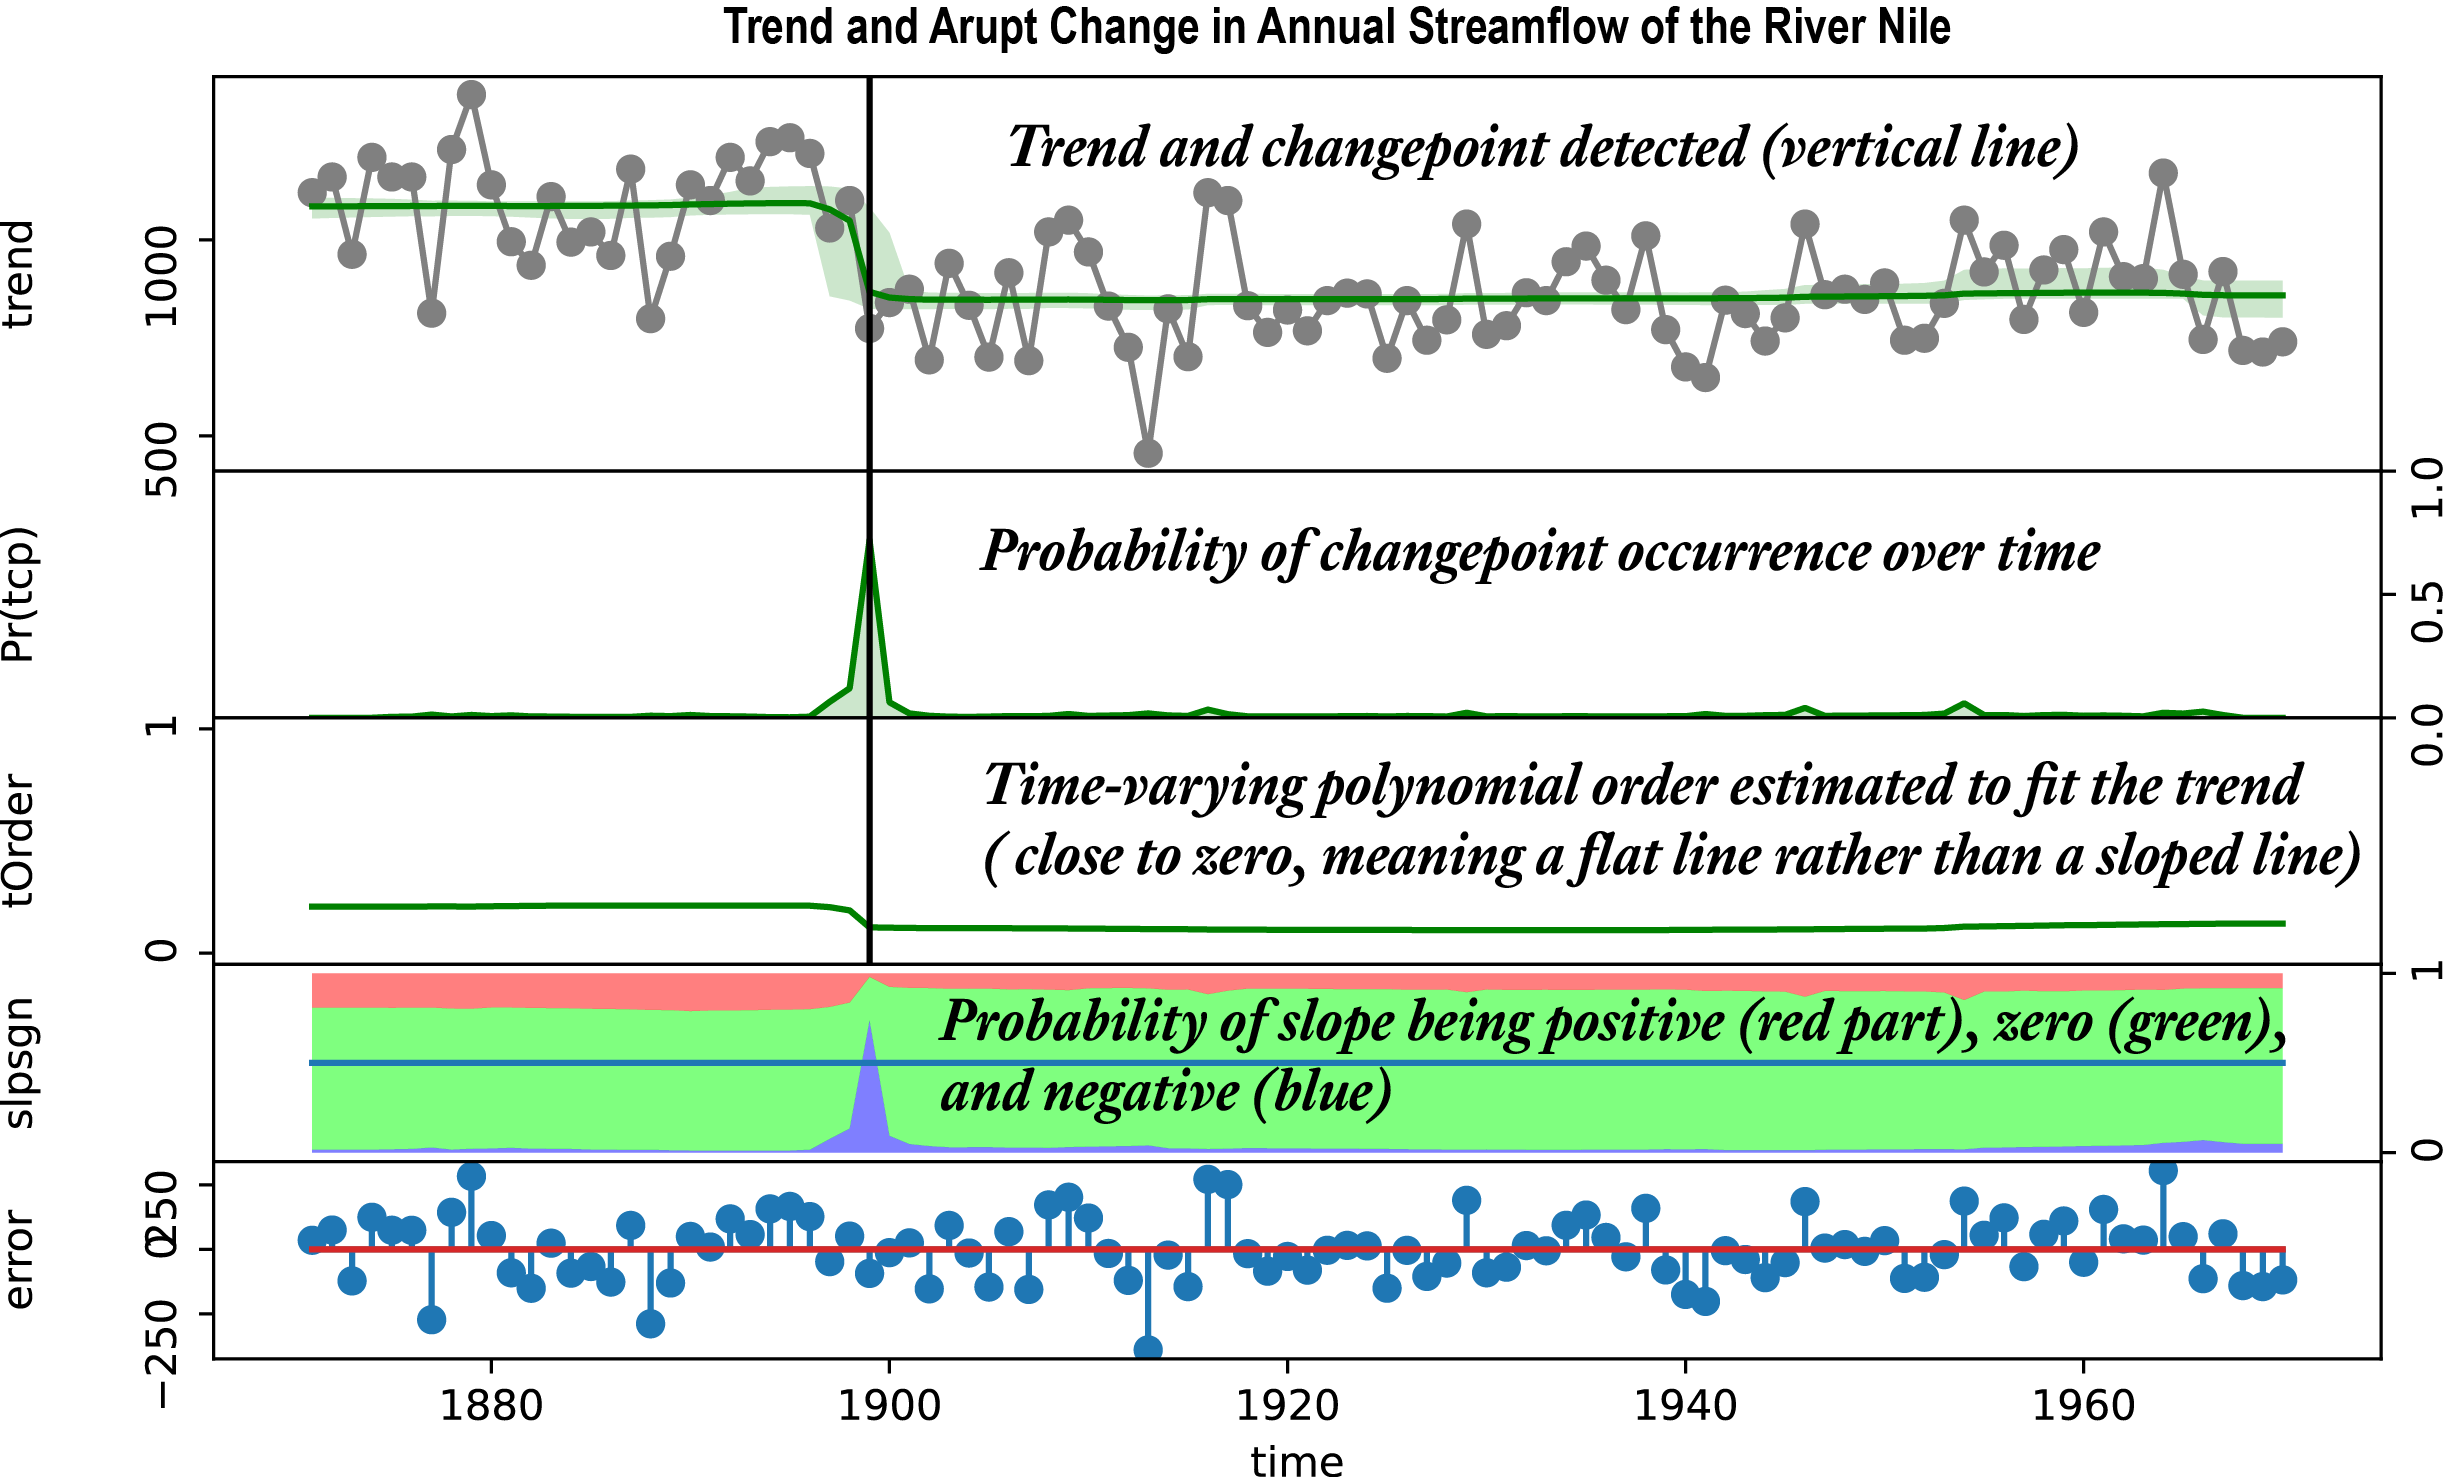
The first example is annual streamflow of the River Nile starting from Year 1871. As annual observations, it has no periodic component (i.e., season='none').
nile, year = rb.load_example('nile')                     # nile is a 1d Python array or numpy vector
o          = rb.beast( nile, start=1871, season='none')  # season='none' bcz the data has no seasonal/periodic component
rb.plot(o, title='Annual streamflow of the Nile River')
rb.print(o)

# Print a list of fields in the output variable (e.g, o.data, o.RMSE, o.trend.cp, o.time, and o.tend.cpOccPr)
# Check the R manual for expalanations of the output (https://cran.r-project.org/web/packages/Rbeast/Rbeast.pdf)
o                                                        # this is equivalent to "print(o)"
# A wrong way to call beast for nile: If the 'season' arg is missing, the default season='harmonic' is used such that
# there is a seasonal component to be fit. But the Nile data is a trend-only signal with no periodic component
o = rb.beast(nile, start=1871 )
rb.plot(o)      # the result is wrong. Use season='none' when calling beast for trend-only data
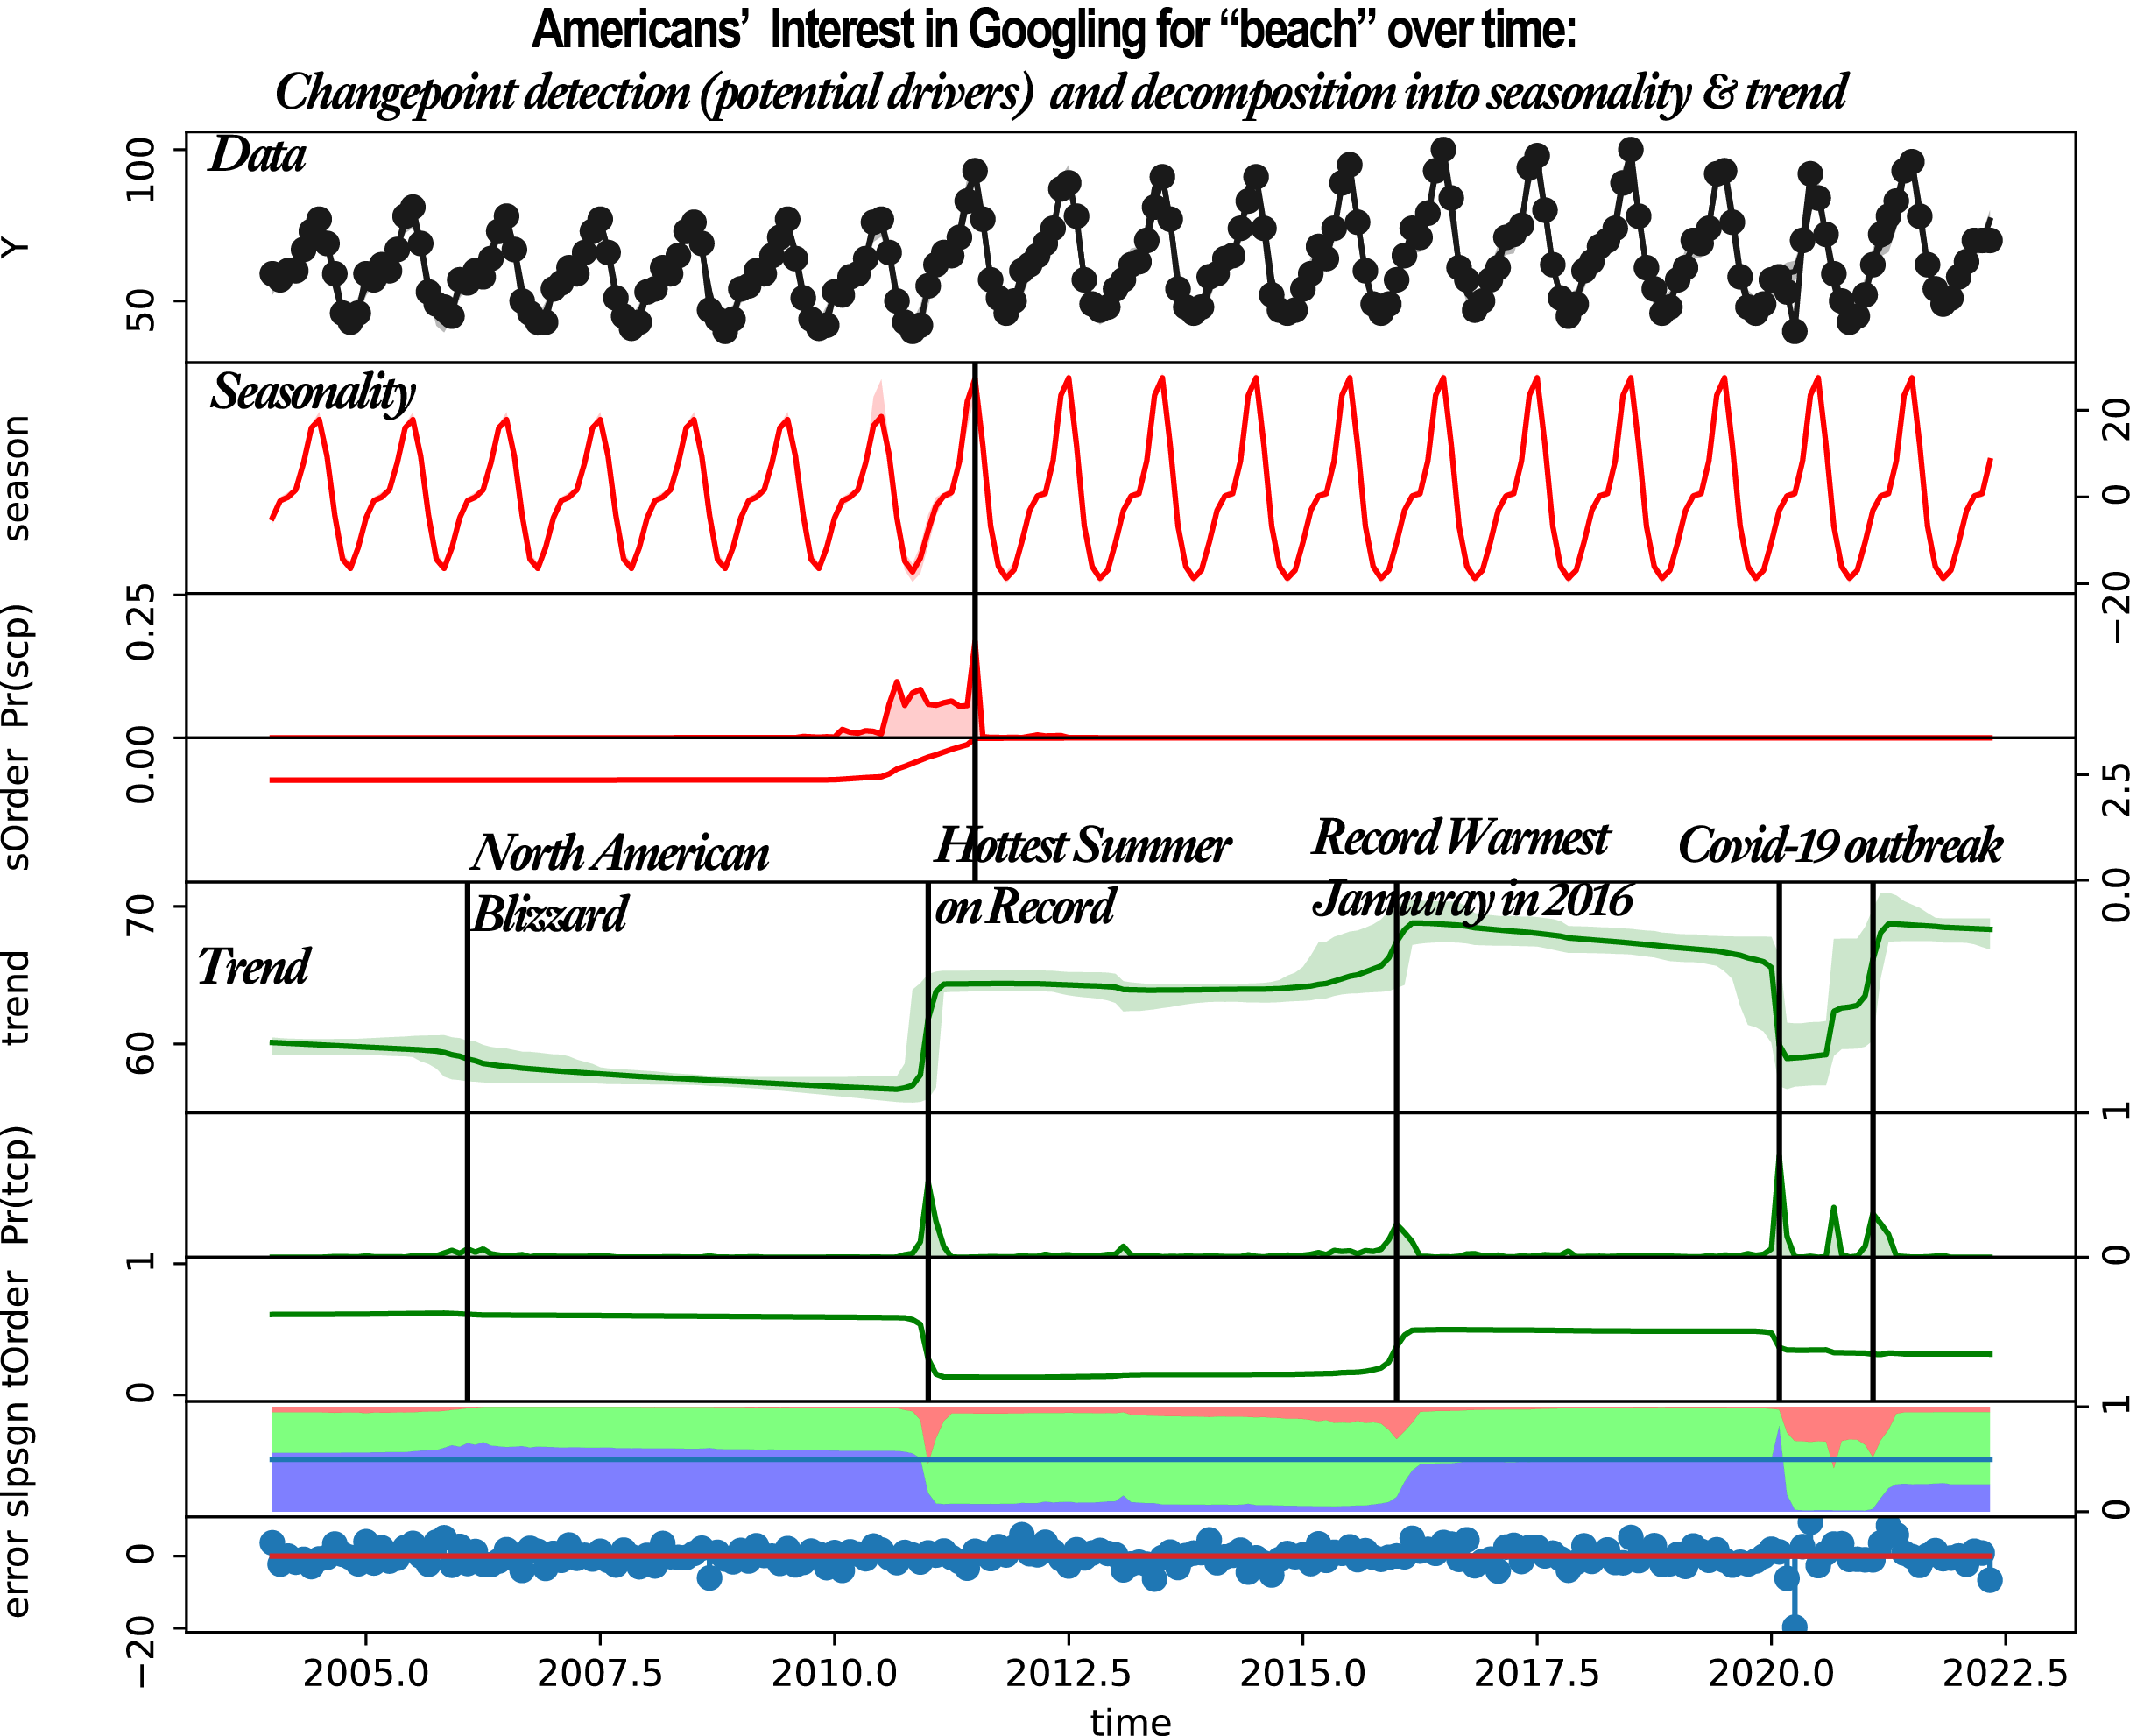
The second example is a monthly time series of the Google Search popularity of beach over the US. This time series is reguarly-spaced (i.e., deltat=1 month =1/12 year); it has a cyclyic component with a period of 1 year. That is, the number of data points per period is period / deltat = 1 year / 1 month = 1/(1/12) = 12.
beach, year = rb.load_example('googletrend')
o = rb.beast(beach, start= 2004, deltat=1/12, period = 1.0)       # the time unit is uknown or arbitrary
o = rb.beast(beach, start= 2004, deltat=1/12, period ='1.0 year') # the time unit is fractional year
rb.plot(o)
rb.print(o)
deltat (in this example, we choose deltat=1/12 year =1 month, but you may choose other intervals, depending on the needs).
ndvi3d, datestr,year = rb.load_example('imagestack')  # ndvi is a numpy array of shape (484,10,20); the 1st dim refers to the time

metadata                = rb.args() # create an empty object to stuff the attributes: "metadata  = lambda: None" also works
metadata.time           = year      # times of individulal images/data points: the unit here is fractional year (e.g., 2004.232)
metadata.deltaTime      = 1/12      # regular interval used to aggregate the irregular time series (1/12 = 1/12 year = 1 month)
metadata.period         = 1.0       # the period is 1.0 year, so freq= 1.0 /(1/12) = 12 data points per period
metadata.whichDimIsTime = 1         # the dimension of the input ndvi is (484,10,20): which dim refers to the time. whichDimIsTime is a 1-based index

o = rb.beast123(ndvi3d, metadata, [], [], []) # rb.beast123(data, metadata, prior, mcmc, extra): default values used if not supplied

rb.print(o[4, 6])                 # print the (5-th row, 7-th col) pixel: Python uses 0-based indices.
rb.plot(o[4, 6])                  # plot the (5-th row, 7-th col) pixel: Python uses 0-based indices.

figure, axes = rb.plot(o[4, 6])   # plot the (5-th row, 7-th col) pixel: Python uses 0-based indices.
rb.plot( o[4, 7], fig = figure)   # plot the (5-th row, 8-th col)pixel: Setting fig=figure will use the existing figure to plot
Below is another way to supply the time info:
ndvi3d, datestr,year = rb.load_example('imagestack')

metadata              = lambda: None # create an empty object to stuff the attributes: "metadata  = rb.args()" also works
metadata.time         = rb.args( )   # create an empty object to stuff the 'datestr' and 'strfmt' attributes
metadata.time.datestr = datestr      # datestr is a list of file names (e.g., s2_ndvi_2018-01-03.tif) that contain the date info
metadata.time.strfmt  = 'LT05_018032_20110726.yyyy-mm-dd'  # the format used to extract the year (YYYY), month (mm), and day (dd) from the strings
metadata.deltaTime    = 1/12        # regular interval used to aggregate the irregular time series (1/12 = 1/12 year = 1 month)
metadata.period       = 1.0         # the period is 1.0 year, so freq= 1.0 /(1/12) = 12 data points per period
metadata.whichDimIsTime = 1         # the dimension of the input ndvi is (484,10,20): which dim refers to the time. whichDimIsTime is a 1-based index

extra = rb.args(                             # a set of options to specify the outputs or computational configurations
               dumpInputData    = True,    # make a copy of the aggregated input data in the beast ouput
               numThreadsPerCPU = 2,       # Paralell  computing: use 2 threads per cpu core
               numParThreads    = 0        # `0` means using all CPU cores: total num of ParThreads = numThreadsPerCPU * core Num
              )
# Instead of using "extra=lambda:None;  extra.dumpInputData=True; ...", the above directly specifies the attribues in the object creation function

o = rb.beast123(ndvi3d, metadata, [], [], extra)  # rb.beast123(data, metadata, prior, mcmc, extra): default values used for prior and mcmc if missing
Description
Interpretation of time series data is affected by model choices. Different models can give different or even contradicting estimates of patterns, trends, and mechanisms for the same data—a limitation alleviated by the Bayesian estimator of abrupt change,seasonality, and trend (BEAST) of this package. BEAST seeks to improve time series decomposition by forgoing the "single-best-model" concept and embracing all competing models into the inference via a Bayesian model averaging scheme. It is a flexible tool to uncover abrupt changes (i.e., change-points), cyclic variations (e.g., seasonality), and nonlinear trends in time-series observations. BEAST not just tells when changes occur but also quantifies how likely the detected changes are true. It detects not just piecewise linear trends but also arbitrary nonlinear trends. BEAST is applicable to real-valued time series data of all kinds, be it for remote sensing, finance, public health, economics, climate sciences, ecology, and hydrology. Example applications include its use to identify regime shifts in ecological data, map forest disturbance and land degradation from satellite imagery, detect market trends in economic data, pinpoint anomaly and extreme events in climate data, and unravel system dynamics in biological data. Details on BEAST are reported in Zhao et al. (2019). The paper is available at https://go.osu.edu/beast2019.
Reference
-
Zhao, K., Wulder, M. A., Hu, T., Bright, R., Wu, Q., Qin, H., Li, Y., Toman, E., Mallick B., Zhang, X., & Brown, M. (2019). Detecting change-point, trend, and seasonality in satellite time series data to track abrupt changes and nonlinear dynamics: A Bayesian ensemble algorithm. Remote Sensing of Environment, 232, 111181. (the BEAST paper)
-
Zhao, K., Valle, D., Popescu, S., Zhang, X. and Mallick, B., 2013. Hyperspectral remote sensing of plant biochemistry using Bayesian model averaging with variable and band selection. Remote Sensing of Environment, 132, pp.102-119. (the mcmc sampler used for BEAST)
-
Hu, T., Toman, E.M., Chen, G., Shao, G., Zhou, Y., Li, Y., Zhao, K. and Feng, Y., 2021. Mapping fine-scale human disturbances in a working landscape with Landsat time series on Google Earth Engine. ISPRS Journal of Photogrammetry and Remote Sensing, 176, pp.250-261. (an application paper)
Reporting Bugs or getting help
BEAST is distributed as is and without warranty of suitability for application. The one distributed above is still a beta version, with potential room for further improvement. If you encounter flaws/bugs with the software, please report the issue. Providing a description of the conditions under which the bug occurred will help to identify the bug. You can directly email its maintainer Dr. Kaiguang Zhao at zhao.1423@osu.edu to report issues or request feature enhancements. Alternatively, use the Issues tracker on GitHub.
Selected publications using BEAST/Rbeast
Despite being published originally for ecological and enviornmental applications, BEAST is developed as a generic tool applicable to time series or time-series-like data arising from all disciplines. BEAST is not a heuristic algorithm but a rigorous statistical model. Below is a list of selected peer-reviewed pulications that used BEAST for statistical data analysis.
| Discipline | Publication Title |
|---|---|
| Remote Sensing | Li, J., Li, Z., Wu, H., and You, N., 2022. Trend, seasonality, and abrupt change detection method for land surface temperature time-series analysis: Evaluation and improvement. Remote Sensing of Environment, 10.1016/j.rse.2022.113222 |
| Archaeogenetics | Sikora, M., Canteri, E., Fernandez-Guerra, A., Oskolkov, N., Ågren, R., Hansson, L., Irving-Pease, E.K., Mühlemann, B., Holtsmark Nielsen, S., Scorrano, G. and Allentoft, M.E., 2025. The spatiotemporal distribution of human pathogens in ancient Eurasia. Nature, 643(8073), pp.1011-1019. |
| Energy | Jakhmola, A., Jewell, J., Vinichenko, V. et al.2026. Probabilistic projections of global wind and solar power growth based on historical national experience. Nature Energy. https://doi.org/10.1038/s41560-026-02021-w |
| Sustainability | Sun, X., Tian, L., Fang, H., Walling, D.E., Huang, L., Park, E., Li, D., Zheng, C. and Feng, L., 2025. Changes in global fluvial sediment concentrations and fluxes between 1985 and 2020. Nature Sustainability, 8(2), pp.142-151. |
| Paleoclimatology | Lu, F., Lu, H., Gu, Y., Lin, P., Lu, Z., Zhang, Q., Zhang, H., Yang, F., Dong, X., Yi, S. and Chen, D., 2025. Tipping point-induced abrupt shifts in East Asian hydroclimate since the Last Glacial Maximum. Nature Communications, 16(1), p.477. |
| Biogeochemistry | Sun, X., Tian, L., Fang, H., Walling, D.E., Syvitski, J., Huang, L., Li, D., Zheng, C. and Feng, L., 2026. Mapping pan-Arctic riverine particulate organic carbon from space (1985 to 2022). Science Advances, 12(3), p.eady6314. |
| Global Ecology | Guo, R., Wu, X., Wang, P., Chen, T., Chen, X., Cai, J., Wang, X., Zhang, Z., Meng, Z. and Liu, Y., 2026. Increased spread of global flash droughts threatens vegetation productivity resilience. Nature Communications. |
| Paleoceanography | Rahaman, W., Gutjahr, M. and Prabhat, P., 2025. Late Pliocene growth of the West Antarctic Ice Sheet to near-modern configuration. Nature Communications, 16(1), p.6705. |
| Zoology | Meireles, J.P., Hahn-Klimroth, M., Lackey, L.B., van Eeuwijk, N., Bertelsen, M.F., Dressen, S., Dierkes, P.W., Abraham, A.J. and Clauss, M., 2026. Aging populations threaten conservation goals of zoos. Proceedings of the National Academy of Sciences, 123(5), p.e2522274123. |
| Medicial sciences | Garcia-Aymerich, J., de Las Heras, M., Carsin, A.E., Accordini, S., Agustí, A., Bui, D., Dharmage, S.C., Dodd, J.W., Eze, I., Gehring, U. and Gislason, T., 2025. General population-based lung function trajectories over the life course: an accelerated cohort study. The Lancet Respiratory Medicine, 13(7), pp.611-622. |
| Climate Change | Leclercq, L., Oelsmann, J., Cazenave, A., Passaro, M., Jevrejeva, S., Connors, S., Legeais, J.F., Birol, F. and Abarca-del-Rio, R., 2026. Abrupt trend change in global mean sea level and its components in the early 2010s. Communications Earth & Environment. |
| Communication | Phillips, J.B., 2025. Exploring psyop-based conspiracy theories on social media. Information, Communication & Society, pp.1-20. |
| Applied Math | Koutrouli, E., Manousopoulos, P., Theal, J. and Tresso, L., 2025. Crypto asset markets vs. financial markets: Event identification, latest insights and analyses. AppliedMath, 5(2), p.36. |
| Biosystems Engineering | Mayrhuber, E., Maschat, K., Brunner, D., Winkler, S.M. and Oczak, M., 2026. Improved and interpretable accelerometer-based farrowing prediction. Biosystems Engineering, 263, p.104381. |
| Finance | Li, S., Mishra, T. and Yarovaya, L., 2026. Heterogeneous Market Efficiency in Cryptocurrency Markets: A Multi‐Frequency Memory‐Based Approach. International Journal of Finance & Economics. |
| Economics | Lakštutienė, A., Sutiene, K., Kabasinskas, A., Malakauskas, A. and Kopa, M., 2025. Sustaining in Uncertain Time: Investigating Pension Fund Performance during Market Stress. Engineering Economics, 36(1), pp.96-112. |
| Reliability Engineering | Zhou, Y., Liu, S., Kou, G. and Kang, F., 2025. Degradation variation pattern mining based on BEAST time series decomposition integrated functional principal component analysis. Reliability Engineering & System Safety, 259, p.110952. |
| Biology | Bancaud, A., Nakajima, T., Suehiro, J.I., Alric, B., Morfoisse, F., Cacheux, J. and Matsunaga, Y.T., 2025. Intraluminal pressure triggers a rapid and persistent reinforcement of endothelial barriers. Lab on a Chip, 25(8), pp.2061-2072. |
| Construction Engineering | Li, F., Xie, Z., Yu, X. and Shi, B., 2025. Estimation of long-term variation patterns in the modal properties of a skyscraper under environmental effects. Engineering Structures, 336, p.120451. |
| Animal Ecology | Hole, G.M., Büntgen, U., Wang, Y., DeVries, B., Rees, G. and Wheeler, H.C., 2026. Dendrochronology and remote sensing reveal beaver occupancy and colonization dynamics in an expanding Arctic population. Ecosphere, 17(3), p.e70557. |
| Wildlife | Pérez-Mellado, V. and Pérez-Cembranos, A., 2025. Effects of the introduction of an herbivore on an endangered lizard. European Journal of Wildlife Research, 71(3), p.47. |
| Coastal & Estuary science | Richey, A., Oberbauer, S.F., Castaneda-Moya, E., Troxler, T., Kominoski, J.S., Olivas, P. and Malone, S.L., 2025. Sea-level rise and freshwater management are reshaping coastal landscapes. Journal of Environmental Management, 387, p.125842. |
| Civil Engineering | Englezou, Y., Timotheou, S. and Panayiotou, C.G., 2025. Fault-adaptive traffic demand estimation using network flow dynamics. IEEE Transactions on Intelligent Transportation Systems. |
| Computational Chemistry | Faran, M. and Bisker, G., 2025. Coarse-graining self-assembly by the stochastic landscape method. Journal of Chemical Theory and Computation, 21(21), pp.10719-10734. |
| Education | Huang, X., Wu, H., Liu, X. and Lajoie, S.P., 2025, July. What makes teamwork work? A multimodal case study on emotions and diagnostic expertise in an intelligent tutoring system. In International Conference on Artificial Intelligence in Education (pp. 44-52). Cham: Springer Nature Switzerland. |
| Agrometerology | Ssembajwe, R., Mulinde, C., Ddumba, S.D., Kagezi, G.H., Opio, R., Kobusinge, J., Mugagga, F., Bamutaze, Y., Gidudu, A., Arinaitwe, G. and Voda, M., 2025. Dynamics and associations of selected agrometeorological variables in Robusta growing regions of Uganda. Agricultural Water Management, 307, p.109257. |
| Health Care | Ünal, E. and Yılmaz, S., 2025, March. Healthcare Sector Dynamics in Turkey (2002–2022): Trends, Breakpoints, and Policy Implications (Privatization in the Hospital Sector). In Healthcare (Vol. 13, No. 6, p. 622). MDPI. |
| Rock Engineering | Long, S., Yue, Z., Yue, W.V., Hu, H., Feng, Y., Yan, Y. and Xie, X., 2025. Identification of rock layer interface characteristics using drilling parameters. Rock Mechanics and Rock Engineering, 58(1), pp.1071-1098. |
| Energy | Leiria, D., Johra, H., Anoruo, J., Praulins, I., Piscitelli, M.S., Capozzoli, A., Marszal-Pomianowska, A. and Pomianowski, M.Z., 2025. Is it returning too hot? Time series segmentation and feature clustering of end-user substation faults in district heating systems. Applied Energy, 381, p.125122. |
| Psychology | Huang, X., Nguyen, A. and Lajoie, S.P., 2025. Examining socially shared regulation of learning in medical training: the interplay of heart rate change points on regulatory interactions: Huang et al. European Journal of Psychology of Education, 40(3), p.93. |
| Paleoclimatology | Anastasia Zhuravleva et al., 2023. Caribbean salinity anomalies contributed to variable North Atlantic circulation and climate during the Common Era. Science Advances, DOI:10.1126/sciadv.adg2639 |
| Population Ecology | Henderson, P. A. (2021). Southwood's Ecological Methods (5th edition). Oxford University Press., page 475-476 |
| Climatology | Webster, M.A., Riihelä, A., Kacimi, S., Ballinger, T.J., Blanchard-Wrigglesworth, E., Parker, C.L. and Boisvert, L., 2024. Summer snow on Arctic sea ice modulated by the Arctic Oscillation. Nature Geoscience, pp.1-8. |
| Cardiology | Ozier, D., Rafiq, T., de Souza, R. and Singh, S.M., 2023. Use of Sacubitril/Valsartan Prior to Primary Prevention Implantable Cardioverter Defibrillator Implantation. CJC Open. |
| Spatial Ecology | Laurin, G.V., Cotrina-Sanchez, A., Belelli-Marchesini, L., Tomelleri, E., Battipaglia, G., Cocozza, C., Niccoli, F., Kabala, J.P., Gianelle, D., Vescovo, L. and Da Ros, L., 2024. Comparing ground below-canopy and satellite spectral data for an improved and integrated forest phenology monitoring system. Ecological Indicators, 158, p.111328. |
| Anthropocene Science | Thomas, E.R., Vladimirova, D.O., Tetzner, D.R., Emanuelsson, D.B., Humby, J., Turner, S.D., Rose, N.L., Roberts, S.L., Gaca, P. and Cundy, A.B., 2023. The Palmer ice core as a candidate Global boundary Stratotype Section and Point for the Anthropocene series. The Anthropocene Review, p.20530196231155191. |
| Biomedical Engineering | Saghbiny, E., Da Silva, J., Leblanc, L., Bobbio, C., Morel, G.G., Vialle, R. and Tamadazte, B., 2023, September. Breach detection in spine surgery based on cutting torque with ex-vivo experimental validation. In Conference on New Technologies for Computer and Robot Assisted Surgery. |
| Political Science | Reuning, K., Whitesell, A. and Hannah, A.L., 2022. Facebook algorithm changes may have amplified local republican parties. Research & Politics, 9(2), p.20531680221103809. |
| Food Science | Zaytsev, V., Tutukina, M.N., Chetyrkina, M.R., Shelyakin, P.V., Ovchinnikov, G., Satybaldina, D., Kondrashov, V.A., Bandurist, M.S., Seilov, S., Gorin, D.A. and Fedorov, F.S., 2024. Monitoring of meat quality and change-point detection by a sensor array and profiling of bacterial communities. Analytica Chimica Acta, p.343022. |
| Ecology | Dashti, H., Chen, M., Smith, B., Zhao, K. and Moore, D., 2024. Rethinking Ecosystems Disturbance Recovery: what it was or what it could have been?. Geophysical Research Letters |
| Spatial Hydrology | Wang, Yiming, Xuesong Zhang, Kaiguang Zhao, and Debjani Singh. "Streamflow in the United States: Characteristics, trends, regime shifts, and extremes." Scientific Data 11, no. 1 (2024): 788. |
| Business Science | Li, Z. and Tian, Y., 2024. Skewed multifractal cross-correlation between price and volume during the COVID-19 pandemic: Evidence from China and European carbon markets. Applied Energy, 371, p.123716. |
| Ecography | Smith, M.M. and Pauli, J.N., 2024. Small but connected islands can maintain populations and genetic diversity under climate change. Ecography, p.e07119. |
| Economics | Sapkota, B.P., 2024. Analysis of Climate Policy and Monetary Policy Nexus in the Norwegian Context: A DSGE Approach (Master's thesis, Norwegian University of Life Sciences). |
| Cognitive Science | Prein, J.C., Maurits, L., Werwach, A., Haun, D.B. and Bohn, M., 2024. Variation in gaze following across the life span: A process‐level perspective. Developmental Science, p.e13546. |
| Neuroscience | Aqel, K., Wang, Z., Peng, Y.B. and Maia, P.D., 2024. Reconstructing rodent brain signals during euthanasia with eigensystem realization algorithm (ERA). Scientific Reports, 14(1), p.12261. |
| Glaciology | Ramón, C.L., Rueda, F.J., Priet‐Mahéo, M.C. and Andradóttir, H., 2024. The impact of deep glacial water diversions from a hydroelectric reservoir in the thermal dynamics of a sub-arctic lake. Journal of Hydrology, 635, p.131081. |
| Quaternary Science | Gibson, D.K., Bird, B.W., Finney, B.P. and Steinman, B.A., 2024. Holocene insolation and sea surface temperature influences on the polar front jet stream and precipitation in the midcontinental United States. Quaternary Science Reviews, 340, p.108865. |
| Geography | Lyu, R., Pang, J., Zhang, J. and Zhang, J., 2024. The impacts of disturbances on mountain ecosystem services: Insights from BEAST and Bayesian network. Applied Geography, 162, p.103143. |
| Watershed Hydrology | Sakizadeh, M., Milewski, A. and Sattari, M.T., 2023. Analysis of Long-Term Trend of Stream Flow and Interaction Effect of Land Use and Land Cover on Water Yield by SWAT Model and Statistical Learning in Part of Urmia Lake Basin, Northwest of Iran. Water, 15(4), p.690. |
| Oceanography | Oehlert, A.M., Hunter, H., Riopelle, C. and Purkis, S.J., 2023. Perturbation to North Atlantic Ocean‐Climate Dynamics Tripled Whitings Mud Production in the Bahamas. Journal of Geophysical Research: Oceans, 128(11), p.e2023JC020021. |
| Hydraulic Engineering | Xu, X., Yang, J., Ma, C., Qu, X., Chen, J. and Cheng, L., 2022. Segmented modeling method of dam displacement based on BEAST time series decomposition. Measurement, 202, p.111811. |
| Social Media | Barrie, C., Ketchley, N., Siegel, A. and Bagdouri, M., 2023. Measuring Media Freedom. |
| Political Economy | Benchimol, J. and Palumbo, L., 2023. Sanctions and Russian Online Prices. |
| Physiology | Shakeel, M., Brockmann, A. Temporal effects of sugar intake on fly local search and honey bee dance behaviour. J Comp Physiol A (2023). https://doi.org/10.1007/s00359-023-01670-6 |
| Injuries & Hazards | Delavary, M., Kalantari, A.H., Mohammadzadeh Moghaddam, A., Fakoor, V., Lavallière, M. and Wilhelm Siebert, F., 2024. Road traffic mortality in Iran: longitudinal trend and seasonal analysis, March 2011-February 2020. International journal of injury control and safety promotion, 31(1), pp.125-137. |
| Civil Engineering | Langtry, M., Wichitwechkarn, V., Ward, R., Zhuang, C., Kreitmair, M.J., Makasis, N., Conti, Z.X. and Choudhary, R., 2024. Impact of data for forecasting on performance of model predictive control in buildings with smart energy storage. Energy and Buildings, p.114605. |
| Ichthyology | Kaeding, L.R., 2023. Climate-change and nonnative-piscivore impacts on a renowned Oncorhynchus metapopulation, requirements for metapopulation recovery, and similarities to anadromous salmonid metapopulations. Aquatic Sciences, 85(4), p.88. |
| Remote Sensing | Mulverhill, C., Coops, N.C. and Achim, A., 2023. Continuous monitoring and sub-annual change detection in high-latitude forests using Harmonized Landsat Sentinel-2 data. ISPRS Journal of Photogrammetry and Remote Sensing, 197, pp.309-319. |
| Physical Chemistry | Faran, M. and Bisker, G., 2023. Nonequilibrium Self-Assembly Time Forecasting by the Stochastic Landscape Method. The Journal of Physical Chemistry B. |
| Biogeochemistry | Dahl, M., Gullström, M., Bernabeu, I., Serrano, O., Leiva‐Dueñas, C., Linderholm, H.W., Asplund, M.E., Björk, M., Ou, T., Svensson, J.R. and Andrén, E., 2024. A 2,000‐year record of eelgrass (Zostera marina L.) colonization shows substantial gains in blue carbon storage and nutrient retention. Global Biogeochemical Cycles, 38(3), p.e2023GB008039. |
| Mechanobiology | Faran, M., Ray, D., Nag, S., Raucci, U., Parrinello, M. and Bisker, G., 2024. A Stochastic Landscape Approach for Protein Folding State Classification. Journal of Chemical Theory and Computation. |
| Analytical Chemistry | Simic, M., Neuper, C., Hohenester, U. and Hill, C., 2023. Optofluidic force induction as a process analytical technology. Analytical and Bioanalytical Chemistry, pp.1-11. |
| Ecosystem Sciences | Lyu, R., Zhao, W., Pang, J., Tian, X., Zhang, J. and Wang, N., 2022. Towards a sustainable nature reserve management: Using Bayesian network to quantify the threat of disturbance to ecosystem services. Ecosystem Services, 58, p.101483. |
| Environmental Sciences | Nickerson, S., Chen, G., Fearnside, P., Allan, C.J., Hu, T., de Carvalho, L.M. and Zhao, K., 2022. Forest loss is significantly higher near clustered small dams than single large dams per megawatt of hydroelectricity installed in the Brazilian Amazon. Environmental Research Letters. |
| Geology | Fan, X., Goeppert, N. and Goldscheider, N., 2023. Quantifying the historic and future response of karst spring discharge to climate variability and change at a snow-influenced temperate catchment in central Europe. Hydrogeology Journal, pp.1-17. |
| Wildlife | Smith, Matthew M., and Jonathan N. Pauli. "Connectivity maintains genetic diversity and population persistence within an archipelagic refugia even under declining lake ice." Mechanisms of species recovery for a forest carnivore in a changing landscape: 173. |
| Climate Sciences | Duke, N.C., Mackenzie, J.R., Canning, A.D., Hutley, L.B., Bourke, A.J., Kovacs, J.M., Cormier, R., Staben, G., Lymburner, L. and Ai, E., 2022. ENSO-driven extreme oscillations in mean sea level destabilise critical shoreline mangroves—An emerging threat. PLOS Climate, 1(8), p.e000003 |
| Finance | Candelaria, Christopher A., Shelby M. McNeill, and Kenneth A. Shores. (2022). What is a School Finance Reform? Uncovering the ubiquity and diversity of school finance reforms using a Bayesian changepoint estimator.(EdWorkingPaper: 22-587). Retrieved from Annenberg Institute at Brown University: https://doi.org/10.26300/4vey-3w10 |
| Public health | Linnell, K., Fudolig, M., Schwartz, A., Ricketts, T.H., O'Neil-Dunne, J.P., Dodds, P.S. and Danforth, C.M., 2022. Spatial changes in park visitation at the onset of the pandemic. arXiv preprint arXiv:2205.15937. |
| Biometerology | Li, Y., Liu, Y., Bohrer, G., Cai, Y., Wilson, A., Hu, T., Wang, Z. and Zhao, K., 2022. Impacts of forest loss on local climate across the conterminous United States: Evidence from satellite time-series observations. Science of The Total Environment, 802, p.149651. |
| Applied Math | Ferguson, Daniel, and Francois G. Meyer. Probability density estimation for sets of large graphs with respect to spectral information using stochastic block models. arXiv preprint arXiv:2207.02168 (2022). |
| Transportation Science | Delavary, M., Kalantari, A.H., Mohammadzadeh Moghaddam, A., Fakoor, V., Lavalliere, M. and Wilhelm Siebert, F., 2023. Road traffic mortality in Iran: longitudinal trend and seasonal analysis, March 2011-February 2020. International Journal of Injury Control and Safety Promotion, pp.1-12. |
| Water quality | He, Ziming, Jiayu Yao, Yancen Lu, and Danlu Guo. "Detecting and explaining long-term changes in river water quality in south eastern Australia." Hydrological Processes: e14741. |
| Air quality | Wu, S., Yao, J., Wang, Y. and Zhao, W., 2023. Influencing factors of PM2. 5 concentrations in the typical urban agglomerations in China based on wavelet perspective. Environmental Research, p.116641. |
| Hydrology | Zohaib, M. and Choi, M., 2020. Satellite-based global-scale irrigation water use and its contemporary trends. Science of The Total Environment, 714, p.136719. |
| Energy Engineering | Lindig, S., Theristis, M. and Moser, D., 2022. Best practices for photovoltaic performance loss rate calculations. Progress in Energy, 4(2), p.022003. |
| Virology | Shen, L., Sun, M., Song, S., Hu, Q., Wang, N., Ou, G., Guo, Z., Du, J., Shao, Z., Bai, Y. and Liu, K., 2022. The impact of anti-COVID19 nonpharmaceutical interventions on hand, foot, and mouth disease—A spatiotemporal perspective in Xi'an, northwestern China. Journal of medical virology. |
| Pharmaceutical Sciences | Patzkowski, M.S., Costantino, R.C., Kane, T.M., Nghiem, V.T., Kroma, R.B. and Highland, K.B., 2022. Military Health System Opioid, Tramadol, and Gabapentinoid Prescription Volumes Before and After a Defense Health Agency Policy Release. Clinical Drug Investigation, pp.1-8. |
| Geography | Cai, Y., Liu, S. and Lin, H., 2020. Monitoring the vegetation dynamics in the Dongting Lake Wetland from 2000 to 2019 using the BEAST algorithm based on dense Landsat time series. Applied Sciences, 10(12), p.4209. |
| Oceanography | Pitarch, J., Bellacicco, M., Marullo, S. and Van Der Woerd, H.J., 2021. Global maps of Forel-Ule index, hue angle and Secchi disk depth derived from 21 years of monthly ESA Ocean Colour Climate Change Initiative data. Earth System Science Data, 13(2), pp.481-490. |
| Photovoltaics | Micheli, L., Theristis, M., Livera, A., Stein, J.S., Georghiou, G.E., Muller, M., Almonacid, F. and Fernadez, E.F., 2021. Improved PV soiling extraction through the detection of cleanings and change points. IEEE Journal of Photovoltaics, 11(2), pp.519-526. |
| Climate Sciences | White, J.H., Walsh, J.E. and Thoman Jr, R.L., 2021. Using Bayesian statistics to detect trends in Alaskan precipitation. International Journal of Climatology, 41(3), pp.2045-2059. |
| Field Hydrology | Merk, M., Goeppert, N. and Goldscheider, N., 2021. Deep desiccation of soils observed by long-term high-resolution measurements on a large inclined lysimeter. Hydrology and Earth System Sciences, 25(6), pp.3519-3538. |
| Sports Science | Roccetti, M. and Piconi, F., Minutes played by Under 21 players in Serie A: a descriptive analytics study. |
| Forest Ecology | Moreno-Fernandez, D., Viana-Soto, A., Camarero, J.J., Zavala, M.A., Tijerin, J. and Garcia, M., 2021. Using spectral indices as early warning signals of forest dieback: The case of drought-prone Pinus pinaster forests. Science of The Total Environment, 793, p.148578. |
| Petroleum Engineering | Pan, Y., Bi, R., Yang, S., Lyu, Z. and Ju, X., 2024, February. Application of a Bayesian Ensemble Algorithm for Automated Production Diagnostic of Gas Wells with Plunger-Lift. In International Petroleum Technology Conference (p. D011S029R008). IPTC. |
| Atmospheric Sciences | Tingwei, C., Tingxuan, H., Bing, M., Fei, G., Yanfang, X., Rongjie, L., Yi, M. and Jie, Z., 2021. Spatiotemporal pattern of aerosol types over the Bohai and Yellow Seas observed by CALIOP. Infrared and Laser Engineering, 50(6), p.20211030. |
| Terrestrial ecology | Dashti, H., Pandit, K., Glenn, N.F., Shinneman, D.J., Flerchinger, G.N., Hudak, A.T., de Graaf, M.A., Flores, A., Ustin, S., Ilangakoon, N. and Fellows, A.W., 2021. Performance of the ecosystem demography model (EDv2. 2) in simulating gross primary production capacity and activity in a dryland study area. Agricultural and Forest Meteorology, 297, p.108270. |
| Statistics | Storath, M. and Weinmann, A., 2023. Smoothing splines for discontinuous signals. Journal of Computational and Graphical Statistics, (just-accepted), pp.1-26. |
| Environmental Engineering | Bainbridge, R., Lim, M., Dunning, S., Winter, M.G., Diaz-Moreno, A., Martin, J., Torun, H., Sparkes, B., Khan, M.W. and Jin, N., 2022. Detection and forecasting of shallow landslides: lessons from a natural laboratory. Geomatics, Natural Hazards and Risk, 13(1), pp.686-704. |
| Fishery | Theis, S., Wallace, A.,, Poesch, M., Portiss, R. & Ruppert, J.. (2024). Balancing boat-electrofishing sampling effort against costs for nearshore fish communities in the Toronto waterfront, Lake Ontario. Fisheries Management and Ecology. 10.1111/fme.12733. |
| Hydrology | Yang, X., Tian, S., You, W. and Jiang, Z., 2021. Reconstruction of continuous GRACE/GRACE-FO terrestrial water storage anomalies based on time series decomposition. Journal of Hydrology, 603, p.127018. |
| Landscape Ecology | Adams, B.T., Matthews, S.N., Iverson, L.R., Prasad, A.M., Peters, M.P. and Zhao, K., 2021. Spring phenological variability promoted by topography and vegetation assembly processes in a temperate forest landscape. Agricultural and Forest Meteorology, 308, p.108578. |
Release history Release notifications | RSS feed


Download files
Download the file for your platform. If you're not sure which to choose, learn more about installing packages.
Source Distribution
Built Distributions
Filter files by name, interpreter, ABI, and platform.
If you're not sure about the file name format, learn more about wheel file names.
Copy a direct link to the current filters
File details
Details for the file rbeast-0.1.25.tar.gz.
File metadata
- Download URL: rbeast-0.1.25.tar.gz
- Upload date:
- Size: 747.6 kB
- Tags: Source
- Uploaded using Trusted Publishing? No
- Uploaded via: twine/6.2.0 CPython/3.9.18
File hashes
| Algorithm | Hash digest | |
|---|---|---|
| SHA256 |
8265bd53f9c16bdb1ab103de047288ea1af6875415394abf3ac0104cfb2917ec
|
|
| MD5 |
d5df561c47ac7e96b5bd2072a75fb7a0
|
|
| BLAKE2b-256 |
ac7f63f53b63d1fdc6fe854b9241c68f8aa0ae83616f142a95134fed733f2b28
|
File details
Details for the file rbeast-0.1.25-cp314-cp314-win_amd64.whl.
File metadata
- Download URL: rbeast-0.1.25-cp314-cp314-win_amd64.whl
- Upload date:
- Size: 534.2 kB
- Tags: CPython 3.14, Windows x86-64
- Uploaded using Trusted Publishing? No
- Uploaded via: twine/6.1.0 CPython/3.13.12
File hashes
| Algorithm | Hash digest | |
|---|---|---|
| SHA256 |
c3110930f587b10248af1332cfa52dc2df9e57fc1c95b609a07fa90c5596509e
|
|
| MD5 |
8a36162cc12dba90f744b2f65ec07c5e
|
|
| BLAKE2b-256 |
bf71cc160df3645c3942c944c1a4e089f579b692475315095a91e5551017491a
|
File details
Details for the file rbeast-0.1.25-cp314-cp314-musllinux_1_2_x86_64.whl.
File metadata
- Download URL: rbeast-0.1.25-cp314-cp314-musllinux_1_2_x86_64.whl
- Upload date:
- Size: 1.6 MB
- Tags: CPython 3.14, musllinux: musl 1.2+ x86-64
- Uploaded using Trusted Publishing? No
- Uploaded via: twine/6.1.0 CPython/3.13.12
File hashes
| Algorithm | Hash digest | |
|---|---|---|
| SHA256 |
c8d9de7c28d880e6fd2b23aaa4194320bf861364846fd4fdcb539add771a73e7
|
|
| MD5 |
d932b5c2caaa9fa3e62434eff4a64651
|
|
| BLAKE2b-256 |
59e78836eac3acded697934182745b85cb820a92ce7501d614014c097f62c3b4
|
File details
Details for the file rbeast-0.1.25-cp314-cp314-manylinux_2_27_aarch64.manylinux_2_28_aarch64.whl.
File metadata
- Download URL: rbeast-0.1.25-cp314-cp314-manylinux_2_27_aarch64.manylinux_2_28_aarch64.whl
- Upload date:
- Size: 1.3 MB
- Tags: CPython 3.14, manylinux: glibc 2.27+ ARM64, manylinux: glibc 2.28+ ARM64
- Uploaded using Trusted Publishing? No
- Uploaded via: twine/6.1.0 CPython/3.13.12
File hashes
| Algorithm | Hash digest | |
|---|---|---|
| SHA256 |
c1a594c2c908750dcb06fad4d58bf334b81f36c18352286a63f66ae093a79f2e
|
|
| MD5 |
42f8859253ca7c00c7fdcb609a39911f
|
|
| BLAKE2b-256 |
35691e35ed46e3f7f7f8d20212392a22602aad06d3da18f881402d6b0c0a06ca
|
File details
Details for the file rbeast-0.1.25-cp314-cp314-manylinux2014_x86_64.manylinux_2_17_x86_64.whl.
File metadata
- Download URL: rbeast-0.1.25-cp314-cp314-manylinux2014_x86_64.manylinux_2_17_x86_64.whl
- Upload date:
- Size: 1.6 MB
- Tags: CPython 3.14, manylinux: glibc 2.17+ x86-64
- Uploaded using Trusted Publishing? No
- Uploaded via: twine/6.1.0 CPython/3.13.12
File hashes
| Algorithm | Hash digest | |
|---|---|---|
| SHA256 |
4b71d82991e2b035acaaf136e0a80a5bb2aea6312da1e8e3cb509842f26f1a56
|
|
| MD5 |
9f26902f2d6065aebb013c8935407730
|
|
| BLAKE2b-256 |
9deda83e2126dcaf4b23b00e7c5c5625b380583bb0a3657344ad788c04333394
|
File details
Details for the file rbeast-0.1.25-cp314-cp314-macosx_11_0_arm64.whl.
File metadata
- Download URL: rbeast-0.1.25-cp314-cp314-macosx_11_0_arm64.whl
- Upload date:
- Size: 526.3 kB
- Tags: CPython 3.14, macOS 11.0+ ARM64
- Uploaded using Trusted Publishing? No
- Uploaded via: twine/6.1.0 CPython/3.13.12
File hashes
| Algorithm | Hash digest | |
|---|---|---|
| SHA256 |
35e0e7d635fe3f4bf6318942fef05b197d8ac8f84961385044c2805bae654d6d
|
|
| MD5 |
83b352e188cdf59e9a9b8c0aaaacb4ad
|
|
| BLAKE2b-256 |
7b2d7582ea6ca0cb0c1906f979cf716c8182a57f0d8b4877a56174a296ab0da2
|
File details
Details for the file rbeast-0.1.25-cp314-cp314-macosx_10_15_x86_64.whl.
File metadata
- Download URL: rbeast-0.1.25-cp314-cp314-macosx_10_15_x86_64.whl
- Upload date:
- Size: 610.6 kB
- Tags: CPython 3.14, macOS 10.15+ x86-64
- Uploaded using Trusted Publishing? No
- Uploaded via: twine/6.1.0 CPython/3.13.12
File hashes
| Algorithm | Hash digest | |
|---|---|---|
| SHA256 |
644a5fda1cff4acff052feb4faad48e53ca78f976e76129094c7574ef0943f32
|
|
| MD5 |
3bb2e5f2d7bff7254b4691c215333429
|
|
| BLAKE2b-256 |
8be7d42f8e4d5077f8e9006d71f1afb4e0b79f92ce93a18f151f979364a72360
|
File details
Details for the file rbeast-0.1.25-cp313-cp313-win_amd64.whl.
File metadata
- Download URL: rbeast-0.1.25-cp313-cp313-win_amd64.whl
- Upload date:
- Size: 526.4 kB
- Tags: CPython 3.13, Windows x86-64
- Uploaded using Trusted Publishing? No
- Uploaded via: twine/6.1.0 CPython/3.13.12
File hashes
| Algorithm | Hash digest | |
|---|---|---|
| SHA256 |
c8c510b12203f4b1957a1297a687f30195f5268a6e8cf26673d536461651adab
|
|
| MD5 |
cb22866f4f4109d5f760145aee7b2bf4
|
|
| BLAKE2b-256 |
853586a55faa25e6bcd52b892dfe4f25b738ac7936b339997442618770a6e031
|
File details
Details for the file rbeast-0.1.25-cp313-cp313-musllinux_1_2_x86_64.whl.
File metadata
- Download URL: rbeast-0.1.25-cp313-cp313-musllinux_1_2_x86_64.whl
- Upload date:
- Size: 1.6 MB
- Tags: CPython 3.13, musllinux: musl 1.2+ x86-64
- Uploaded using Trusted Publishing? No
- Uploaded via: twine/6.1.0 CPython/3.13.12
File hashes
| Algorithm | Hash digest | |
|---|---|---|
| SHA256 |
ba3a5bfb9dfdd2ab80a4f99e4d2f3b3ff8797516bce762ebae2d309596cd5005
|
|
| MD5 |
4b565e926c9f0ed41d349753ed02584e
|
|
| BLAKE2b-256 |
2b0d16ca6615dfa47ce5623adc321b36a7ada68815c48d2c567556f8f020e628
|
File details
Details for the file rbeast-0.1.25-cp313-cp313-manylinux_2_27_aarch64.manylinux_2_28_aarch64.whl.
File metadata
- Download URL: rbeast-0.1.25-cp313-cp313-manylinux_2_27_aarch64.manylinux_2_28_aarch64.whl
- Upload date:
- Size: 1.3 MB
- Tags: CPython 3.13, manylinux: glibc 2.27+ ARM64, manylinux: glibc 2.28+ ARM64
- Uploaded using Trusted Publishing? No
- Uploaded via: twine/6.1.0 CPython/3.13.12
File hashes
| Algorithm | Hash digest | |
|---|---|---|
| SHA256 |
41ec195d92f23431da861e420808a4035dfadd6668431a7b04bd6a9b7d7cbd30
|
|
| MD5 |
29fadcdfe30fc1fe56da79248fea3903
|
|
| BLAKE2b-256 |
12afeeb9f415482aa15d4773891a371b8991204c008692ca0c78aa14e0c0a034
|
File details
Details for the file rbeast-0.1.25-cp313-cp313-manylinux2014_x86_64.manylinux_2_17_x86_64.whl.
File metadata
- Download URL: rbeast-0.1.25-cp313-cp313-manylinux2014_x86_64.manylinux_2_17_x86_64.whl
- Upload date:
- Size: 1.6 MB
- Tags: CPython 3.13, manylinux: glibc 2.17+ x86-64
- Uploaded using Trusted Publishing? No
- Uploaded via: twine/6.1.0 CPython/3.13.12
File hashes
| Algorithm | Hash digest | |
|---|---|---|
| SHA256 |
7ba05ed03f3da0d2dbd88ddf70f89a54450f34ffc1650db80a9b11091b723c71
|
|
| MD5 |
1db0fef505d0974a599a2fa1c313b07e
|
|
| BLAKE2b-256 |
92fcc41132beaff55f156eb448ce15a68936c40d57bed37fd8d6faf08a7ad707
|
File details
Details for the file rbeast-0.1.25-cp313-cp313-macosx_11_0_arm64.whl.
File metadata
- Download URL: rbeast-0.1.25-cp313-cp313-macosx_11_0_arm64.whl
- Upload date:
- Size: 526.2 kB
- Tags: CPython 3.13, macOS 11.0+ ARM64
- Uploaded using Trusted Publishing? No
- Uploaded via: twine/6.1.0 CPython/3.13.12
File hashes
| Algorithm | Hash digest | |
|---|---|---|
| SHA256 |
c7373e0a3b5eb35ee1ae7eb1b0753bfe196399c344db40cf44dc7d232216b415
|
|
| MD5 |
476afcd1306cf5d1233b54dce939ee29
|
|
| BLAKE2b-256 |
23b022aeb3ae988cb6378090150904c1577780a79c32152869275ac682ebc7a1
|
File details
Details for the file rbeast-0.1.25-cp313-cp313-macosx_10_13_x86_64.whl.
File metadata
- Download URL: rbeast-0.1.25-cp313-cp313-macosx_10_13_x86_64.whl
- Upload date:
- Size: 610.0 kB
- Tags: CPython 3.13, macOS 10.13+ x86-64
- Uploaded using Trusted Publishing? No
- Uploaded via: twine/6.1.0 CPython/3.13.12
File hashes
| Algorithm | Hash digest | |
|---|---|---|
| SHA256 |
c7d017bd248aa79c9fcd1bff78a064da39e6fe4dbddc7f1a2553dddc545f775b
|
|
| MD5 |
902f19a67e8b3f0b669544b105153bc9
|
|
| BLAKE2b-256 |
9f6121beca1d68e1a48b43000e38e86f0fb17fe764ef25a50966829def2161c5
|
File details
Details for the file rbeast-0.1.25-cp312-cp312-win_amd64.whl.
File metadata
- Download URL: rbeast-0.1.25-cp312-cp312-win_amd64.whl
- Upload date:
- Size: 526.4 kB
- Tags: CPython 3.12, Windows x86-64
- Uploaded using Trusted Publishing? No
- Uploaded via: twine/6.1.0 CPython/3.13.12
File hashes
| Algorithm | Hash digest | |
|---|---|---|
| SHA256 |
3679a359ccde0ca5a3dc452fc0c114fa34ebc7bd1469afcd43ae3315a95401a6
|
|
| MD5 |
bf16009a2048c19cd5e3c06ac04151c5
|
|
| BLAKE2b-256 |
2cdb8736a278f62019693b6035945de04ac829d0bc819a803655a4891b493618
|
File details
Details for the file rbeast-0.1.25-cp312-cp312-musllinux_1_2_x86_64.whl.
File metadata
- Download URL: rbeast-0.1.25-cp312-cp312-musllinux_1_2_x86_64.whl
- Upload date:
- Size: 1.6 MB
- Tags: CPython 3.12, musllinux: musl 1.2+ x86-64
- Uploaded using Trusted Publishing? No
- Uploaded via: twine/6.1.0 CPython/3.13.12
File hashes
| Algorithm | Hash digest | |
|---|---|---|
| SHA256 |
c65b262a8917671a3d1e3eb3c4fdfe85d32be4691893b845be0ba0c668e8f646
|
|
| MD5 |
4873e569d4aa5efe0c8cdb6af253f434
|
|
| BLAKE2b-256 |
878c1a2626096c2e58c696d93b53fcfdf5a5f167ced989090e89c36819c6b5d3
|
File details
Details for the file rbeast-0.1.25-cp312-cp312-manylinux_2_27_aarch64.manylinux_2_28_aarch64.whl.
File metadata
- Download URL: rbeast-0.1.25-cp312-cp312-manylinux_2_27_aarch64.manylinux_2_28_aarch64.whl
- Upload date:
- Size: 1.3 MB
- Tags: CPython 3.12, manylinux: glibc 2.27+ ARM64, manylinux: glibc 2.28+ ARM64
- Uploaded using Trusted Publishing? No
- Uploaded via: twine/6.1.0 CPython/3.13.12
File hashes
| Algorithm | Hash digest | |
|---|---|---|
| SHA256 |
6499cf27d67e10a05599dc194e8fd90ff667efa7ed557408c5ac823bb458f8ca
|
|
| MD5 |
ca0d6611fa743a5f1476fe7746d290b4
|
|
| BLAKE2b-256 |
9c9ee2671e3205d08d4a61f7c674519fecb44efc8c6e285bf94efd30c27599fa
|
File details
Details for the file rbeast-0.1.25-cp312-cp312-manylinux2014_x86_64.manylinux_2_17_x86_64.whl.
File metadata
- Download URL: rbeast-0.1.25-cp312-cp312-manylinux2014_x86_64.manylinux_2_17_x86_64.whl
- Upload date:
- Size: 1.6 MB
- Tags: CPython 3.12, manylinux: glibc 2.17+ x86-64
- Uploaded using Trusted Publishing? No
- Uploaded via: twine/6.1.0 CPython/3.13.12
File hashes
| Algorithm | Hash digest | |
|---|---|---|
| SHA256 |
1bde99a4c3b6cc8b130c8cd2d179385c50dbba6b00d82917ecb2475b0083eab5
|
|
| MD5 |
8f19d76223f20d21fce77a59e0afa760
|
|
| BLAKE2b-256 |
a6affa38a14c1557ad93ffca72abf933b29b4f9ee430a95bda90e183a9dcb33f
|
File details
Details for the file rbeast-0.1.25-cp312-cp312-macosx_11_0_arm64.whl.
File metadata
- Download URL: rbeast-0.1.25-cp312-cp312-macosx_11_0_arm64.whl
- Upload date:
- Size: 526.2 kB
- Tags: CPython 3.12, macOS 11.0+ ARM64
- Uploaded using Trusted Publishing? No
- Uploaded via: twine/6.1.0 CPython/3.13.12
File hashes
| Algorithm | Hash digest | |
|---|---|---|
| SHA256 |
d150828140dab2c6bd2b42d8d281b24e65173b43943e9b799e5a4e993b3f18cd
|
|
| MD5 |
f9b5ddf40eccceb72fb513d830793ae1
|
|
| BLAKE2b-256 |
03acf193c3359ad3e56e41d540b893bff33d00e4ddf420247409d75b7fdf807c
|
File details
Details for the file rbeast-0.1.25-cp312-cp312-macosx_10_13_x86_64.whl.
File metadata
- Download URL: rbeast-0.1.25-cp312-cp312-macosx_10_13_x86_64.whl
- Upload date:
- Size: 610.0 kB
- Tags: CPython 3.12, macOS 10.13+ x86-64
- Uploaded using Trusted Publishing? No
- Uploaded via: twine/6.1.0 CPython/3.13.12
File hashes
| Algorithm | Hash digest | |
|---|---|---|
| SHA256 |
a8f1b545f1af1e67f502408a35110b22672f1f26d20549f9115faf796b21833c
|
|
| MD5 |
e6d31a13e6422a3e0049514fa8e87fd8
|
|
| BLAKE2b-256 |
d9a7f4ac836fa634583d25d5a4e23e3c0200028c4daa6d7403d24f3ea51fc332
|
File details
Details for the file rbeast-0.1.25-cp311-cp311-win_amd64.whl.
File metadata
- Download URL: rbeast-0.1.25-cp311-cp311-win_amd64.whl
- Upload date:
- Size: 526.2 kB
- Tags: CPython 3.11, Windows x86-64
- Uploaded using Trusted Publishing? No
- Uploaded via: twine/6.1.0 CPython/3.13.12
File hashes
| Algorithm | Hash digest | |
|---|---|---|
| SHA256 |
78be59f8c5a47163b880fd2c29e0367b7a9e213d1fae9ddca7df08ffef2d0ab9
|
|
| MD5 |
f76fb46f47c7536109365d21a106579d
|
|
| BLAKE2b-256 |
e8ce071578b04c2cb1d9994caddfbba4b8250395609eb33bffc56f21e5efe86a
|
File details
Details for the file rbeast-0.1.25-cp311-cp311-musllinux_1_2_x86_64.whl.
File metadata
- Download URL: rbeast-0.1.25-cp311-cp311-musllinux_1_2_x86_64.whl
- Upload date:
- Size: 1.6 MB
- Tags: CPython 3.11, musllinux: musl 1.2+ x86-64
- Uploaded using Trusted Publishing? No
- Uploaded via: twine/6.1.0 CPython/3.13.12
File hashes
| Algorithm | Hash digest | |
|---|---|---|
| SHA256 |
567a7823c2f2968aff5e5270aa8a3cf44357a11e470f6813a60a1094810aee22
|
|
| MD5 |
aa58fabe65de223e90fe57b23d7e4185
|
|
| BLAKE2b-256 |
614f134cd42b6baabdc80b2d9e947d3d7a5fabb426ba509494104db25e5fef36
|
File details
Details for the file rbeast-0.1.25-cp311-cp311-manylinux_2_27_aarch64.manylinux_2_28_aarch64.whl.
File metadata
- Download URL: rbeast-0.1.25-cp311-cp311-manylinux_2_27_aarch64.manylinux_2_28_aarch64.whl
- Upload date:
- Size: 1.3 MB
- Tags: CPython 3.11, manylinux: glibc 2.27+ ARM64, manylinux: glibc 2.28+ ARM64
- Uploaded using Trusted Publishing? No
- Uploaded via: twine/6.1.0 CPython/3.13.12
File hashes
| Algorithm | Hash digest | |
|---|---|---|
| SHA256 |
386efaf7c100e2f6636b2493a757342b6a0d0fc7f36ba0577bfb49c2c73920ed
|
|
| MD5 |
c5049385c8f42cb8d60315888cc8df84
|
|
| BLAKE2b-256 |
783c6c9d2989f9aae303199e06d3cf97c5cd0b9553b466ef9091c26abe206e10
|
File details
Details for the file rbeast-0.1.25-cp311-cp311-manylinux2014_x86_64.manylinux_2_17_x86_64.whl.
File metadata
- Download URL: rbeast-0.1.25-cp311-cp311-manylinux2014_x86_64.manylinux_2_17_x86_64.whl
- Upload date:
- Size: 1.6 MB
- Tags: CPython 3.11, manylinux: glibc 2.17+ x86-64
- Uploaded using Trusted Publishing? No
- Uploaded via: twine/6.1.0 CPython/3.13.12
File hashes
| Algorithm | Hash digest | |
|---|---|---|
| SHA256 |
fce6fee6cae54feace8cd30ad14263824a2b943332dff12b459f44c336e44dbb
|
|
| MD5 |
12c842ba8b811a959f90a8490842de11
|
|
| BLAKE2b-256 |
349609045904cd2f5984c57099da10a5d077d4d2bf618a1fdde2db559d6bb509
|
File details
Details for the file rbeast-0.1.25-cp311-cp311-macosx_11_0_arm64.whl.
File metadata
- Download URL: rbeast-0.1.25-cp311-cp311-macosx_11_0_arm64.whl
- Upload date:
- Size: 526.2 kB
- Tags: CPython 3.11, macOS 11.0+ ARM64
- Uploaded using Trusted Publishing? No
- Uploaded via: twine/6.1.0 CPython/3.13.12
File hashes
| Algorithm | Hash digest | |
|---|---|---|
| SHA256 |
aeef744d2c5eae8ea08497fc813e18f03645f5e1ba47b7eaf3256ad5983af4b7
|
|
| MD5 |
492e93f70695e82d9706da512af84b98
|
|
| BLAKE2b-256 |
e5570b165a8c34e41e8067ef24c2899f952120d06cd0c4a17efc9ef0a50a0957
|
File details
Details for the file rbeast-0.1.25-cp311-cp311-macosx_10_9_x86_64.whl.
File metadata
- Download URL: rbeast-0.1.25-cp311-cp311-macosx_10_9_x86_64.whl
- Upload date:
- Size: 609.5 kB
- Tags: CPython 3.11, macOS 10.9+ x86-64
- Uploaded using Trusted Publishing? No
- Uploaded via: twine/6.1.0 CPython/3.13.12
File hashes
| Algorithm | Hash digest | |
|---|---|---|
| SHA256 |
d2cbf7b4998c9c34852d4523c549998dd1926c19935a0b9d5c18b04fa8b1499c
|
|
| MD5 |
dd4c1b43c16a4bb12f3563321493a568
|
|
| BLAKE2b-256 |
7d902bbd259e2e114fe5721a48b5aa7d6838b4c4a6a711fe3f3e99f8c06d150a
|
File details
Details for the file rbeast-0.1.25-cp310-cp310-win_amd64.whl.
File metadata
- Download URL: rbeast-0.1.25-cp310-cp310-win_amd64.whl
- Upload date:
- Size: 526.2 kB
- Tags: CPython 3.10, Windows x86-64
- Uploaded using Trusted Publishing? No
- Uploaded via: twine/6.1.0 CPython/3.13.12
File hashes
| Algorithm | Hash digest | |
|---|---|---|
| SHA256 |
05e3ac1ce56c2a8a92047652551f44c64e65596a33d1e209c2eaad78d6f8476a
|
|
| MD5 |
7ee12b3ba690d5e2926bdd7686be3f0f
|
|
| BLAKE2b-256 |
88c47ba448815e0ccb1ac0c66b7085a141ead9c704a3c2d0f4a411db4e8a1654
|
File details
Details for the file rbeast-0.1.25-cp310-cp310-musllinux_1_2_x86_64.whl.
File metadata
- Download URL: rbeast-0.1.25-cp310-cp310-musllinux_1_2_x86_64.whl
- Upload date:
- Size: 1.6 MB
- Tags: CPython 3.10, musllinux: musl 1.2+ x86-64
- Uploaded using Trusted Publishing? No
- Uploaded via: twine/6.1.0 CPython/3.13.12
File hashes
| Algorithm | Hash digest | |
|---|---|---|
| SHA256 |
57b59c6045719c6bdbb4acd836435626540365c9fe4a4301721bb7a470577725
|
|
| MD5 |
3a05963f16c464865cc0ff36ba0833d5
|
|
| BLAKE2b-256 |
d11eed2d2fc0e00a04425d90db65a2aeccfb8b0fa21b48b6dc37fc4ef650b897
|
File details
Details for the file rbeast-0.1.25-cp310-cp310-manylinux_2_27_aarch64.manylinux_2_28_aarch64.whl.
File metadata
- Download URL: rbeast-0.1.25-cp310-cp310-manylinux_2_27_aarch64.manylinux_2_28_aarch64.whl
- Upload date:
- Size: 1.3 MB
- Tags: CPython 3.10, manylinux: glibc 2.27+ ARM64, manylinux: glibc 2.28+ ARM64
- Uploaded using Trusted Publishing? No
- Uploaded via: twine/6.1.0 CPython/3.13.12
File hashes
| Algorithm | Hash digest | |
|---|---|---|
| SHA256 |
8ef2eb20b5ee99b675a4a28fd064c09803b6530777a75c9e99fa62069f3d82f4
|
|
| MD5 |
638a1ed38422a640a430e7a043209edc
|
|
| BLAKE2b-256 |
4fe99b2f8b7de2af763f217864c9dbd1c74e4e9ddd6155c31d0775baa5a60ff0
|
File details
Details for the file rbeast-0.1.25-cp310-cp310-manylinux2014_x86_64.manylinux_2_17_x86_64.whl.
File metadata
- Download URL: rbeast-0.1.25-cp310-cp310-manylinux2014_x86_64.manylinux_2_17_x86_64.whl
- Upload date:
- Size: 1.6 MB
- Tags: CPython 3.10, manylinux: glibc 2.17+ x86-64
- Uploaded using Trusted Publishing? No
- Uploaded via: twine/6.1.0 CPython/3.13.12
File hashes
| Algorithm | Hash digest | |
|---|---|---|
| SHA256 |
eeac5f0834107fcf8444ba8a0da9866636d9f36c2d8fc5c3e6c5147cb18d8b6c
|
|
| MD5 |
2c8c7a91d53f5420b6c2e07de1eff0cc
|
|
| BLAKE2b-256 |
53e506df8d215723fd26f6660b7b5506bcca2e06e315e7b51906b35a60a59e9d
|
File details
Details for the file rbeast-0.1.25-cp310-cp310-macosx_11_0_arm64.whl.
File metadata
- Download URL: rbeast-0.1.25-cp310-cp310-macosx_11_0_arm64.whl
- Upload date:
- Size: 526.2 kB
- Tags: CPython 3.10, macOS 11.0+ ARM64
- Uploaded using Trusted Publishing? No
- Uploaded via: twine/6.1.0 CPython/3.13.12
File hashes
| Algorithm | Hash digest | |
|---|---|---|
| SHA256 |
2be3e3c9d8d6138edf15d8d8277745b9d32de3533a5a1d26a7ce85ab493a0fe0
|
|
| MD5 |
6c7a64777b9160b682194eb7bdbd1441
|
|
| BLAKE2b-256 |
bc73fb6d5dca9b94642441694c8f7530c550de51adc32f0c86d0eba990211965
|
File details
Details for the file rbeast-0.1.25-cp310-cp310-macosx_10_9_x86_64.whl.
File metadata
- Download URL: rbeast-0.1.25-cp310-cp310-macosx_10_9_x86_64.whl
- Upload date:
- Size: 609.5 kB
- Tags: CPython 3.10, macOS 10.9+ x86-64
- Uploaded using Trusted Publishing? No
- Uploaded via: twine/6.1.0 CPython/3.13.12
File hashes
| Algorithm | Hash digest | |
|---|---|---|
| SHA256 |
736b53113e87082a3781c594267f6ae3331785ad8d1ec3df14dd73238d8b2cb3
|
|
| MD5 |
7fee86460830ba26faad639110ed06dd
|
|
| BLAKE2b-256 |
5256e624bab48754e34552cd4e8c8b33597e1e2d077124e5dbf6acc101e66fb0
|
File details
Details for the file rbeast-0.1.25-cp39-cp39-win_amd64.whl.
File metadata
- Download URL: rbeast-0.1.25-cp39-cp39-win_amd64.whl
- Upload date:
- Size: 526.5 kB
- Tags: CPython 3.9, Windows x86-64
- Uploaded using Trusted Publishing? No
- Uploaded via: twine/6.2.0 CPython/3.9.18
File hashes
| Algorithm | Hash digest | |
|---|---|---|
| SHA256 |
fb4dc9a9140b29b317e01f71ecf40a55bc9abc67c382cd48020cf356fe2f559a
|
|
| MD5 |
05a6831f136dc6c10e58fd0276507531
|
|
| BLAKE2b-256 |
a9c6d42cf93c541e77405429d02c2f77299fa857d9f83400128bee8d5feaff4d
|
File details
Details for the file rbeast-0.1.25-cp39-cp39-musllinux_1_2_x86_64.whl.
File metadata
- Download URL: rbeast-0.1.25-cp39-cp39-musllinux_1_2_x86_64.whl
- Upload date:
- Size: 1.6 MB
- Tags: CPython 3.9, musllinux: musl 1.2+ x86-64
- Uploaded using Trusted Publishing? No
- Uploaded via: twine/6.2.0 CPython/3.9.18
File hashes
| Algorithm | Hash digest | |
|---|---|---|
| SHA256 |
567703c466161976c52b95326c223e50c8ebc4a39a5648657a4f4baf2df0f68f
|
|
| MD5 |
4b62498ce9ccb4f63ee605c423175fcf
|
|
| BLAKE2b-256 |
3d6fd613fdf8d63ac758b5c80070bfc5327170d6b350dbef323e60d3125ae07d
|
File details
Details for the file rbeast-0.1.25-cp39-cp39-manylinux_2_27_aarch64.manylinux_2_28_aarch64.whl.
File metadata
- Download URL: rbeast-0.1.25-cp39-cp39-manylinux_2_27_aarch64.manylinux_2_28_aarch64.whl
- Upload date:
- Size: 1.3 MB
- Tags: CPython 3.9, manylinux: glibc 2.27+ ARM64, manylinux: glibc 2.28+ ARM64
- Uploaded using Trusted Publishing? No
- Uploaded via: twine/6.2.0 CPython/3.9.18
File hashes
| Algorithm | Hash digest | |
|---|---|---|
| SHA256 |
dd4b086dd406b0d0189dd4e0a6d0abb51c578a37f7d6e8773a8a93a474cd964d
|
|
| MD5 |
d8ee1f1910bff9aa6215a24ddcafcf12
|
|
| BLAKE2b-256 |
b2e8d20f3953f9b45abdcdbad1561af580f8e9ce3229f9d89cfc545f6c8a85ad
|
File details
Details for the file rbeast-0.1.25-cp39-cp39-manylinux2014_x86_64.manylinux_2_17_x86_64.whl.
File metadata
- Download URL: rbeast-0.1.25-cp39-cp39-manylinux2014_x86_64.manylinux_2_17_x86_64.whl
- Upload date:
- Size: 1.6 MB
- Tags: CPython 3.9, manylinux: glibc 2.17+ x86-64
- Uploaded using Trusted Publishing? No
- Uploaded via: twine/6.2.0 CPython/3.9.18
File hashes
| Algorithm | Hash digest | |
|---|---|---|
| SHA256 |
8e42db6e95e371592c15299cf18b8b1738bccd81c8f68277e9cb792adc12c59e
|
|
| MD5 |
fe28ce26cd3e32d84cda064859786695
|
|
| BLAKE2b-256 |
067539a24d8f9160bbeecdf175a717b0cfbc16c74662989d96da6013436e8359
|
File details
Details for the file rbeast-0.1.25-cp39-cp39-macosx_11_0_arm64.whl.
File metadata
- Download URL: rbeast-0.1.25-cp39-cp39-macosx_11_0_arm64.whl
- Upload date:
- Size: 526.2 kB
- Tags: CPython 3.9, macOS 11.0+ ARM64
- Uploaded using Trusted Publishing? No
- Uploaded via: twine/6.2.0 CPython/3.9.18
File hashes
| Algorithm | Hash digest | |
|---|---|---|
| SHA256 |
c39f2cf72aa48f1cfc0a1925a932ecf9f0830a4daa131bb461fcc733e53d7532
|
|
| MD5 |
fb6fce2ce5c17ae52dd835e9f437cccd
|
|
| BLAKE2b-256 |
c3a49e297246a5a4ba1fd5bcdbcf49ef60ba032f2a00f77e7999ed5e4ba83f0e
|
File details
Details for the file rbeast-0.1.25-cp39-cp39-macosx_10_9_x86_64.whl.
File metadata
- Download URL: rbeast-0.1.25-cp39-cp39-macosx_10_9_x86_64.whl
- Upload date:
- Size: 609.4 kB
- Tags: CPython 3.9, macOS 10.9+ x86-64
- Uploaded using Trusted Publishing? No
- Uploaded via: twine/6.2.0 CPython/3.9.18
File hashes
| Algorithm | Hash digest | |
|---|---|---|
| SHA256 |
1c3ab730f28901389bdab502a435fb98801dcca791d7f97090ac4840a9f57141
|
|
| MD5 |
7ca8b2c3b91258aba98b082384e612fc
|
|
| BLAKE2b-256 |
4490b33b45d9c784481a2fca6a9c081bcb52e3fad35a38f92a8312a1c2dcecca
|
File details
Details for the file rbeast-0.1.25-cp38-cp38-win_amd64.whl.
File metadata
- Download URL: rbeast-0.1.25-cp38-cp38-win_amd64.whl
- Upload date:
- Size: 526.4 kB
- Tags: CPython 3.8, Windows x86-64
- Uploaded using Trusted Publishing? No
- Uploaded via: twine/6.2.0 CPython/3.9.18
File hashes
| Algorithm | Hash digest | |
|---|---|---|
| SHA256 |
27201511da01eeb508346162c97857ef42cca6a72a782f1ca174319972298ee2
|
|
| MD5 |
9fb09112062a6868c491662bcb81bb5c
|
|
| BLAKE2b-256 |
a2df29fbc2b7ae838f587a34811ad593204e9b566e0b6134269767d5d760d4c0
|
File details
Details for the file rbeast-0.1.25-cp38-cp38-manylinux_2_27_aarch64.manylinux_2_28_aarch64.whl.
File metadata
- Download URL: rbeast-0.1.25-cp38-cp38-manylinux_2_27_aarch64.manylinux_2_28_aarch64.whl
- Upload date:
- Size: 1.3 MB
- Tags: CPython 3.8, manylinux: glibc 2.27+ ARM64, manylinux: glibc 2.28+ ARM64
- Uploaded using Trusted Publishing? No
- Uploaded via: twine/6.2.0 CPython/3.9.18
File hashes
| Algorithm | Hash digest | |
|---|---|---|
| SHA256 |
5dc0a8b96cd8713b8d487c277aecc8bdc6901a52dfa37f39e328ea56030579d8
|
|
| MD5 |
f84aa2b46f47797535b2db59877aa411
|
|
| BLAKE2b-256 |
8268a04b9fc4b912c08207e2d13c33f16a40d7d1cdc1b77c8d7db73ce1dbd807
|
File details
Details for the file rbeast-0.1.25-cp38-cp38-manylinux2014_x86_64.manylinux_2_17_x86_64.whl.
File metadata
- Download URL: rbeast-0.1.25-cp38-cp38-manylinux2014_x86_64.manylinux_2_17_x86_64.whl
- Upload date:
- Size: 1.6 MB
- Tags: CPython 3.8, manylinux: glibc 2.17+ x86-64
- Uploaded using Trusted Publishing? No
- Uploaded via: twine/6.2.0 CPython/3.9.18
File hashes
| Algorithm | Hash digest | |
|---|---|---|
| SHA256 |
2cc35b4c255acaaed005781adbf302fc12d4b674fc0e0394a4e9724bccd89810
|
|
| MD5 |
1ddbf148fe0749d3397925e6e92c0f97
|
|
| BLAKE2b-256 |
a31afa285c67c16deac1c50ee2be26d3ef63e3542da3d4fc2ff39b1664684c58
|
File details
Details for the file rbeast-0.1.25-cp38-cp38-macosx_11_0_arm64.whl.
File metadata
- Download URL: rbeast-0.1.25-cp38-cp38-macosx_11_0_arm64.whl
- Upload date:
- Size: 526.0 kB
- Tags: CPython 3.8, macOS 11.0+ ARM64
- Uploaded using Trusted Publishing? No
- Uploaded via: twine/6.2.0 CPython/3.9.18
File hashes
| Algorithm | Hash digest | |
|---|---|---|
| SHA256 |
77f6bd0ec8ddd56c5b36819696a0d2fd45191330d7596e25c8ccff8c6831627e
|
|
| MD5 |
b45c215acf6591deb6a44b34a5098bfa
|
|
| BLAKE2b-256 |
afd23b40e8780c46d56a0af4f7479c2c2b605269fa1b45b8772273f8a73e9eca
|
File details
Details for the file rbeast-0.1.25-cp38-cp38-macosx_10_9_x86_64.whl.
File metadata
- Download URL: rbeast-0.1.25-cp38-cp38-macosx_10_9_x86_64.whl
- Upload date:
- Size: 609.3 kB
- Tags: CPython 3.8, macOS 10.9+ x86-64
- Uploaded using Trusted Publishing? No
- Uploaded via: twine/6.2.0 CPython/3.9.18
File hashes
| Algorithm | Hash digest | |
|---|---|---|
| SHA256 |
bf24f48b4137f7c8c0d6cd51e6593cf3ac5cdd45cc781ff57156c4ed695ca248
|
|
| MD5 |
ce47bb95b97be588c52aa6452aa0f117
|
|
| BLAKE2b-256 |
f654ef83231ec97101eb63ac407d8babeb4fd12e6b9d69799a630984f77e90f9
|
File details
Details for the file rbeast-0.1.25-cp37-cp37m-win_amd64.whl.
File metadata
- Download URL: rbeast-0.1.25-cp37-cp37m-win_amd64.whl
- Upload date:
- Size: 525.0 kB
- Tags: CPython 3.7m, Windows x86-64
- Uploaded using Trusted Publishing? No
- Uploaded via: twine/6.2.0 CPython/3.9.18
File hashes
| Algorithm | Hash digest | |
|---|---|---|
| SHA256 |
472d0e6e14b1f9074a34e4302eafcaab5e373fe30f1cf012176f3dc1eac2eec6
|
|
| MD5 |
fa27759d17721ce5c0627e306780f689
|
|
| BLAKE2b-256 |
4ac6cf2e8dc858942f146a871e3cae466104c575638eadcb689616eadb7974bf
|


