
Universal Python library for SCPI test equipment over Ethernet, USB, GPIB or serial. One API for oscilloscopes (Siglent, Tektronix, LeCroy), AWGs, power supplies and DAQ units, with waveform capture and provenance, FFT analysis, a PyQt6 GUI, a browser lab gateway, PDF/Markdown reports with local-LLM analysis, and high-fidelity mock instruments for developing with no hardware attached.
Verified details
These details have been verified by PyPIProject links
GitHub Statistics
Maintainers

Project description
SCPI Instrument Control











Control SCPI-compatible test equipment from Python — oscilloscopes, function generators (AWGs), power supplies, and data-acquisition units — over Ethernet/LAN, plus USB, GPIB, and serial through the optional VISA backend.
- One API across vendors. Siglent, Tektronix, and LeCroy oscilloscopes, auto-detected from
*IDN?, alongside PSUs and DAQ units. - Develop without hardware. A realistic mock layer synthesizes state-coupled, trigger-aligned waveforms, so the whole stack runs — and CI passes — with nothing on your bench.
- See it live. A high-performance PyQt6 GUI with interactive measurement markers, plus a browser-based lab gateway.
- Keep the evidence. Provenance-stamped waveform files and automated PDF/Markdown test reports with local-LLM analysis.
Formerly
Siglent-Oscilloscope. Upgrading from the old package? See the Migration Guide.

A live screen capture pulled over LAN from a Siglent SDS824X HD (its 1 kHz calibration square wave), via scope.screen_capture.get_screenshot_pil().
Features
Core Features
- Programmatic API: Control your oscilloscope from Python scripts
- Multi-Vendor Oscilloscope Support: Siglent (legacy SDS1000X-E/SDS2000X Plus and modern SDS800X HD/SDS5000X dialects), Tektronix, and LeCroy, auto-detected from
*IDN? - Power Supply & DAQ Support: drive Siglent SPD-series power supplies and SCPI data-acquisition/data-logger units alongside the scope
- Automation & Data Collection: High-level API for batch capture, continuous monitoring, and analysis
- GUI Application: Modern PyQt6-based graphical interface
- Waveform Acquisition: Capture and download waveform data in multiple formats (.npz, .csv, .mat, .h5)
- Acquisition Provenance: every saved waveform records the instrument, settings, and timestamp that produced it; extract raw data from any saved file with load_waveform() or the scpi-extract CLI
- Synthetic Signals & Realistic Mock: generate parameterized test waveforms (sine/square/triangle/ramp/DC/noise) with
SignalSpec/make_waveform, orsynthesize()/stream()for one-shot arrays and phase-continuous, optionally real-time-paced chunks; develop without hardware against a mock scope that synthesizes state-coupled, trigger-aligned waveforms by default - Channel Configuration: Control voltage scale, coupling, offset, bandwidth
- Trigger Settings: Configure trigger modes, levels, edge detection
- Advanced Analysis: Built-in FFT, SNR, THD, and statistical analysis tools
GUI Features (New!)
- High-Performance Live View: Real-time waveform display (5-20 fps, configurable) using PyQtGraph
- Interactive Visual Measurements: Click-and-drag measurement markers directly on waveforms
- 15+ measurement types: Frequency, Vpp, Rise Time, Duty Cycle, etc.
- Visual gates and markers with real-time calculation
- Save/load measurement configurations
- Export results to CSV/JSON
- Non-Blocking Updates: Threaded data acquisition keeps GUI responsive
- Reference Waveforms: Save, overlay, and compare waveforms
- Protocol Decoding: I2C, SPI, UART, CAN, LIN support
- Math Functions: Custom math expressions on waveforms
- VNC Display: Embedded oscilloscope screen viewer
Automated Test Report Generation 📊
Automatically generate comprehensive PDF and Markdown test reports from your waveform captures with detailed analysis, visualizations, and AI-powered insights. Perfect for documentation, test validation, and automated quality control.
# Install report generator dependencies
# pip install "SCPI-Instrument-Control[report-generator]"

from datetime import datetime
from pathlib import Path

from scpi_control.report_generator.generators.markdown_generator import MarkdownReportGenerator
from scpi_control.report_generator.generators.pdf_generator import PDFReportGenerator
from scpi_control.report_generator.models.report_data import ReportMetadata, TestReport, TestSection, WaveformData

# time_data / voltage_data: your captured numpy arrays (e.g. from scope.get_waveform)
waveform = WaveformData(channel="CH1", time=time_data, voltage=voltage_data, sample_rate=1e6, record_length=len(voltage_data))

metadata = ReportMetadata(title="Probe Calibration Test Report", technician="Lab Technician", test_date=datetime.now(), equipment_model="SDS824X HD")
report = TestReport(metadata=metadata)
report.add_section(TestSection(title="Waveform Captures", waveforms=[waveform], order=1))
report.overall_result = report.calculate_overall_result()

MarkdownReportGenerator().generate(report, Path("calibration_report.md"))
PDFReportGenerator().generate(report, Path("calibration_report.pdf"))
Key Features:
- ✅ Automatic Signal Detection - FFT-based classification (sine, square, triangle, pulse, etc.)
- ✅ Comprehensive Statistics - 25+ parameters including Vpp, RMS, frequency, SNR, THD, jitter, overshoot
- ✅ Template Presets - Ready-made report templates such as
ReportTemplate.create_probe_calibration_template(), manageable from the GUI's Template Manager - ✅ Local-LLM Analysis - Optional AI insights and Q&A tool-calling via Ollama running on your own machine (no cloud providers, no API keys)
- ✅ Region Extraction - Zoom into plateaus, edges, and transients with calibration guidance
- ✅ Multiple Formats - Generate PDF and Markdown reports with embedded plots
- ✅ Professional Layout - Publication-ready reports with metadata, statistics tables, and visualizations
- ✅ Comparison & Batch Reports - Compare before/after captures or aggregate multi-DUT batches with delta/yield tables, a sign-off block, and a SHA-256 raw-data manifest; available via
Report → Comparison / Batch Report…in the GUI
Report Sections Include:
- Test metadata (title, ID, operator, timestamp, scope model)
- Waveform plots with automatic scaling
- Signal classification and characteristics
- Detailed measurement tables
- Region-of-interest analysis with zoomed views
- AI-generated insights and recommendations (optional)
- Pass/fail criteria and test conclusions
See examples/probe_calibration_analysis.py for complete examples including region extraction and automated probe compensation guidance.
Vector Graphics / XY Mode (Fun! 🎨)
Use your oscilloscope as a vector display by generating waveforms for XY mode:
- Draw Shapes: Circles, rectangles, stars, polygons, Lissajous figures
- Text Rendering: Display text messages on your oscilloscope screen
- Animations: Create rotating and transforming graphics
- Composite Paths: Combine multiple shapes into complex drawings
Requirements: External AWG/DAC or scope's built-in AWG to feed generated waveforms into scope channels.
# Install the fun extras
# pip install "SCPI-Instrument-Control[fun]"

from scpi_control import Oscilloscope
from scpi_control.vector_graphics import Shape

scope = Oscilloscope('192.168.1.100')
scope.connect()

# Enable XY mode (CH1=X, CH2=Y)
scope.vector_display.enable_xy_mode()

# Generate waveforms for a circle
circle = Shape.circle(radius=0.8, points=1000)
x_wave, y_wave = scope.vector_display.draw(circle)

# Save for AWG upload
scope.vector_display.save_waveforms(circle, "my_circle", format='csv')
# Load my_circle_x.csv and my_circle_y.csv into your AWG!
See examples/vector_graphics_xy_mode.py for more demos including animations and text!
Installation
From PyPI (recommended)
pip install SCPI-Instrument-Control
To include optional features, use extras:
# GUI application with PyQt6
pip install "SCPI-Instrument-Control[gui]"

# Automated report generation (PDF/Markdown with AI analysis)
pip install "SCPI-Instrument-Control[report-generator]"

# Vector graphics and XY mode (draw shapes on scope!)
pip install "SCPI-Instrument-Control[fun]"

# Browser-based lab gateway (scpi-web)
pip install "SCPI-Instrument-Control[web]"

# USB/GPIB/serial instruments via PyVISA
pip install "SCPI-Instrument-Control[usb]"

# Everything
pip install "SCPI-Instrument-Control[all]"
Note: The siglent-gui command includes automatic dependency checking. If you try to run the GUI without the required packages, you'll receive a clear error message with installation instructions. Missing optional dependencies (like PyQtGraph for high-performance live view) will trigger warnings but allow the GUI to launch.
Command-line tools
| Command | Description |
|---|---|
siglent-gui |
Launch the PyQt6 GUI application |
siglent-report-generator |
Launch the standalone report-generator app |
scpi-web |
Serve the browser-based lab gateway (REST + WebSocket API, optional web UI) |
scpi-extract |
Inspect or export a saved waveform file from the command line |
From source
git clone git@github.com:little-did-I-know/SCPI-Instrument-Control.git
cd SCPI-Instrument-Control
pip install -e .
Install with GUI support from source:
pip install -e ".[gui]"
Development installation
pip install -e ".[dev]"
Build & Publish (PyPI)
To create release artifacts that render correctly on PyPI:
python -m build
twine check dist/*
The twine check command validates the built distributions, including the long description rendered from README.md, before upload.
Migration Guide
v1.0.0 introduces a package rename from Siglent-Oscilloscope to SCPI-Instrument-Control to better reflect the expanded capabilities of this library.
For Existing Users
If you're upgrading from the old siglent package:
1. Update Your Installation
Uninstall the old package (if installed):
pip uninstall siglent
Install the new package:
pip install SCPI-Instrument-Control
Or with extras:
pip install "SCPI-Instrument-Control[gui]"
pip install "SCPI-Instrument-Control[all]"
2. Update Your Import Statements
Old imports (no longer work as of v2.0.0):
from siglent import Oscilloscope, PowerSupply, FunctionGenerator
from siglent.gui.app import main
from siglent.waveform import Waveform
New imports (recommended):
from scpi_control import Oscilloscope, PowerSupply, FunctionGenerator
from scpi_control.gui.app import main
from scpi_control.waveform import Waveform
3. Backward Compatibility
The siglent compatibility shim was removed in v2.0.0 (it had emitted a
DeprecationWarning since v1.0.0). import siglent now raises
ModuleNotFoundError — update your imports to scpi_control as shown above;
the API is otherwise identical. If you cannot migrate yet, pin
SCPI-Instrument-Control<2.0.
4. Command-Line Tools
The CLI commands remain unchanged for convenience:
siglent-gui                    # Still works!
siglent-report-generator       # Still works!
No changes needed to scripts or automation that invoke these commands.
5. What Changed
| Old | New | Status |
|---|---|---|
PyPI package: siglent |
PyPI package: SCPI-Instrument-Control |
Changed |
import siglent |
import scpi_control |
Required since v2.0.0 |
siglent-gui command |
siglent-gui command |
Unchanged |
siglent-report-generator command |
siglent-report-generator command |
Unchanged |
6. Why the Rename?
This library has grown significantly beyond its original focus on Siglent oscilloscopes:
- Multi-Instrument Support: Oscilloscopes, power supplies, and function generators
- Multi-Vendor Support: Works with any SCPI-compatible equipment (not just Siglent)
- Universal Protocol: Based on industry-standard SCPI commands
The new name better represents what the library does: control any SCPI-compatible test equipment.
Need Help?
If you encounter any migration issues:
- Check the CHANGELOG.md for detailed v1.0.0 release notes
- Open an issue on GitHub
- Review the updated examples/ directory for new usage patterns
Quick Start
Programmatic Usage
from scpi_control import Oscilloscope

# Connect to oscilloscope
scope = Oscilloscope('192.168.1.100')
scope.connect()

# Get device information
print(scope.identify())

# Configure channel 1
scope.channel1.set_scale(1.0)  # 1V/div
scope.channel1.set_coupling('DC')
scope.channel1.enable()

# Capture waveform
waveform = scope.get_waveform(channel=1)
print(f"Captured {len(waveform.time)} samples")

scope.disconnect()
GUI Application
siglent-gui
Or from Python:
from scpi_control.gui.app import main
main()
Requirements
Core Library
- Python 3.9+
- NumPy >= 1.24.0
- Matplotlib >= 3.7.0
- SciPy >= 1.10.0
GUI Application (optional)
Install with [gui] extra to add:
- PyQt6 >= 6.6.0
- PyQt6-WebEngine >= 6.6.0
- PyQtGraph >= 0.13.0 (high-performance plotting)
Optional Extras
- Report Generator: Install with
[report-generator]to add PyQt6, Pillow, requests, ReportLab, Ollama (PDF/Markdown reports with AI) - HDF5 support: Install with
[hdf5]to add h5py >= 3.8.0 - Vector Graphics: Install with
[fun]to add shapely, Pillow, svgpathtools (XY mode drawing) - Web Gateway: Install with
[web]to add FastAPI, Uvicorn, Pillow (browser-based lab gateway,scpi-web) - USB/GPIB/Serial: Install with
[usb]to add PyVISA + pyvisa-py (USB-TMC, GPIB, and serial instrument connections) - All features: Install with
[all]for complete functionality
Connection
The oscilloscope must be connected to your network. The default SCPI port is 5025.
To find your oscilloscope's IP address:
- Press Utility on the oscilloscope
- Navigate to I/O settings
- Check the LAN configuration
GUI Application Overview
The SCPI Instrument Control GUI provides a comprehensive interface for controlling your oscilloscope, capturing waveforms, and performing measurements.
Main Window
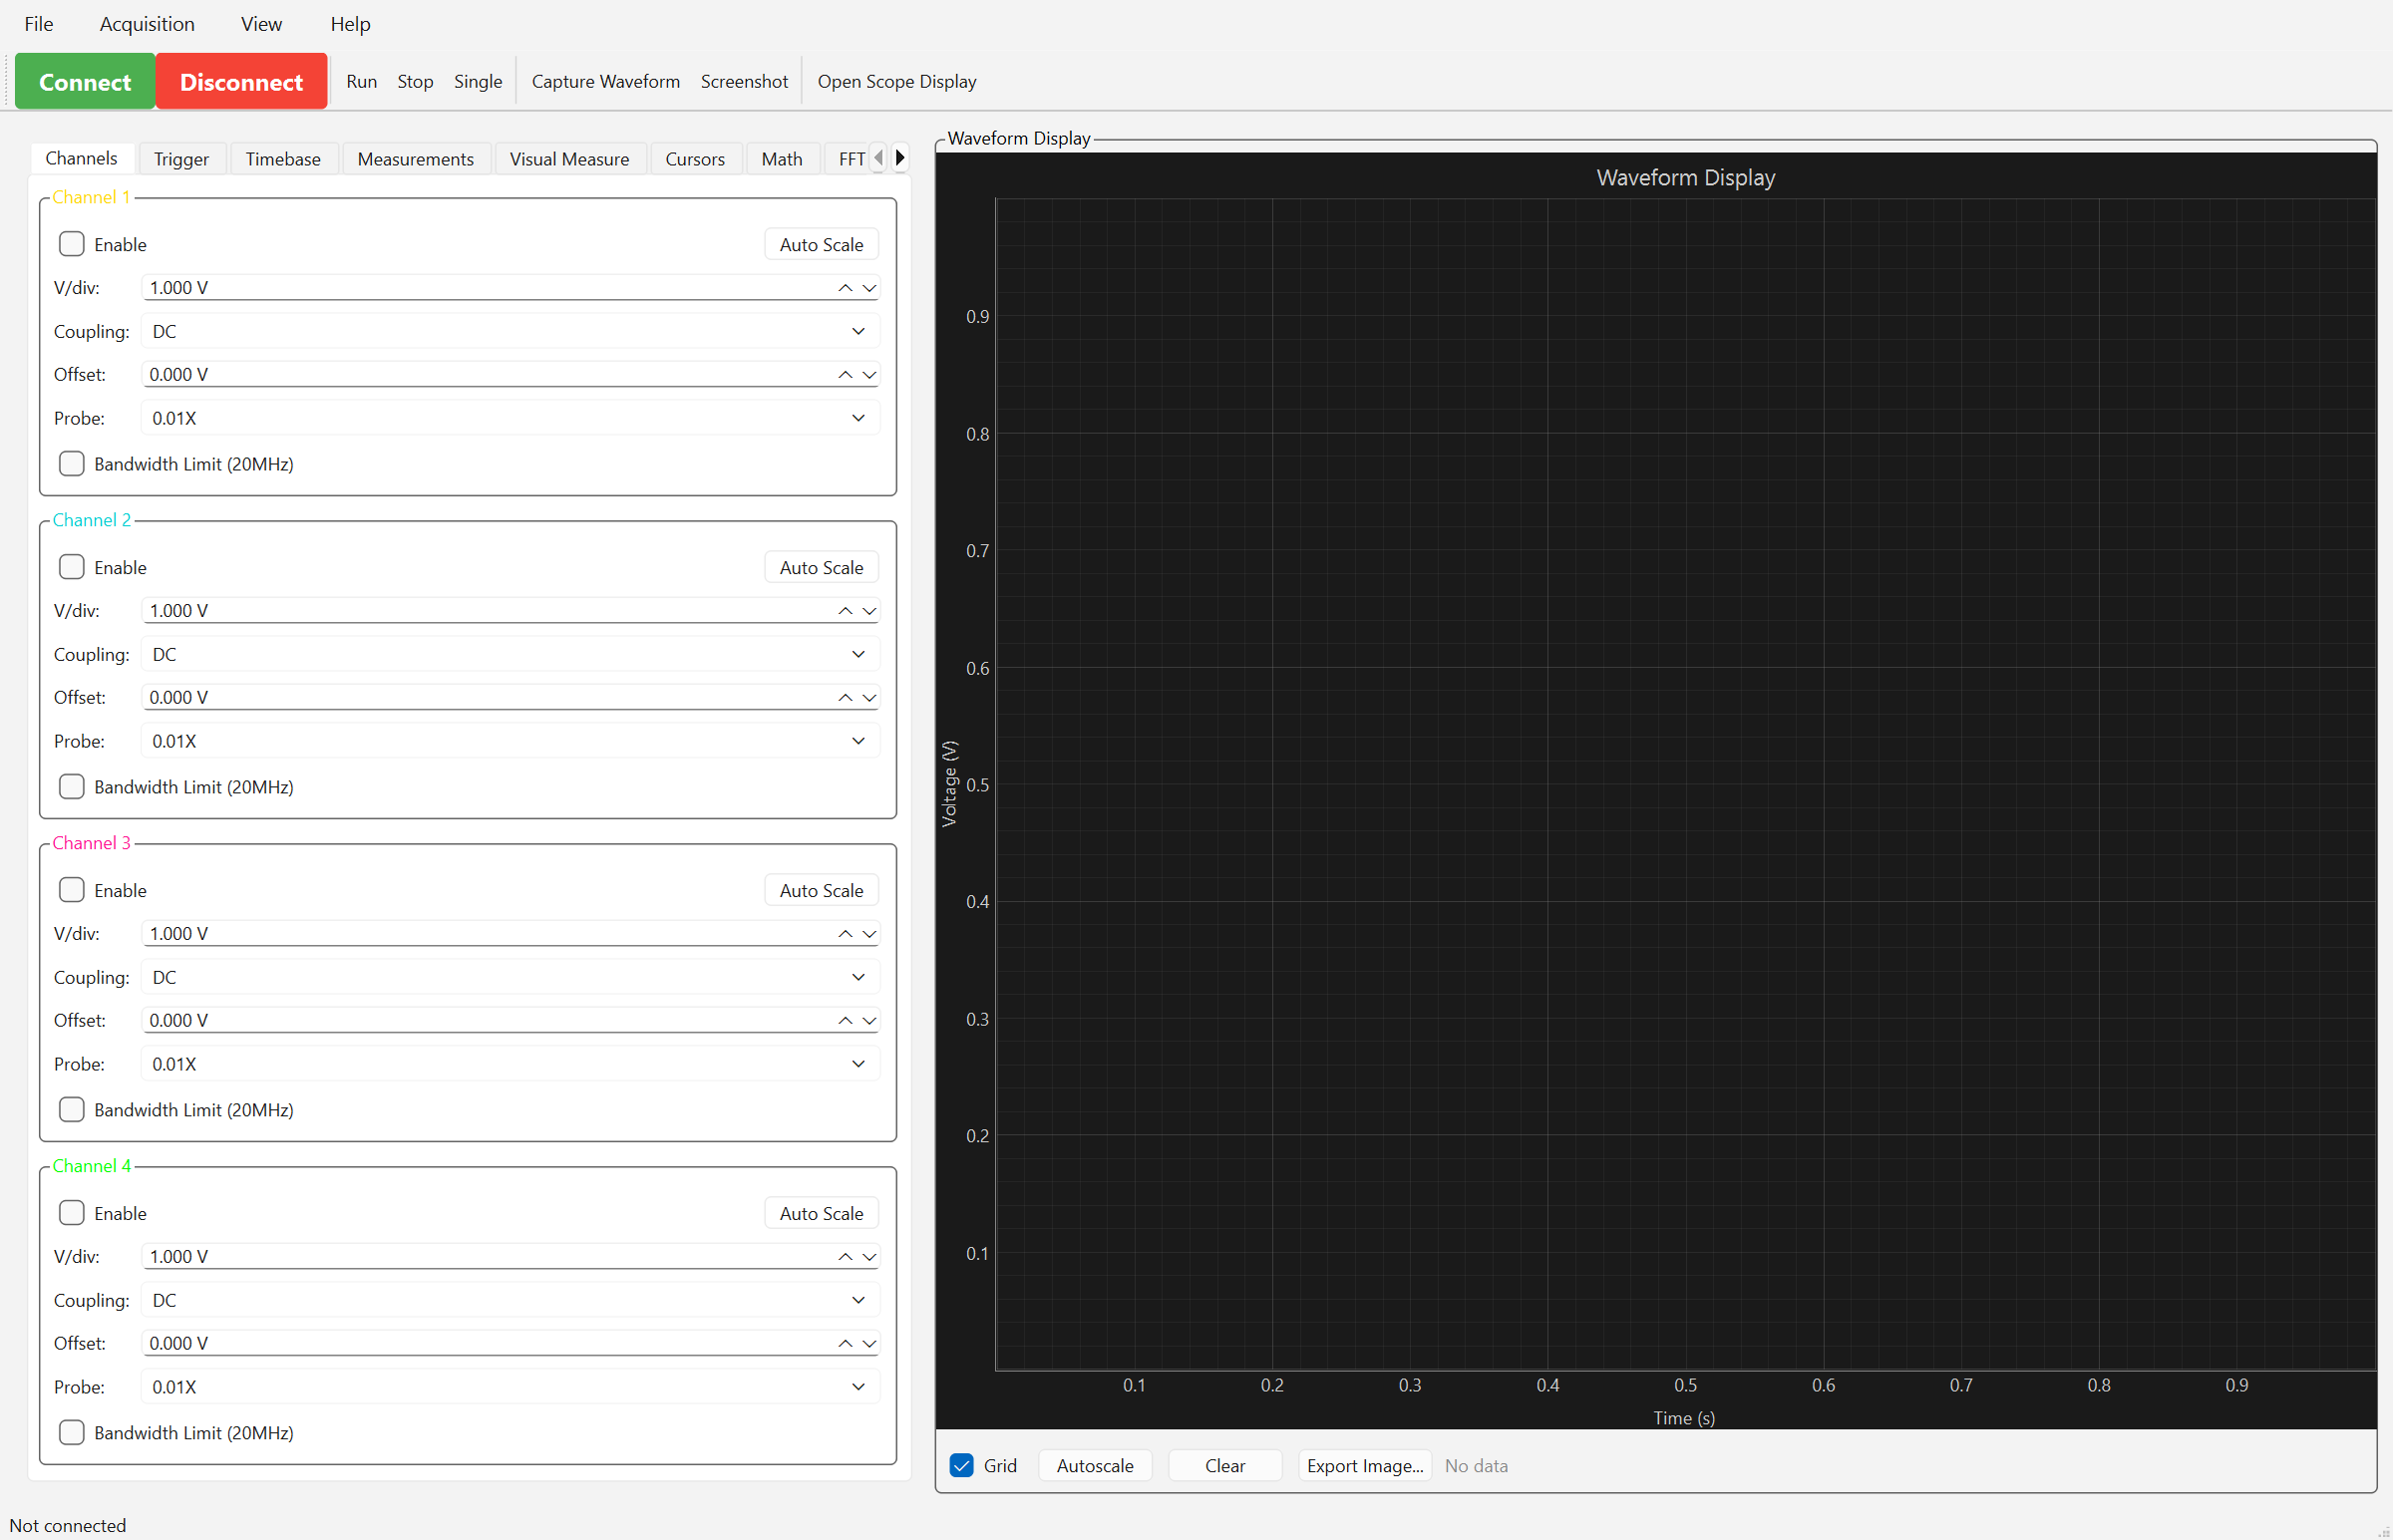
The main interface consists of:
- Waveform Display: High-performance real-time plotting area (center)
- Control Panels: Tabbed interface with all oscilloscope controls (right)
- Menu Bar: File operations, acquisition controls, and utilities (top)
- Status Bar: Connection status and system information (bottom)
Getting Connected
To connect to your oscilloscope:
- Launch the GUI:
siglent-gui - Enter your oscilloscope's IP address
- Click Connect
The oscilloscope must be connected to your network (default SCPI port: 5025).
Finding your oscilloscope's IP address:
- Press Utility on the oscilloscope
- Navigate to I/O settings
- Check the LAN configuration
Channel Controls
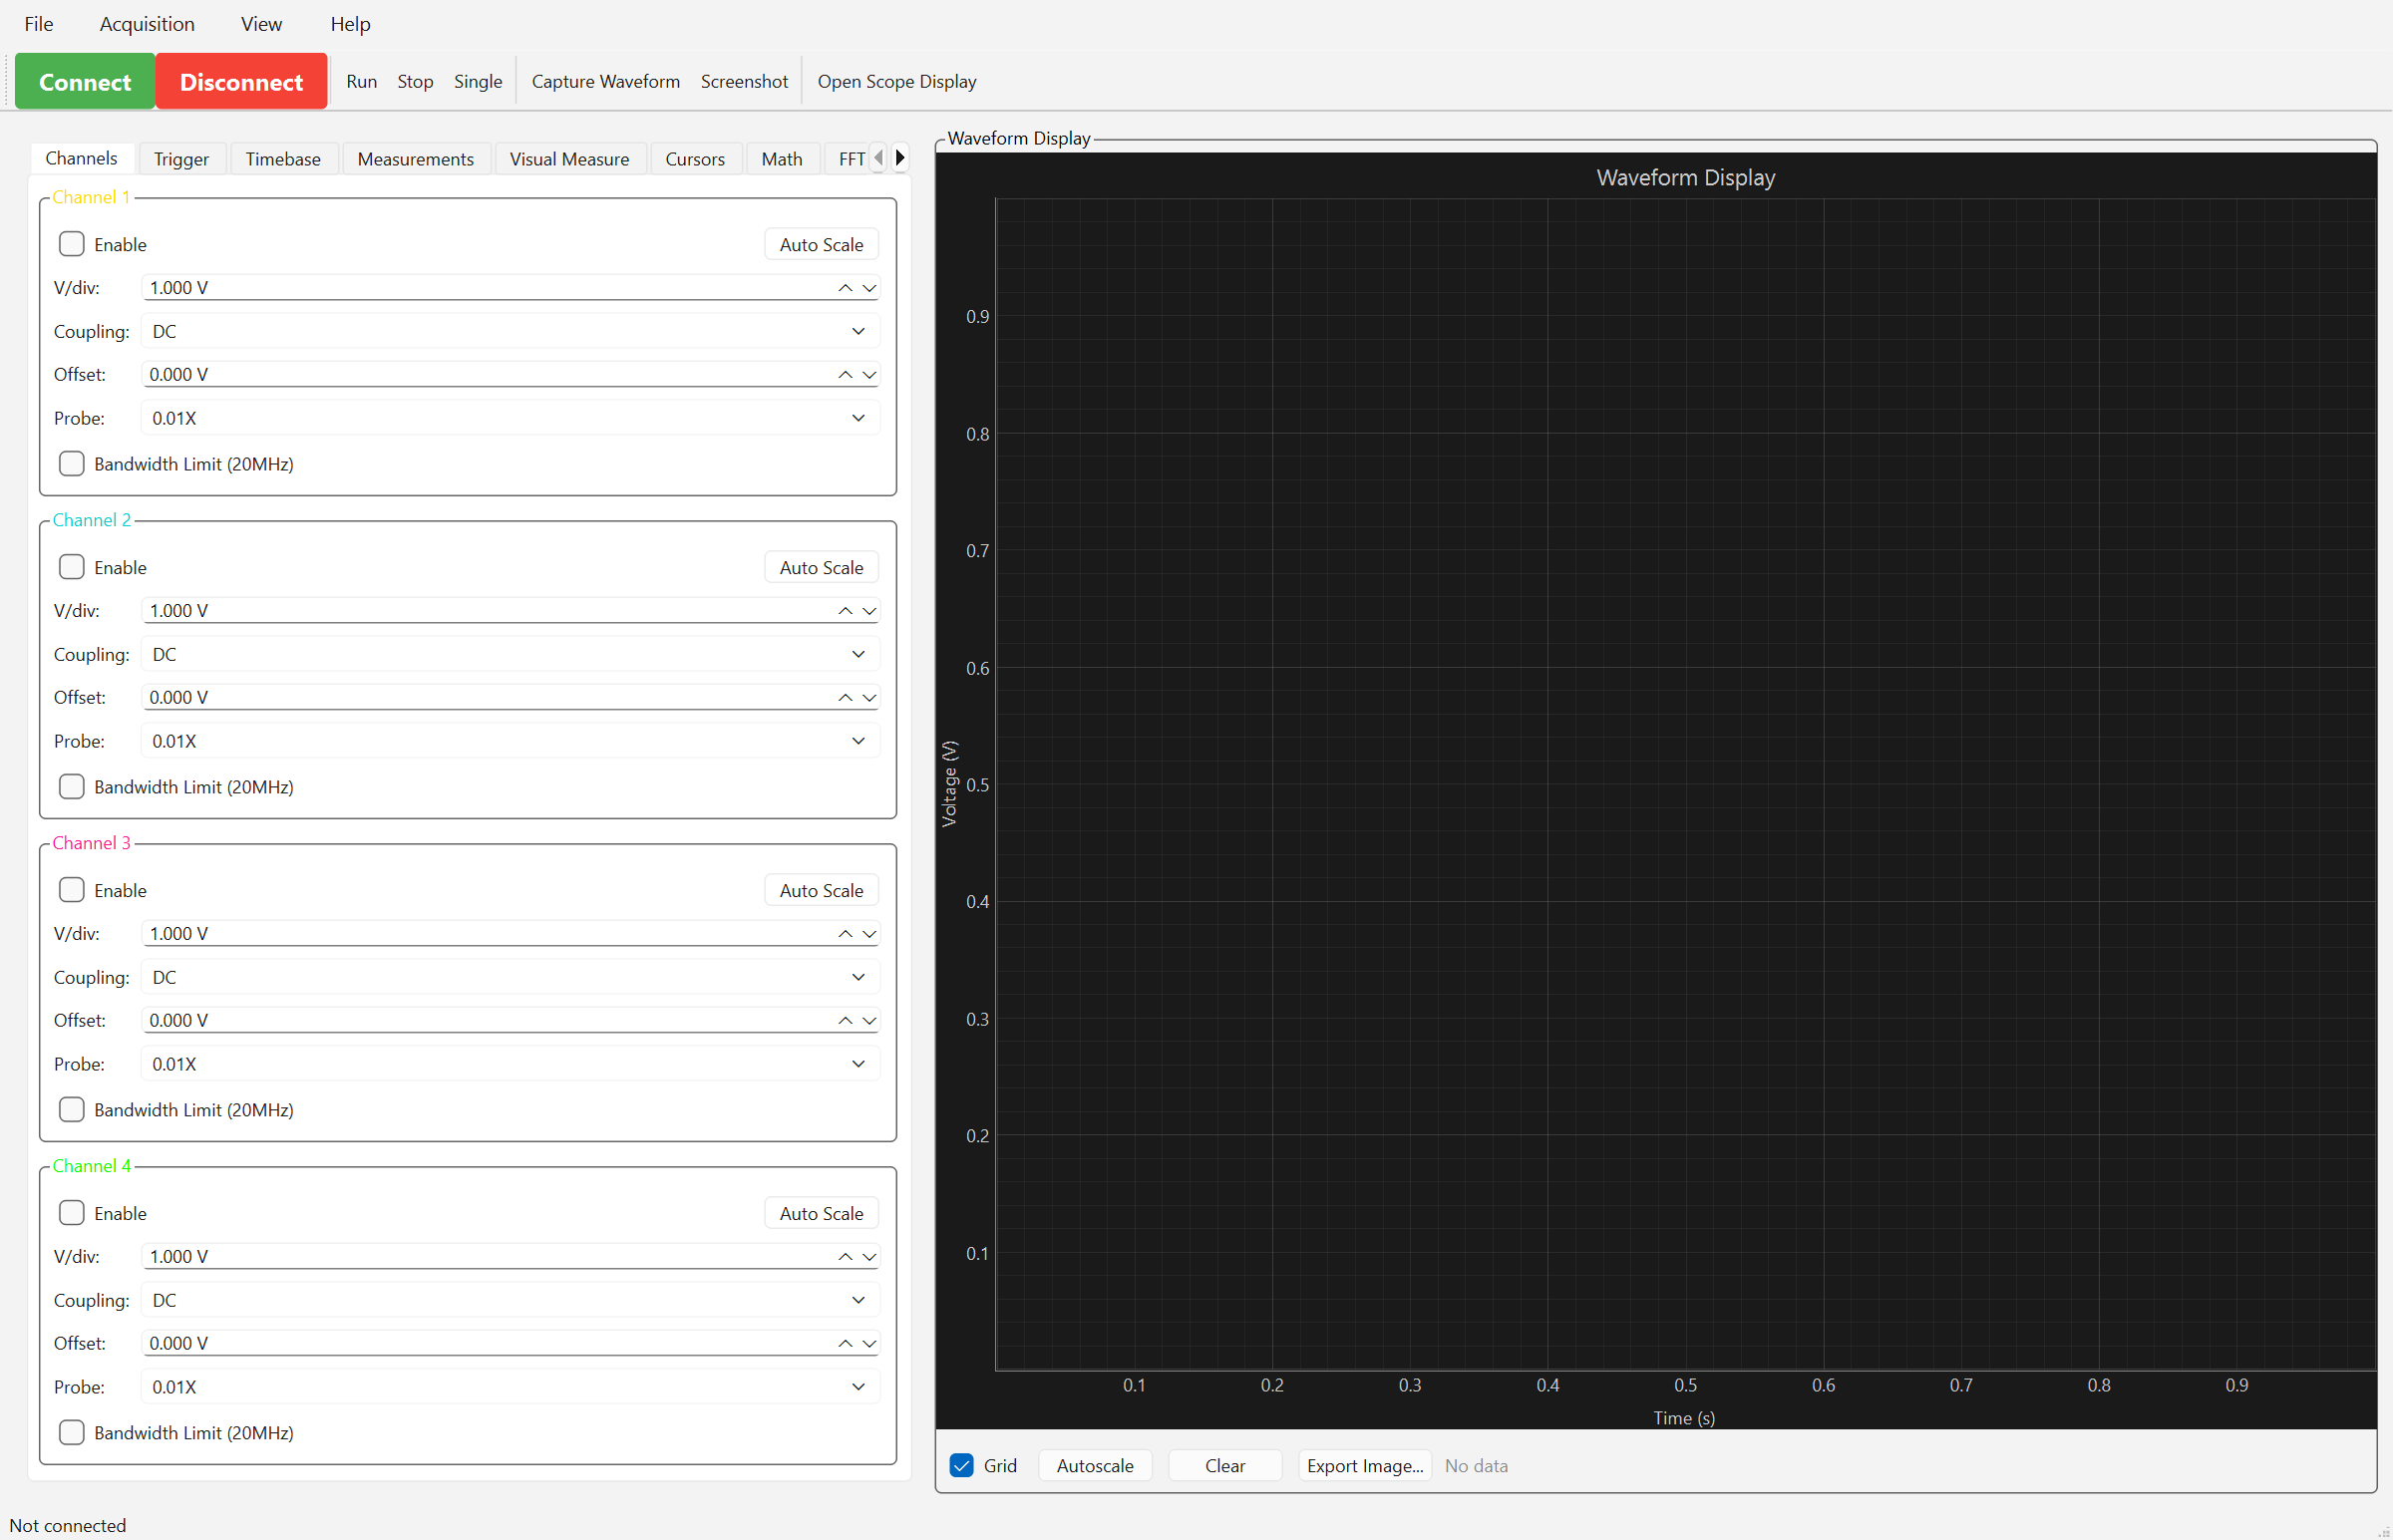
The Channels tab provides complete control over all input channels:
- Enable/Disable: Toggle channels on/off with checkboxes
- Voltage Scale: Adjust volts/division (0.001V to 10V)
- Coupling: Set DC, AC, or GND coupling
- Probe Ratio: Configure probe attenuation (1X, 10X, 100X, etc.)
- Bandwidth Limit: Enable 20MHz bandwidth limiting
- Offset: Adjust vertical position
Quick Tip: Enable channels before starting Live View or capturing waveforms.
GUI Application Guide
Live View
The GUI features high-performance real-time waveform viewing powered by PyQtGraph:
Acquisition → Live View (Ctrl+R)
Performance:
- Real-time updates at 5-20 fps (configurable)
- 100x faster than traditional matplotlib-based viewers
- Non-blocking: GUI remains responsive during data acquisition
- Supports all 4 channels simultaneously
Controls:
- Enable channels in the "Channels" tab first
- Live view automatically acquires from enabled channels
- Adjust update rate by modifying
update_intervalinlive_view_worker.py
Visual Measurements
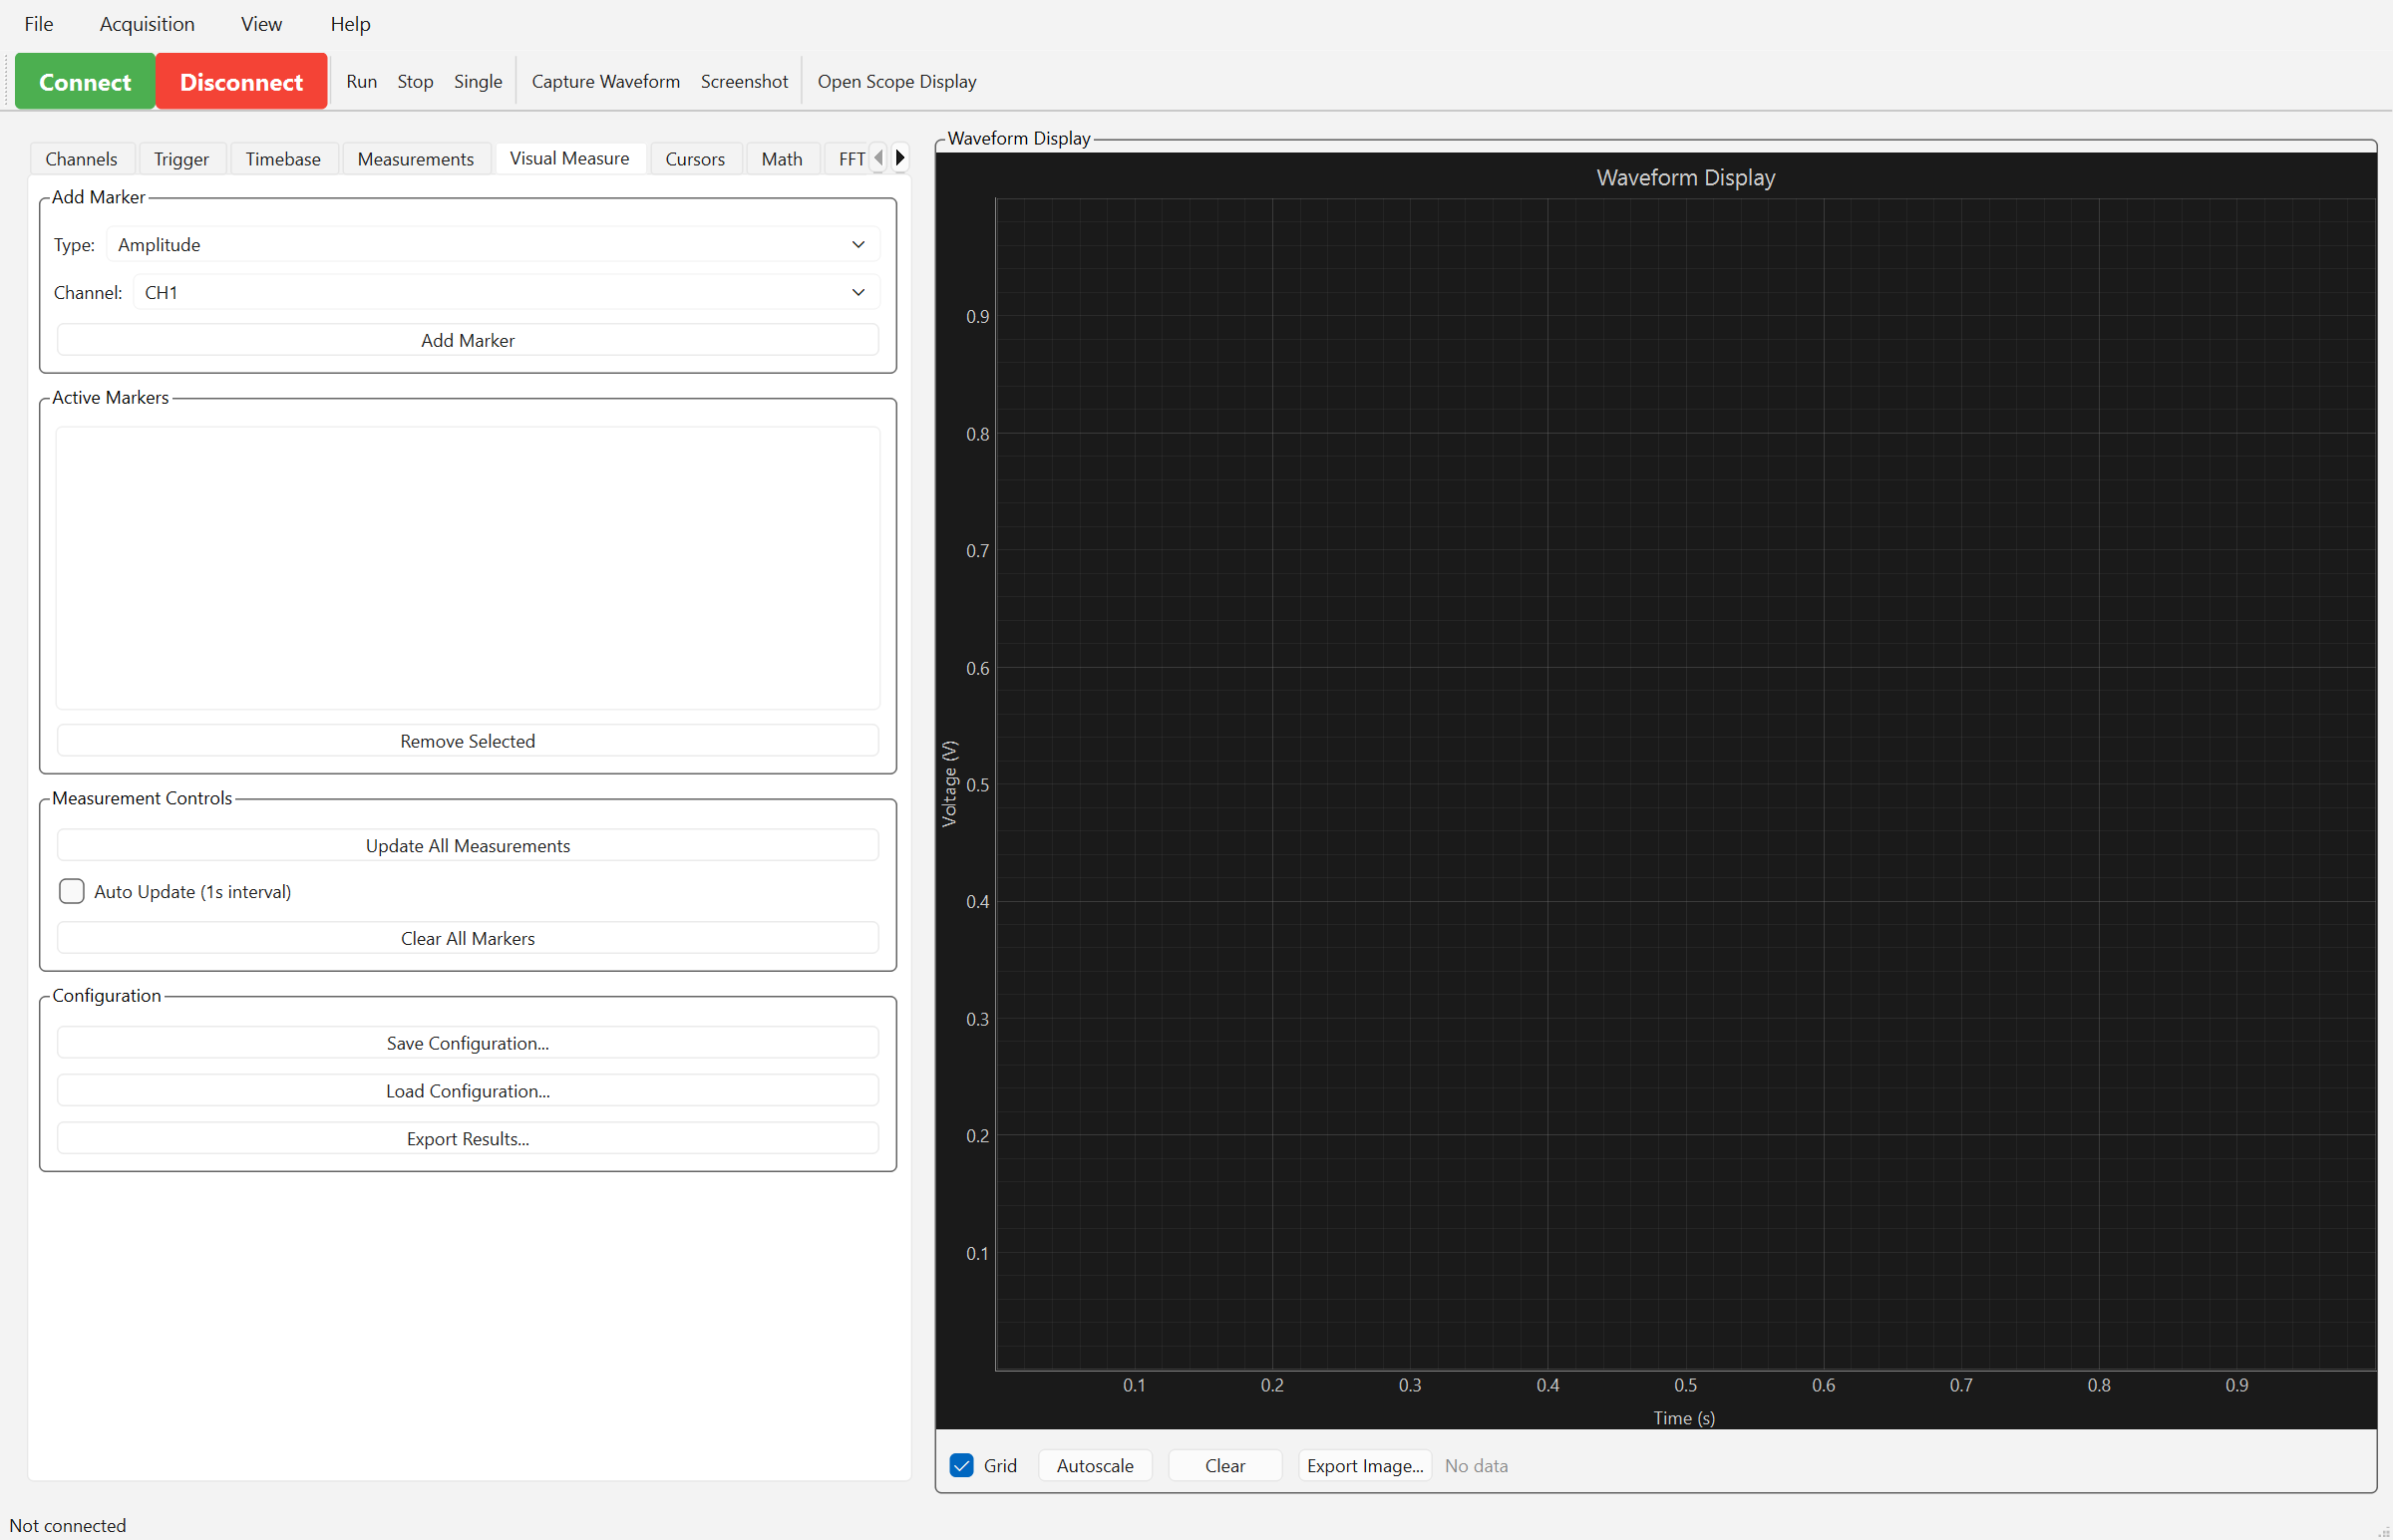
Interactive measurement markers that you can place and adjust directly on waveforms:
How to use:
- Go to the "Visual Measure" tab
- Select measurement type (Frequency, Vpp, Rise Time, etc.)
- Select channel (CH1-CH4)
- Click "Add Marker"
- Marker auto-places on waveform
- Drag marker gates to adjust measurement region
- See real-time measurement updates
Measurement Types:
- Frequency/Period: Auto-detects signal period
- Voltage: Vpp, Amplitude, Max, Min, RMS, Mean
- Timing: Rise Time, Fall Time, Pulse Width, Duty Cycle
Features:
- Save/Load Configs: Save measurement setups for reuse
- Export Results: Export to CSV or JSON
- Auto-Update: Optional 1-second auto-refresh
- Batch Mode: Run multiple measurements simultaneously
Example Workflow:
# In GUI:
# 1. Capture or enable live view
# 2. Visual Measure tab → Add Marker
# 3. Type: "Frequency", Channel: "CH1" → Add
# 4. Marker appears with measurement result
# 5. Save Config → "my_measurements.json"
# 6. Export Results → "results.csv"
Automated Measurements
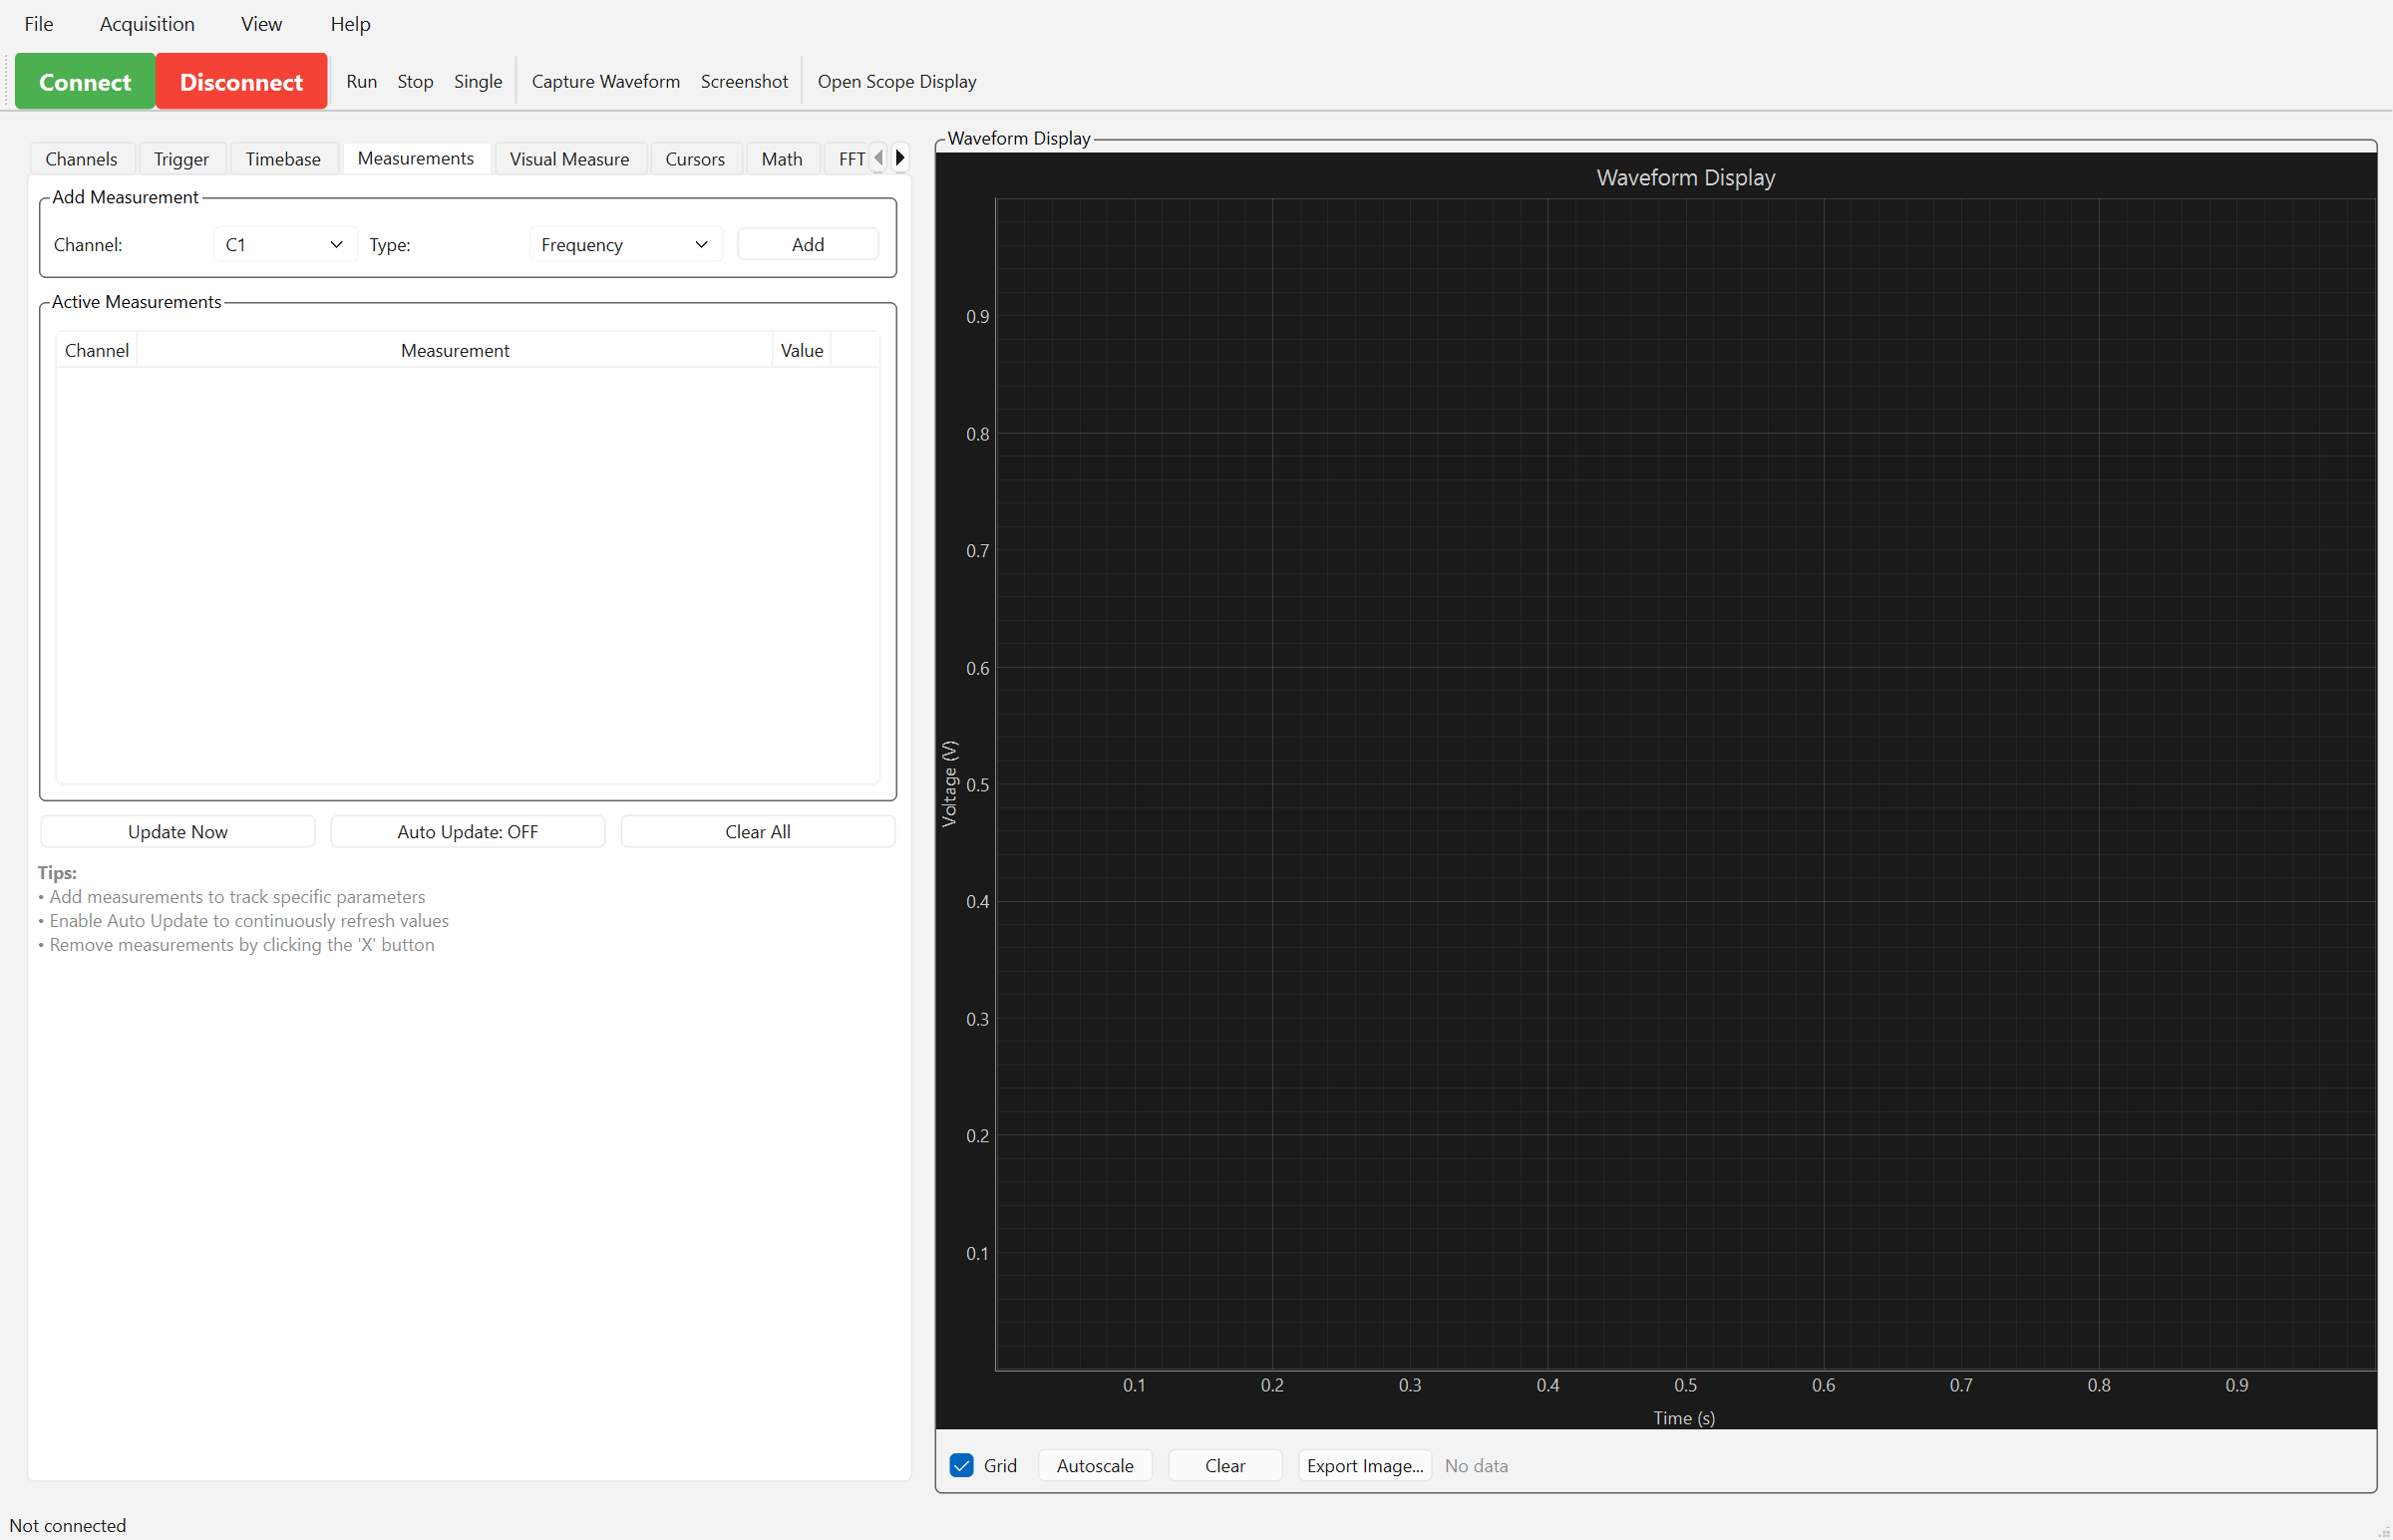
The Measurements tab provides quick access to standard oscilloscope measurements:
- 15+ measurement types (frequency, Vpp, RMS, rise time, etc.)
- Channel selection
- Results table with units
- Export measurement results
Cursors
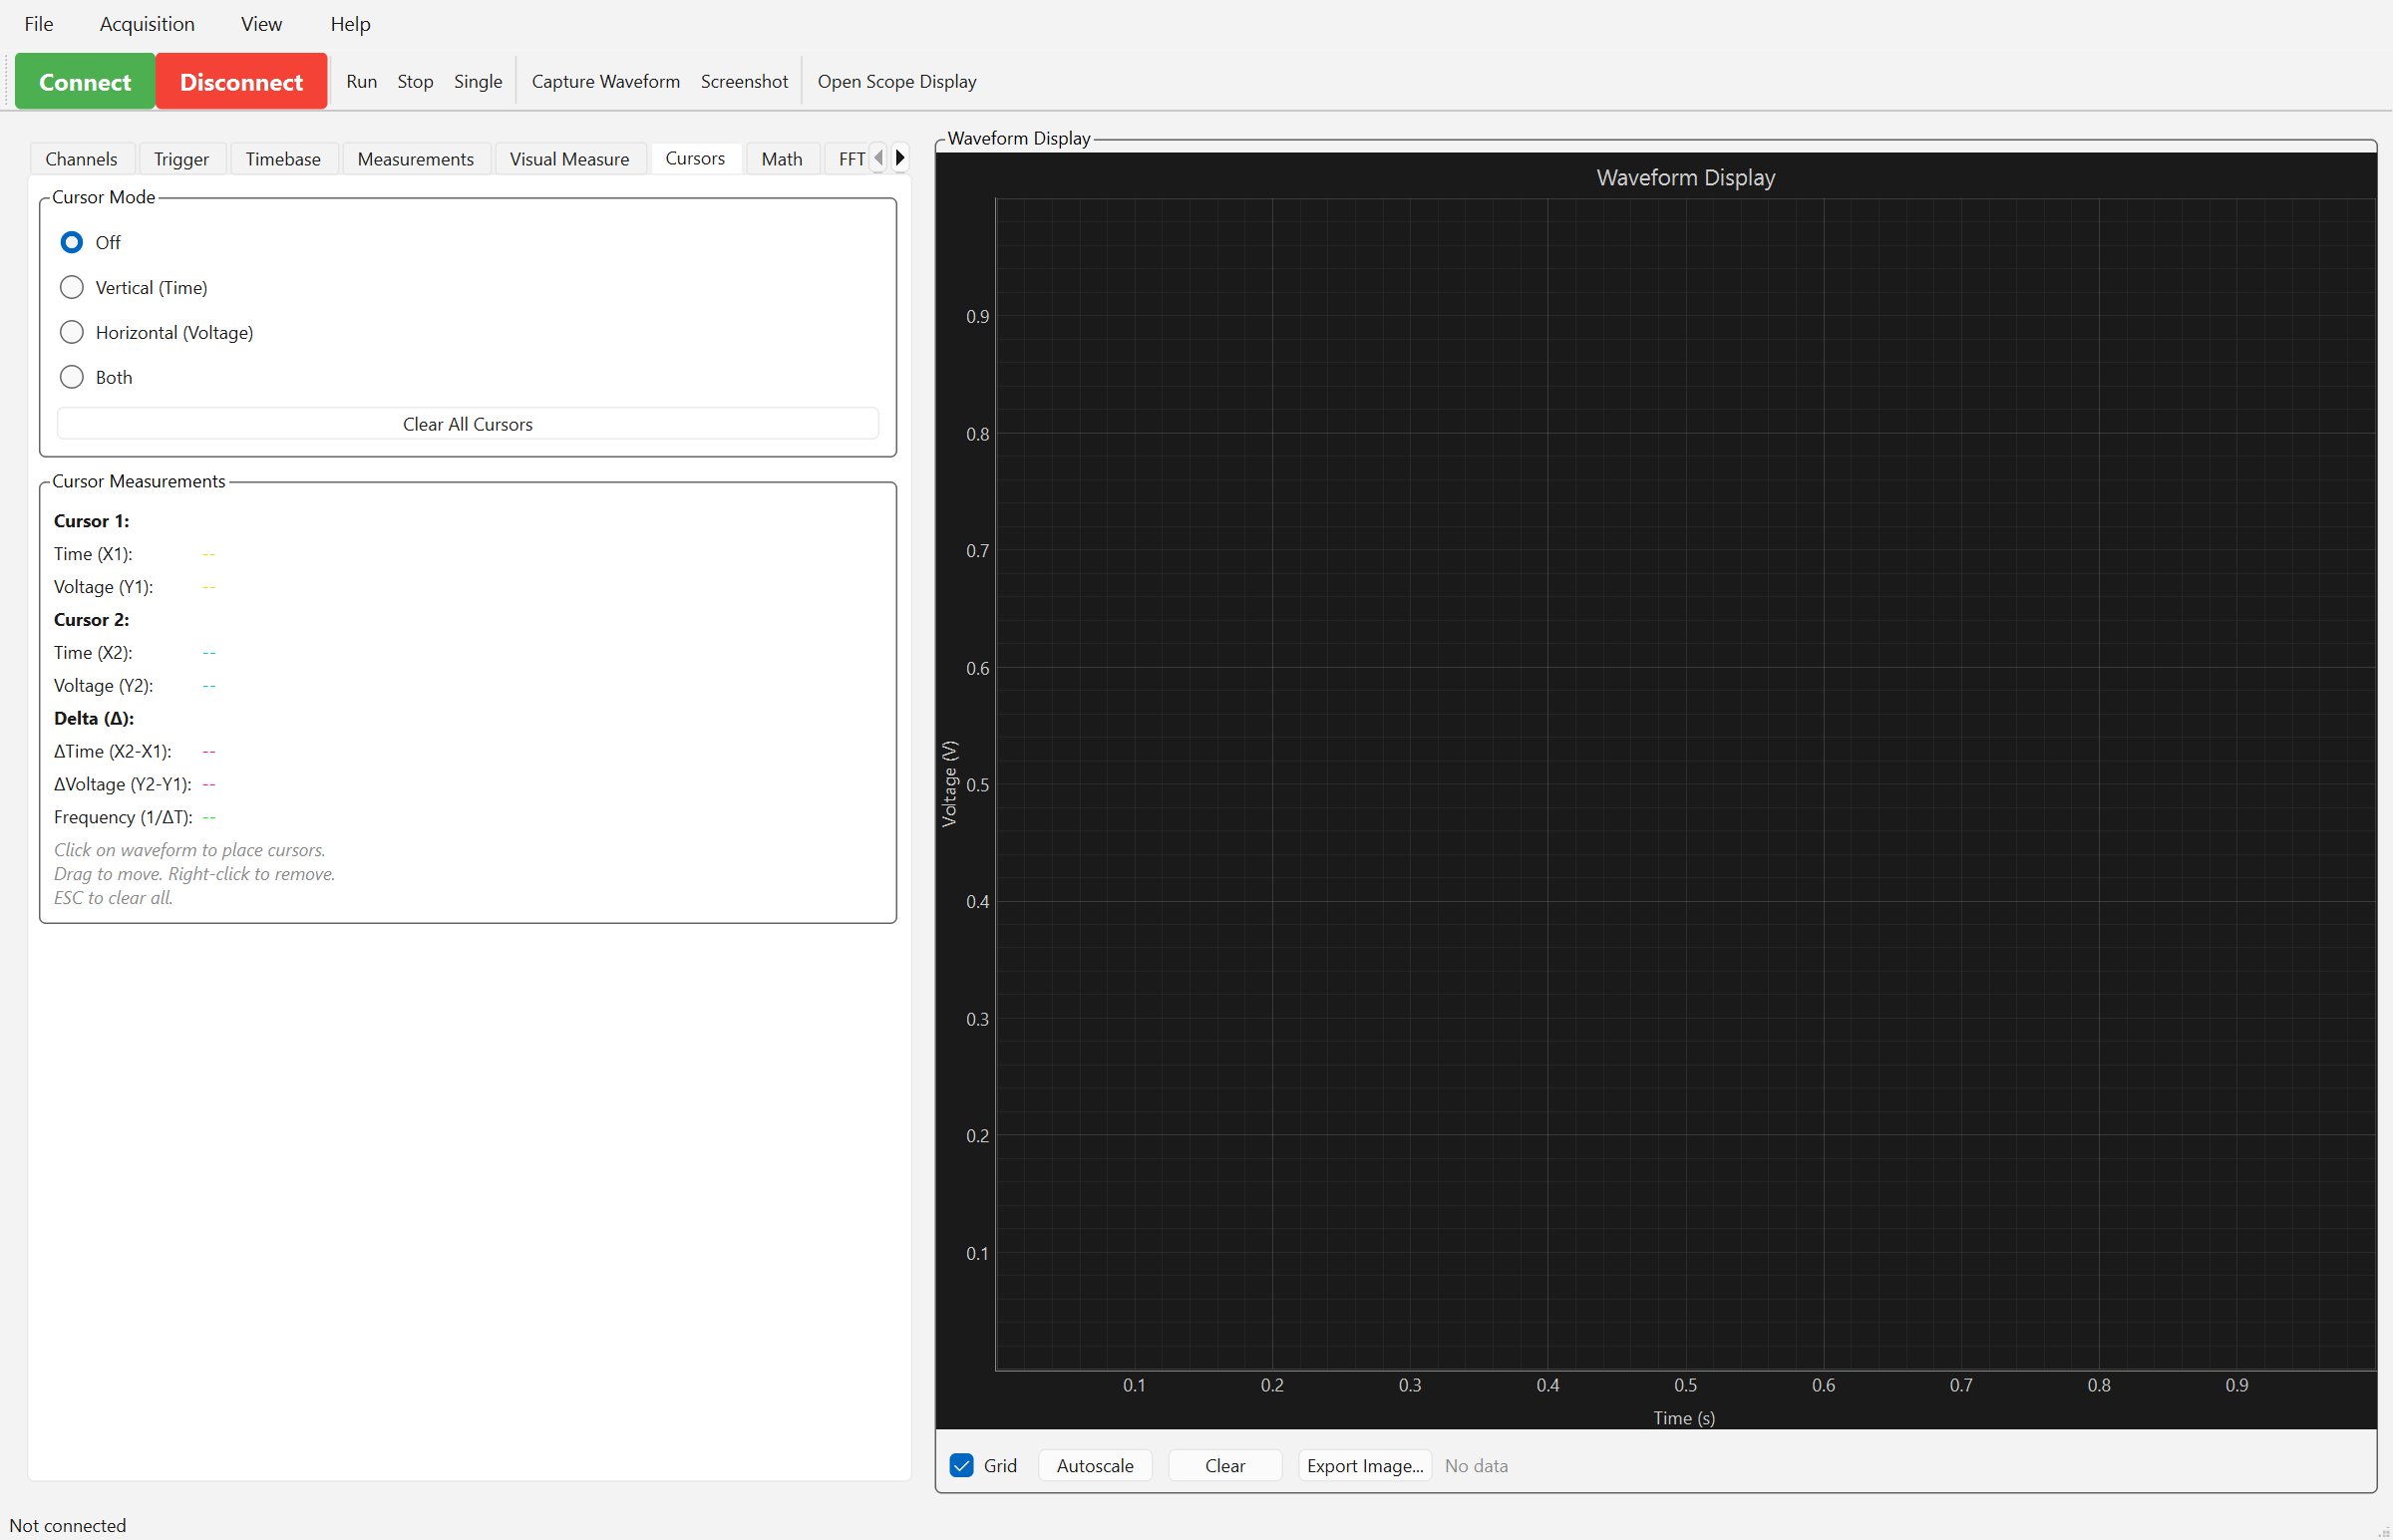
Interactive cursors for precise measurements:
- Vertical cursors for time measurements
- Horizontal cursors for voltage measurements
- Delta calculations (ΔT, ΔV, frequency)
- Draggable cursor lines
- Real-time delta updates
FFT Analysis
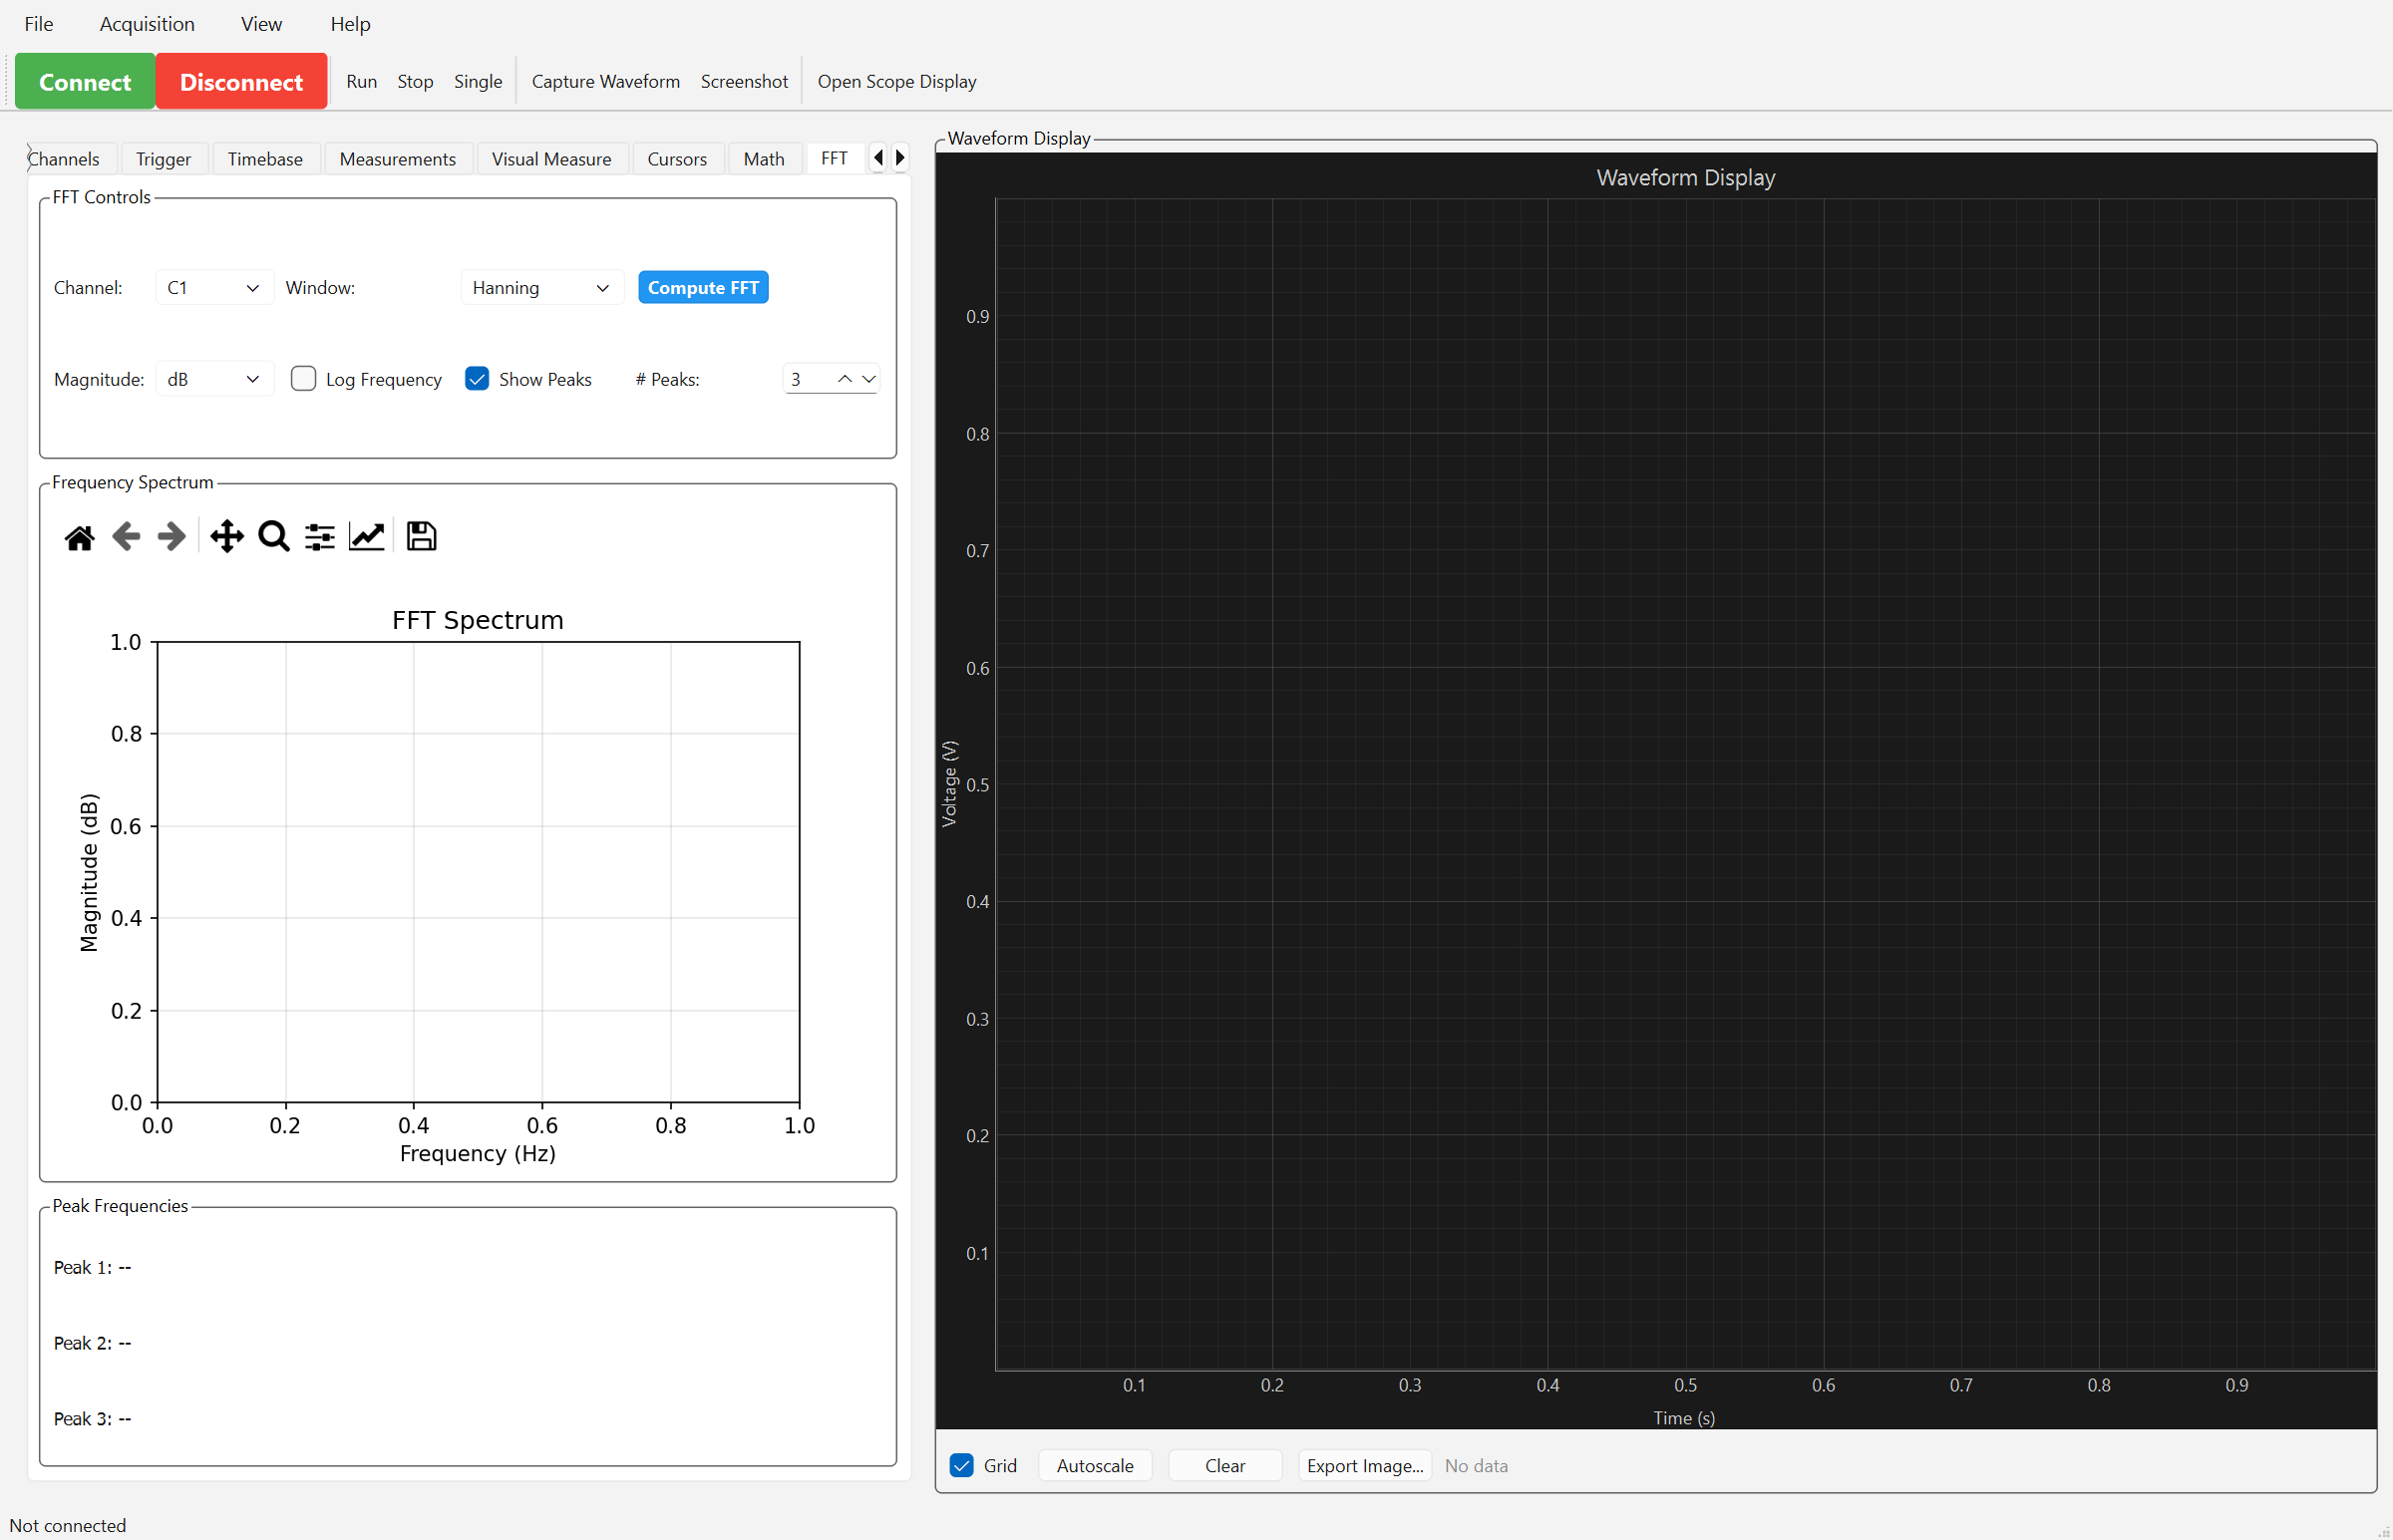
Frequency domain analysis:
- Fast Fourier Transform visualization
- Peak detection and markers
- Window function selection (Hanning, Hamming, Blackman)
- Frequency and amplitude axes
- Export FFT data
Vector Graphics 🎨 (XY Mode)
Requires:
pip install "SCPI-Instrument-Control[fun]"
Turn your oscilloscope into a vector display by generating waveforms for XY mode!
The Vector Graphics tab provides:
Shape Generator:
- Basic Shapes: Circle, Rectangle, Star, Triangle, Line
- Lissajous Figures: Classic oscilloscope patterns (3:2, 5:4, 7:5, etc.)
- Parameter Controls: Adjust size, points, frequency ratios, phase shifts
- Generate Button: Create vector paths with customizable parameters
Waveform Export:
- Sample Rate Control: 1-1000 MSa/s for AWG compatibility
- Duration: 1ms to 10s per waveform
- Format Options: CSV (universal), NumPy (.npy), Binary (.bin)
- Save for AWG: Exports separate X and Y waveform files
XY Mode Control:
- Enable/Disable: Configure oscilloscope for XY display mode
- Channel Setup: Auto-configures CH1 (X-axis) and CH2 (Y-axis)
- Status Display: Connection and configuration feedback
How to use:
- Go to the "Vector Graphics 🎨" tab
- Select a shape (e.g., "Circle" or "Lissajous")
- Adjust parameters (radius, points, frequencies)
- Click "Generate Shape"
- Set sample rate and duration for your AWG
- Click "Save Waveforms..." to export
- Load the X/Y files into your AWG (Channel 1 = X, Channel 2 = Y)
- Connect AWG outputs to scope inputs
- Click "Enable XY Mode" or manually enable on scope
- Watch your shape appear on the oscilloscope! ✨
Works without scope connection - you can generate and export waveforms offline!
Example Use Cases:
- Draw circles, stars, and geometric shapes
- Create classic Lissajous patterns for calibration
- Generate animations (rotating shapes, morphing patterns)
- Educational demonstrations of XY mode
- Signal generator pattern testing
See examples/vector_graphics_xy_mode.py for programmatic usage and animation examples.
Other GUI Features
Power Supply:
- Dedicated Power Supply tab (
Connect to Power Supply...menu action) for Siglent SPD-series and generic SCPI-99 power supplies - Per-channel voltage/current setpoints, output enable, and readback
Data Logger:
- Dedicated Data Logger tab (
Connect to Data Logger...menu action) for SCPI DAQ/data-acquisition units - Channel scan configuration and readings display
Terminal:
- Built-in Terminal tab for sending raw SCPI commands directly to the connected instrument
Reference Waveforms:
- Save waveforms as references
- Overlay comparisons
- Difference mode (live - reference)
- Calculate correlation
Math Channels:
- Custom expressions:
C1 + C2,C1 * 2, etc. - Real-time calculation
FFT Analysis:
- Frequency domain visualization
- Window function selection
- Peak detection
Protocol Decode:
- I2C, SPI, UART, CAN, LIN decoding
- Packet analysis and export
Web Gateway (beta)
Control instruments from any browser on your LAN:
pip install scpi-instrument-control[web]   # includes the browser gateway
scpi-web                                   # first run prints a URL with a token
On first run the gateway mints an access token and prints a ready-to-open URL
(http://127.0.0.1:8765/?token=…). Every request needs a token — mint more
with scpi-web token add <name>. Sessions can target real scopes by IP or a
built-in mock (mock: true) for hardware-free use. The OpenAPI schema is served
at /api/openapi.json (token required); the interactive /docs//redoc UIs are
disabled. Bind to 127.0.0.1 (the default) unless your LAN is trusted, and use
--host 0.0.0.0 to expose it.
Security model: the gateway authenticates every request, gives each instrument session an owner (owner writes, everyone else watches), validates outbound connection targets, and caps concurrent sessions. It does not terminate TLS — put it behind a reverse proxy or keep it on a trusted network. See the Gateway security guide for tokens, ownership, claiming, the SSRF gate, and deployment.
Upgrading from 4.x: the gateway now requires a token, and reference files saved by 4.x must be converted once with
scpi-web references migrate. Both are covered in the security guide.
Full documentation: Web Gateway guide — overview, browser UI tour, and the complete REST & WebSocket API reference.
GET /api/discoverscans the gateway's subnet (or?cidr=…) for SCPI instruments on port 5025 and lists them with model and dialect — handy when DHCP moves your instruments around.GET .../scope/screenshot.png— the instrument's display as a PNGGET .../scope/waveform?channels=1,2&max_points=N— waveform data as JSONGET/PATCH .../scope/math/{1,2}— software math channels (streamed as M1/M2 traces)GET .../scope/measurements— the current measurement selectionGET/PATCH .../scope/spectrum— server-computed FFT spectrum (streamed asspectrumframes)GET .../scope/filters+PATCH .../scope/filters/{1,2}— software Butterworth filters (streamed as F1/F2 traces)GET/POST/DELETE .../scope/references+GET/PUT .../scope/reference— saved reference waveforms and the live overlayPOST .../scope/log/start/POST .../scope/log/stop— record the selected measurements (~1 Hz) server-sideGET .../scope/log,GET .../scope/log/data?since=,GET .../scope/log.csv— recording status, rows, and CSV export
Browser UI
make webapp-install       # once
make webapp-build         # build the UI into the server
scpi-web --host 0.0.0.0   # serve API + UI on one port
Open the tokened URL the gateway prints on startup. For UI development, run
scpi-web in one terminal and cd webapp/app && npm run dev in another — Vite
proxies /api (HTTP and WebSocket) to the gateway with hot reload; open the dev
server with the ?token=… from the gateway's startup URL so the UI picks it up.
The home screen scans your LAN and lists instruments to connect to, resume, or open a shared session on — plus manual IP and a hardware-free mock.
API Documentation
Oscilloscope
from scpi_control import Oscilloscope

# Connect
scope = Oscilloscope('192.168.1.100', port=5025, timeout=5.0)
scope.connect()

# Device information
print(scope.identify())  # Get *IDN? string
print(scope.device_info)  # Parsed device info dict

# Basic controls
scope.run()           # Start acquisition (AUTO mode)
scope.stop()          # Stop acquisition
scope.auto_setup()    # Auto setup
scope.reset()         # Reset to defaults
Channels
# Channel configuration (channels 1-4)
scope.channel1.enable()
scope.channel1.coupling = "DC"  # DC, AC, or GND
scope.channel1.voltage_scale = 1.0  # Volts/division
scope.channel1.voltage_offset = 0.0  # Volts
scope.channel1.probe_ratio = 10.0  # 10X probe
scope.channel1.bandwidth_limit = "OFF"  # ON or OFF

# Get configuration
config = scope.channel1.get_configuration()
Trigger
# Trigger configuration
scope.trigger.mode = "NORMAL"  # AUTO, NORM, SINGLE, STOP
scope.trigger.source = "C1"  # C1, C2, C3, C4, EX, LINE
scope.trigger.level = 0.0  # Trigger level in volts
scope.trigger.slope = "POS"  # POS (rising) or NEG (falling)

# Edge trigger setup
scope.trigger.set_edge_trigger(source="C1", slope="POS")

# Trigger actions
scope.trigger.single()  # Single trigger
scope.trigger.force()   # Force trigger
Waveform Acquisition
# Acquire waveform
waveform = scope.get_waveform(channel=1)

# Access data
print(waveform.time)      # Time array (numpy)
print(waveform.voltage)   # Voltage array (numpy)
print(waveform.sample_rate)
print(waveform.record_length)

# Save waveform
scope.waveform.save_waveform(waveform, "data.csv", format="CSV")
Measurements
# Individual measurements
freq = scope.measurement.measure_frequency(1)
vpp = scope.measurement.measure_vpp(1)
vrms = scope.measurement.measure_rms(1)
period = scope.measurement.measure_period(1)

# All measurements at once
measurements = scope.measurement.measure_all(1)
Programmatic Data Collection & Automation
For advanced data collection workflows, use the high-level automation API:
from scpi_control.automation import DataCollector

# Simple capture with automatic analysis
with DataCollector('192.168.1.100') as collector:
    # Capture waveforms
    data = collector.capture_single([1, 2])

    # Analyze waveform
    stats = collector.analyze_waveform(data[1])
    print(f"Vpp: {stats['vpp']:.3f}V, Freq: {stats['frequency']/1e3:.2f}kHz")

    # Save to file - format is auto-detected from the extension (.npz/.csv/.mat/.h5)
    collector.save_data(data, 'measurement.npz')
Batch capture with configuration sweeps:
# Capture with different timebase and voltage settings
results = collector.batch_capture(
    channels=[1],
    timebase_scales=['1us', '10us', '100us'],
    voltage_scales={1: ['500mV', '1V', '2V']},
    triggers_per_config=5
)
collector.save_batch(results, 'batch_output')
Continuous time-series collection:
# Collect data over time with automated file saving
collector.start_continuous_capture(
    channels=[1, 2],
    duration=300,          # 5 minutes
    interval=1.0,          # 1 capture per second
    output_dir='time_series_data',
    file_format='npz'
)
Event-based trigger capture:
from scpi_control.automation import TriggerWaitCollector

with TriggerWaitCollector('192.168.1.100') as tc:
    # Configure trigger
    tc.collector.scope.trigger.set_source(1)
    tc.collector.scope.trigger.set_slope('POS')
    tc.collector.scope.trigger.set_level(1, 1.0)

    # Wait for trigger event
    data = tc.wait_for_trigger(channels=[1, 2], max_wait=30.0)
Advanced analysis:
# Built-in analysis includes: Vpp, RMS, frequency, SNR, THD, etc.
analysis = collector.analyze_waveform(waveform)
print(f"SNR: {analysis['snr_db']:.2f} dB")
print(f"THD: {analysis['thd_percent']:.2f}%")
See examples/ directory for complete automation examples including:
- Simple capture (
simple_capture.py) - Batch processing (
batch_capture.py) - Continuous monitoring (
continuous_capture.py) - Trigger-based capture (
trigger_based_capture.py) - Advanced analysis with visualization (
advanced_analysis.py)
Reading Saved Waveforms Back (load_waveform / scpi-extract)
Any file saved by the library (.npz/.csv/.mat/.h5) can be read back with
load_waveform(), which normalizes format differences and reattaches
acquisition provenance when present:
from scpi_control.waveform_io import load_waveform

loaded = load_waveform("measurement.npz")
print(loaded.time, loaded.voltage)          # numpy arrays
print(loaded.provenance)                    # instrument/settings snapshot, or None
df = loaded.to_dataframe()                  # pandas DataFrame, provenance in df.attrs
The same data is available from the command line via scpi-extract:
scpi-extract measurement.npz --info          # provenance + metadata summary
scpi-extract measurement.npz --csv out.csv   # dump raw time,voltage rows
scpi-extract measurement.npz --json          # machine-readable metadata
Examples
This project ships 27 runnable example scripts, each documented with its
requirements in examples/README.md — see it for the
full list. A few highlights:
- basic_usage.py - Connection and basic operations
- waveform_capture.py - Capture and save waveforms
- measurements.py - Automated measurements
- live_plot.py - Real-time plotting
- probe_calibration_analysis.py - Automated report generation with region extraction and AI analysis
- synthetic_signals.py - Generating parameterized test waveforms and streaming state-coupled mock captures (no hardware)
- waveform_provenance_and_extract.py - Capturing with provenance, saving, and reading back with
load_waveform()(no hardware)
Supported Models
Siglent (Fully Tested)
- SDS800X HD Series: SDS804X HD, SDS824X HD
- SDS1000X-E Series: SDS1102X-E, SDS1104X-E, SDS1202X-E, SDS1204X-E
- SDS2000X Plus Series: SDS2104X+, SDS2204X+, SDS2354X+
- SDS5000X Series: SDS5034X, SDS5054X, SDS5104X
Tektronix and LeCroy (core control + measurements)
- Tektronix TBS1000C Series: TBS1102C
- Tektronix 2 Series MSO: MSO24
- Tektronix 4 Series MSO: MSO44, MSO46
- Tektronix 5 Series MSO: MSO54, MSO56, MSO58, MSO58LP
- Tektronix 6 Series MSO: MSO64
- LeCroy WaveSurfer 3000z Series: WaveSurfer 3024z
- LeCroy WaveRunner 8000 Series: WaveRunner 8104
All Tektronix MSO models (2/4/5/6 Series) share one command variant and support automated measurements — see the SCPI Dialects guide for the full per-vendor gap list.
Command tables were verified command-by-command against the vendor programmer manuals (Tektronix TBS1000C, 2 Series MSO, and 4/5/6 Series MSO/6 Series LPD manuals; the Teledyne LeCroy MAUI Remote Control and Automation Manual) and exercised against a dialect-aware mock; not yet run against real Tektronix or LeCroy hardware.
Function Generators
- Siglent SDG1000X Series: SDG1032X, SDG1025, SDG1020
- Siglent SDG2000X Series: SDG2122X, SDG2082X, SDG2042X
Power Supplies
- Siglent SPD3303X Series: SPD3303X, SPD3303X-E (triple output)
- Siglent SPD1000X Series: SPD1305X, SPD1168X (single output)
Data Acquisition (DAQ)
- Keysight/Agilent 34970A Series: 34970A, 34972A
- Keysight DAQ970A Series: DAQ970A, DAQ973A
- Generic SCPI-99 data loggers via the DAQ capability registry
Compatibility
Should work with other Siglent oscilloscopes that support SCPI commands over Ethernet. Model-specific features are auto-detected via the ModelCapability registry. Unrecognized Tektronix or LeCroy models fall back to a conservative generic profile for that vendor (with a logged warning) rather than being rejected outright.
Note: Some SCPI commands vary between models. The library includes model-specific command variants for HD, X, and Plus series (Siglent) and for TBS vs. MSO (2/4/5/6 Series share one variant) (Tektronix).
Contributing
Contributions are welcome! Please read our Contributing Guide for details on:
- Development setup and workflow
- Code style and testing requirements
- Pull request process
- How to report bugs and request features
Quick Start for Contributors
# Clone and setup
git clone https://github.com/little-did-I-know/SCPI-Instrument-Control.git
cd SCPI-Instrument-Control

# Install development environment
make dev-setup

# Run tests
make test

# Format code
make format

# Run all checks
make check
During development, python -m pytest --testmon runs only the tests affected by your changes for fast feedback; the full suite is still required before opening a PR.
See our Code of Conduct and Security Policy for more information.
Community and Support
- Issues: Report bugs or request features
- Discussions: Ask questions and share ideas
- Security: See our Security Policy for reporting vulnerabilities
Resources
- 📘 Interactive Tutorial - Jupyter notebook with step-by-step examples
- 📁 Examples Directory - Ready-to-run example scripts
- 📖 API Documentation - Complete API reference in this README
- 🔧 Contributing Guide - How to contribute to the project
- 🧪 Experimental Features Guide - Beta releases and experimental features
- 🔒 Security Policy - Security best practices and reporting
License
MIT License - see LICENSE file for details
Project details
Verified details
These details have been verified by PyPIProject links
GitHub Statistics
Maintainers
Release history Release notifications | RSS feed


Download files
Download the file for your platform. If you're not sure which to choose, learn more about installing packages.
Source Distribution
Built Distribution
Filter files by name, interpreter, ABI, and platform.
If you're not sure about the file name format, learn more about wheel file names.
Copy a direct link to the current filters
File details
Details for the file scpi_instrument_control-5.1.0.tar.gz.
File metadata
- Download URL: scpi_instrument_control-5.1.0.tar.gz
- Upload date:
- Size: 11.0 MB
- Tags: Source
- Uploaded using Trusted Publishing? Yes
- Uploaded via: twine/6.1.0 CPython/3.13.14
File hashes
| Algorithm | Hash digest | |
|---|---|---|
| SHA256 |
4f098e5429f79f555242a1297eff54674b6092df92aa8e3479ae7e243e3210e7
|
|
| MD5 |
fece90c3a6889e4b717e612109f92a02
|
|
| BLAKE2b-256 |
834027a3fcdf0659aa6a0ac60a5df22293f20c92408a37c5549ffffe1f6012e9
|
Provenance
The following attestation bundles were made for scpi_instrument_control-5.1.0.tar.gz:
Publisher:
publish.yml on little-did-I-know/SCPI-Instrument-Control
-
Statement:
-
Statement type:
https://in-toto.io/Statement/v1 -
Predicate type:
https://docs.pypi.org/attestations/publish/v1 -
Subject name:
scpi_instrument_control-5.1.0.tar.gz -
Subject digest:
4f098e5429f79f555242a1297eff54674b6092df92aa8e3479ae7e243e3210e7 - Sigstore transparency entry: 2248412054
- Sigstore integration time:
-
Permalink:
little-did-I-know/SCPI-Instrument-Control@4f5a6272856d631066e7656d18a3b6ac59c95796 -
Branch / Tag:
refs/tags/v5.1.0 - Owner: https://github.com/little-did-I-know
-
Access:
public
-
Token Issuer:
https://token.actions.githubusercontent.com -
Runner Environment:
github-hosted -
Publication workflow:
publish.yml@4f5a6272856d631066e7656d18a3b6ac59c95796 -
Trigger Event:
release
-
Statement type:
File details
Details for the file scpi_instrument_control-5.1.0-py3-none-any.whl.
File metadata
- Download URL: scpi_instrument_control-5.1.0-py3-none-any.whl
- Upload date:
- Size: 581.1 kB
- Tags: Python 3
- Uploaded using Trusted Publishing? Yes
- Uploaded via: twine/6.1.0 CPython/3.13.14
File hashes
| Algorithm | Hash digest | |
|---|---|---|
| SHA256 |
bb2d66498783ec63429fb9a4cf20e90447901dfe2544c24348bd0a9bd8a44666
|
|
| MD5 |
5d4f0ed01643a8851940c7486799b1b6
|
|
| BLAKE2b-256 |
ba0d5ecb3b223ed3b0409f46547163d1b70020bfc7f63657e8708faa7141f12e
|
Provenance
The following attestation bundles were made for scpi_instrument_control-5.1.0-py3-none-any.whl:
Publisher:
publish.yml on little-did-I-know/SCPI-Instrument-Control
-
Statement:
-
Statement type:
https://in-toto.io/Statement/v1 -
Predicate type:
https://docs.pypi.org/attestations/publish/v1 -
Subject name:
scpi_instrument_control-5.1.0-py3-none-any.whl -
Subject digest:
bb2d66498783ec63429fb9a4cf20e90447901dfe2544c24348bd0a9bd8a44666 - Sigstore transparency entry: 2248412498
- Sigstore integration time:
-
Permalink:
little-did-I-know/SCPI-Instrument-Control@4f5a6272856d631066e7656d18a3b6ac59c95796 -
Branch / Tag:
refs/tags/v5.1.0 - Owner: https://github.com/little-did-I-know
-
Access:
public
-
Token Issuer:
https://token.actions.githubusercontent.com -
Runner Environment:
github-hosted -
Publication workflow:
publish.yml@4f5a6272856d631066e7656d18a3b6ac59c95796 -
Trigger Event:
release
-
Statement type:






