
SGtSNEpiPy is a Python interface to SG-t-SNE-П, a powerful tool for visualizing large, sparse, stochastic graphs.


Project description
SGtSNEpiPy
Overview
SGtSNEpiPy is a Python interface, i.e., a wrapper to 'SG-t-SNE-П' which is in Julia, implemented using the JuliaCall from PythonCall & JuliaCall package.
Introduction
The algorithm SG-t-SNE and the software t-SNE-Π were first described in Reference (Nikos Pitsianis, Alexandros-Stavros Iliopoulos, Dimitris Floros, Xiaobai Sun (2019)) [1] and released on GitHub in June 2019 (Nikos Pitsianis, Dimitris Floros, Alexandros-Stavros Iliopoulos, Xiaobai Sun (2019)) [2]. SG-t-SNE-П is a nonlinear method that directly embeds large, sparse, stochastic graphs into low-dimensional spaces without requiring vertex features to reside in or be transformed into a metric space. The approach is inspired by and builds upon the core principle of t-SNE for nonlinear dimensionality reduction and data visualization. Our implementation provides high-performance software for 1D, 2D, and 3D embedding of large sparse graphs on shared memory multicore computers.
SGtSNEpi, a Julia interface, i.e., a wrapper to SG-t-SNE-Π was released on GitHub in 2019. SGtSNEpiPy uses JuliaCall module to make this Julia interface SGtSNEpi readily deployable to the Python ecosystem.
Installation
To install SGtSNEpiPy through Python from PyPi, issue
$ pip install SGtSNEpiPy
The installation is successful if you can import SGtSNEpiPy
and run the command line tool:
from SGtSNEpiPy.SGtSNEpiPy import sgtsnepipy
Warning:
SGtSNEpiPy is currently not working on Windows and native M1 Macs: Either use WSL2 on Windows or use the package via rosetta2 on M1 Macs.
Note: The rest of the content remains unchanged as it does not contain any reST-specific elements.
See the full documentation for moredetails.
Parameters
SGtSNEpiPy.SGtSNEpiPy.sgtsnepipy
This package only has one method currently.
Y = sgtsnepi(A)
A: the input CSR sparse matrix representing the data points' pairwise similarities. (Mandatory)
- Data Type:
scipy.sparse.csr.csr_matrix(The matrix includes row, value, value, whose type are allnumpy.ndarraywith three arrays ofnumpy.int32,numpy.int32,numpy.int64), that is a CSR sparse matrix generated by packagescipy.
Returns Y: array with the coordinates of the embedding of the graph nodes
- Data Type:
numpy.ndarray, a 2-dimensional array ofnumpy.float64.- Number of rows: the number of rows or columns in the CSR matrix (the input).
- Number of columns: the number of dimensions of the embedding space.
Optional input parameters
d: the number of dimensions of the embedding space. (Optional)
- Data Type: Integer
- Default Value: 2
λ: SG-t-SNE scaling factor. (Optional)
- Data Type: Integer or Float
- Default Value: 10
max_iter: the maximum number of iterations for the optimization process. (Optional)
- Data Type: Integer
- Default Value: 1000
early_exag: the number of early exageration iterations. (Optional)
- Data Type: Integer
- Default Value: 250
Y0: initial distribution in embedding space (randomly generated if nothing).(Optional)
- Data Type: A numpy array of shape (number of data points, d).
- Default Value: None
- You should set this parameter to generate reproducible results.
profile: whether to enable profiling for the algorithm. (Optional)
- Data Type: Boolean
- Default Value: False
- Meaning: disable/enable profiling. If enabled the function return a 3-tuple: (Y, t, g), where Y is the embedding coordinates, t are the execution times of each module per iteration (size 6 x max_iter) and g contains the grid size, the embedding domain size (maximum(Y) - minimum(Y)), and the scaling factor s_k for the band-limited version, per dimension (size 3 x max_iter).
np: number of threads (set to 0 to use all available cores) (Optional)
- Data Type: Integer
- Default Value: threading.active_count(), which returns the number of active threads in the current process.
h: grid side length (Optional)
- Data Type: Float
- Default Value: 1.0
u: either perplexity or value of λ (Optional)
- Data Type: Integer
- Default Value: 10
k: number of nearest neighbors (for kNN formation) (Optional)
- Data Type: Integer
- Default Value: 30
eta: learning parameter (Optional)
- Data Type: Integer or Float
- Default Value: 200.0
alpha: exaggeration strength (applicable for first early_exag iterations). (Optional)
- Data Type: Integer or Float
- Default Value: 12
fftw_single: Whether to use single-precision FFTW (Fast Fourier Transform) library. (Optional)
- Data Type: Boolean
- Default Value: False
drop_leaf: remove edges connecting to leaf nodes. (Optional)
- Data Type: Boolean
- Default Value: False
list_grid_size: the list of allowed grid size along each dimension. (Optional)
- Data Type: A list of integers
- Default Value: False.
- Affects FFT performance; most efficient if the size is a product of small primes.
Warning:
Because there is currently no replacement for Enum type in SGtSNEpy, we are missing the reduction of parameter you can change in Julia: version. Thus, the value will be its default value in Python.
version: the version of the algorithm for computing repulsive terms. (Optional)
- Data Type: Enum (Julia)
- Default Value: NUCONV_BL
- Options are:
Examples
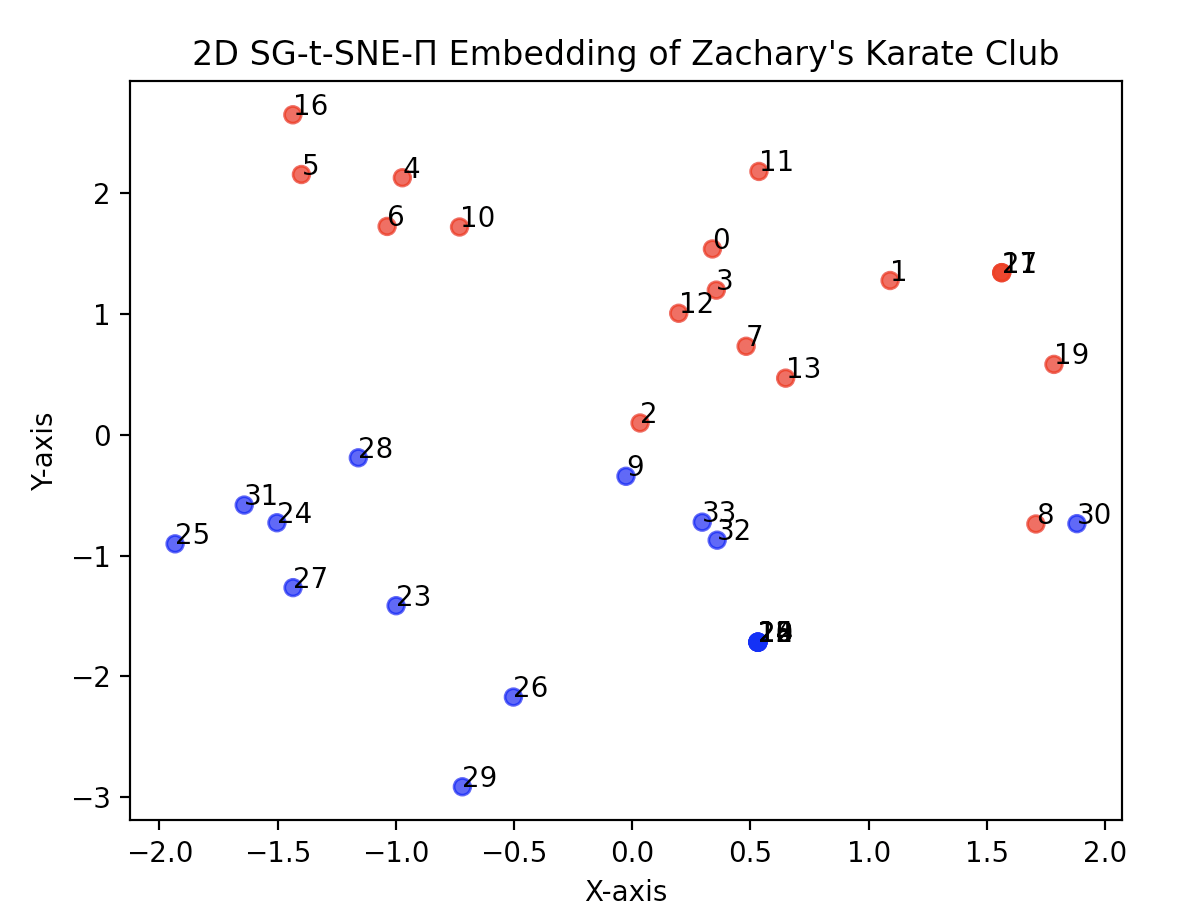
2D SG-t-SNE-П Embedding of Zachary's Karate Club graph
This example demonstrates the application of function SGtSNEpiPy using the SG-t-SNE-П algorithm to visualize Zachary's Karate Club graph in NetworkX. The algorithm creates a low-dimensional embedding of the nodes in 2D while preserving their structural relationships. After the embedding, the example uses matplotlib.pyplot to visualize 2D embedding. Nodes are colored based on their club membership ('Mr. Hi' or 'Officer'). The scatter plot helps understand the social network's structure and patterns based on club affiliations.
   from SGtSNEpiPy.SGtSNEpiPy import sgtsnepipy
   import networkx as nx
   import numpy as np
   import matplotlib.pyplot as plt

   # 'G' is the Zachary's Karate Club graph with 'club' attribute for each node

   G = nx.karate_club_graph()
   G_sparse_matrix = nx.to_scipy_sparse_matrix(G)
   y = sgtsnepipy(G_sparse_matrix,d=2)

   # Separate the X and Y coordinates from the embedding 'y'
   X = y[:, 0]
   Y = y[:, 1]

   # Get the color for each node based on the 'club' attribute
   node_colors = ['red' if G.nodes[node]['club'] == 'Mr. Hi' else 'blue' for node in G.nodes]

   # Create a scatter plot to visualize the embedding and color the nodes
   plt.scatter(X, Y, c=node_colors, alpha=0.7)

   # Label the nodes with their numbers (node names)
   for node, (x, y) in enumerate(zip(X, Y)):
       plt.text(x, y, str(node))

   plt.title("2D SG-t-SNE-П Embedding of Zachary's Karate Club")
   plt.xlabel("Dimension 1")
   plt.ylabel("Dimension 2")
   plt.show()
3D SG-t-SNE-П Embedding of Zachary's Karate Club graph
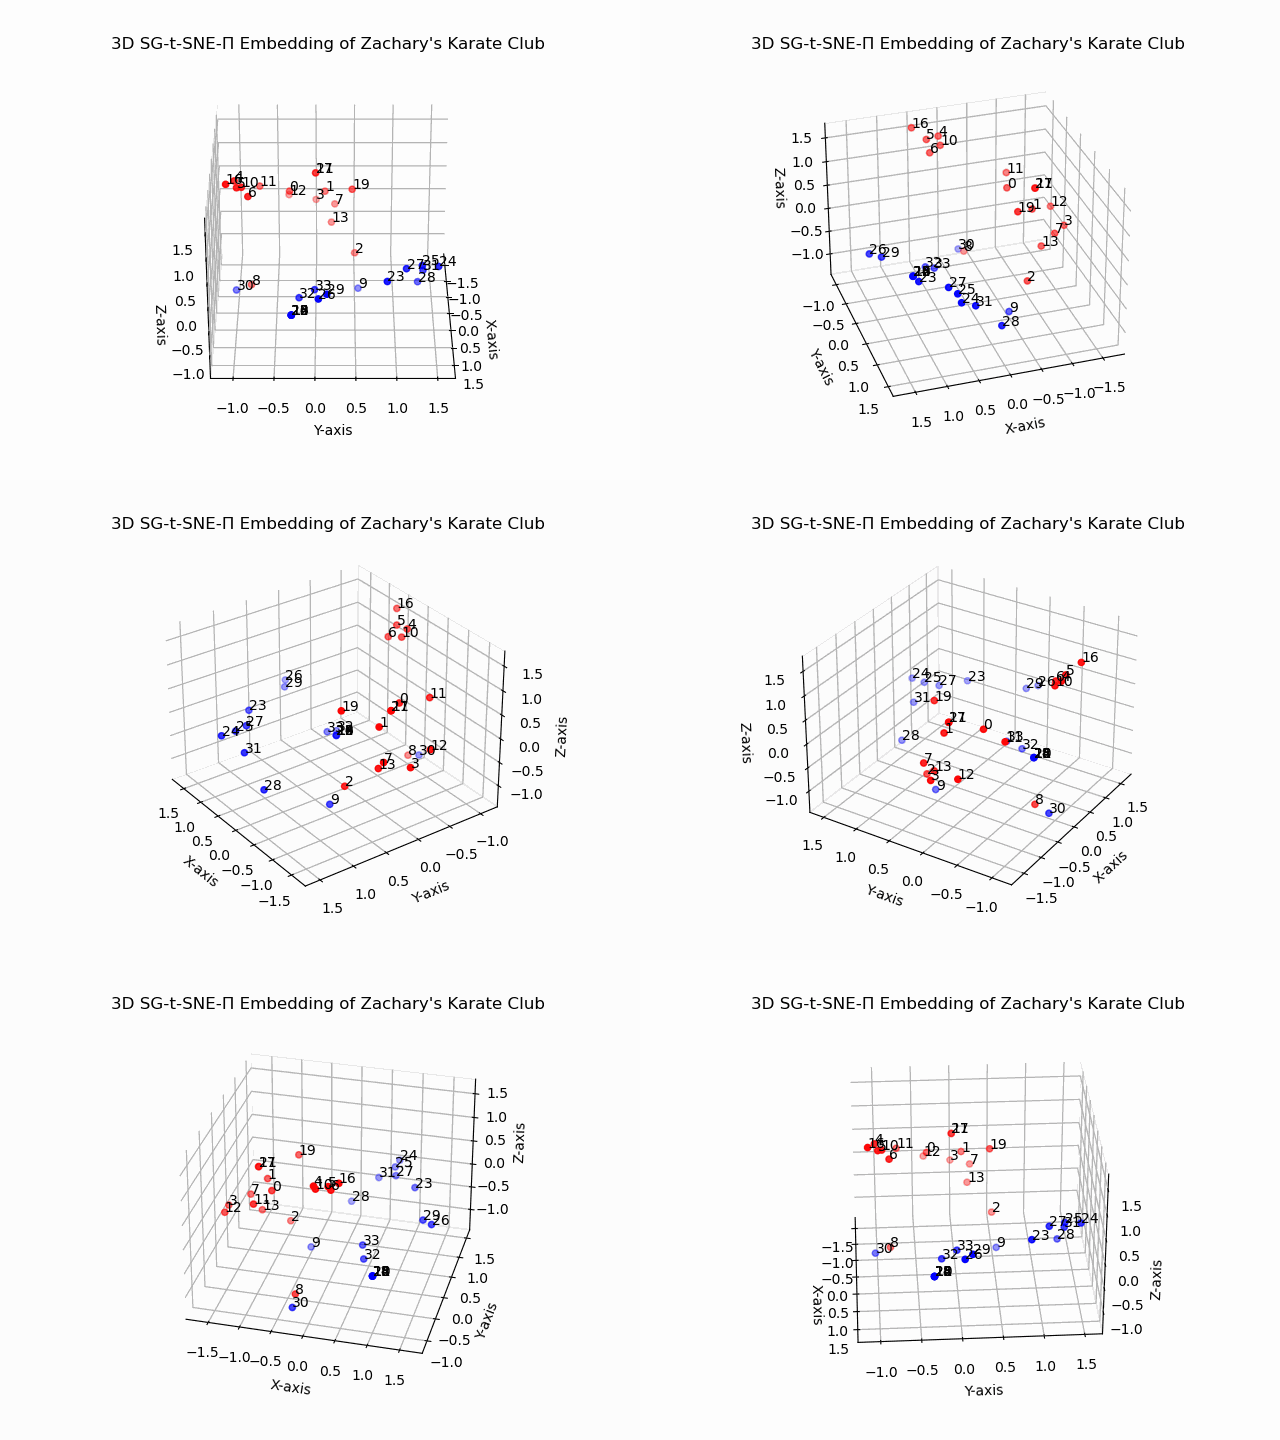
This example demonstrates the 3D embedding of same Zachary's Karate Club graph in NetworkX.
After useing matplotlib.pyplot to generate a 3D graph, the example refers to the website that uses matplotlib.animation and mpl_toolkits.mplot3d.axes3d.Axes3D to generate a gif file to rotate the 3D graph.
To save the animation to a gif file, you make sure you have Pillow in your python. To install Pillow through Python from PyPi, issue
$ pip install SGtSNEpiPy
The codes of 3D embedding
from SGtSNEpiPy.SGtSNEpiPy import sgtsnepipy
import networkx as nx
import numpy as np
import matplotlib.pyplot as plt
from matplotlib import animation
from mpl_toolkits.mplot3d import axes3d

G = nx.karate_club_graph()
G_sparse_matrix = nx.to_scipy_sparse_matrix(G)
y = sgtsnepipy(G_sparse_matrix,d=3)

# Get the color for each node based on the 'club' attribute
node_colors = ['red' if G.nodes[node]['club'] == 'Mr. Hi' else 'blue' for node in G.nodes]

# Separate the X, Y, and Z coordinates from the 3D embedding 'y'
X = y[:, 0]
Y = y[:, 1]
Z = y[:, 2]

# Create the 3D scatter plot to visualize the embedding
fig = plt.figure()
ax = fig.add_subplot(111, projection='3d')
scatter = ax.scatter(X, Y, Z, c=node_colors, cmap='coolwarm')   # You can choose other colormaps too

# Label the nodes with their numbers (node names)
for node, (x, y, z) in zip(G.nodes, zip(X, Y, Z)):
    ax.text(x, y, z, node)

ax.set_title("3D SG-t-SNE-П Embedding of Zachary's Karate Club")
ax.set_xlabel('X-axis')
ax.set_ylabel('Y-axis')
ax.set_zlabel('Z-axis')

# Function to initialize the animation
def init():
    scatter.set_offsets(np.column_stack([X, Y, Z]))  # Update the scatter plot data
    return scatter,

# Function to update the plot for each frame of the animation
def animate(i):
    ax.view_init(elev=30., azim=3.6*i)
    return scatter,

# Create the animation
ani = animation.FuncAnimation(fig, animate, init_func=init,
                              frames=100, interval=100, blit=True)

# Save the animation to a gif file
ani.save('3d_karate_club_animation.gif', writer='pillow')
Contact
Chenshuhao(Cody) Qin: chenshuhao.qin@duke.edu
Yihua(Aaron) Zhong: yihua.zhong@duke.edu
Citation
[1] Nikos Pitsianis, Alexandros-Stavros Iliopoulos, Dimitris Floros, Xiaobai Sun, Spaceland Embedding of Sparse Stochastic Graphs, In IEEE High Performance Extreme Computing Conference, 2019.
[2] Nikos Pitsianis, Dimitris Floros, Alexandros-Stavros Iliopoulos, Xiaobai Sun, SG-t-SNE-Π: Swift Neighbor Embedding of Sparse Stochastic Graphs, Journal of Open Source Software, 4(39), 1577, 2019.
If you use this software, please cite the following paper.
@inproceedings{pitsianis2019sgtsnepi,
   author = {Pitsianis, Nikos and Iliopoulos, Alexandros-Stavros and Floros, Dimitris and Sun, Xiaobai},
   doi = {10.1109/HPEC.2019.8916505},
   booktitle = {IEEE High Performance Extreme Computing Conference},
   month = {11},
   title = {{Spaceland Embedding of Sparse Stochastic Graphs}},
   year = {2019}
}
Release history Release notifications | RSS feed


Download files
Download the file for your platform. If you're not sure which to choose, learn more about installing packages.
Source Distribution
File details
Details for the file SGtSNEpiPy-1.1.5.tar.gz.
File metadata
- Download URL: SGtSNEpiPy-1.1.5.tar.gz
- Upload date:
- Size: 7.0 kB
- Tags: Source
- Uploaded using Trusted Publishing? No
- Uploaded via: twine/4.0.2 CPython/3.9.7
File hashes
| Algorithm | Hash digest | |
|---|---|---|
| SHA256 |
05d298048cabe0d6744a3b46ae09b907e9f0b5fb6bd24dca8eba3e9086909fb5
|
|
| MD5 |
699370279350d4f01e0cc312dec8caf5
|
|
| BLAKE2b-256 |
6431b879dcbc783ed3505b6e15ca99579f98107d17316310f944fa8c70899aed
|






