
SIMPApy
Single Sample Integrated Multi-Omics Pathway Analysis for Python
Description
SIMPApy is a Python package for performing Gene Set Enrichment Analysis (GSEA) on multiomics data in single samples and integrating the results. It supports RNA sequencing, DNA methylation, and copy number variation data types. This package uses the normalized single sample single --omic pathway analysis (SOPA) framework and integrates the results through normalized single sample integrated multiomics pathway analysis (SIMPA) extension.
[!NOTE] The SIMPApy package is actively maintained, and will receive further updates. The exact version used in the article is SIMPApy v1.1.3, which did not implement improved parallelization features optimized in Linux.
Installation
To install SIMPApy, create a new virtual environment (also installing Jupyter Notebooks through anaconda). Afterwards, use:
pip install SIMPApy
Features
- Run GSEA on single-omics data for single samples normalized to a control population (SOPA).
- Calculate normalized single sample gene rankings for different omics data types (RNA-seq, DNA methylation, CNV).
- Integrate GSEA results from multiple omics platforms in control-normalized single samples (SIMPA).
- Calculate Multiomics Pathway Enrichment Score (MPES) for analysis of differentially activated pathways.
- Plot the results for hypothesis-generation.
- Outputs are immediately saved to directories to avoid memory limitations.
Usage
Description of SOPA and SIMPA methodology
To use SOPA, we need raw data for a single -omic, and as follows:
-
The dataframes should be:
- For RNAseq data: TPM, or normalized counts. FPKM, RPKM may work, but the tool was not validated on them.
- For CNV data: Copy numbers. Each gene must have its individual copy numbers.
- For DNAm data: Beta values. The values must be mapped to gene names rather than CpG sites.
-
The dataframes must contain samples divided into 2 groups, cases and controls. For the case group, each sample must start with the name 'tm', while for the control group, each sample must start with 'tw'.
-
It is possible to use more than 2 groups. For example:
Assume 3 groups (group1, group2, group3). Analyses could be done between group1 and group2, and then group3 and group2, or group3 and group1, according to preference.
load libraries and data
import SIMPApy as sp
import pandas as pd

# Load example data found in data directory
rna_data_unprocessed = pd.read_csv("rna.csv", index_col=0)
rna_data = np.log2(rna_data_unprocessed + 1) # log2(TPM+1) data
cnv_data = pd.read_csv("cn.csv", index_col=0)
dna_data = pd.read_csv("dna.csv", index_col=0) # M-values
meth_data = pd.read_csv("meth.csv", index_col=0) # beta values

hallmark = "path/to/h.all.v2023.1.Hs.symbols.gmt" # hallmarks gene set
Single sample gene ranking
RNAseq and DNAm M-values
# input for all ranking functions should contain genes as rows, all samples (cases and controls) as columns
# Case/intervention group c
# for RNAseq
rnaranks = sp.calculate_ranking(df= rna_data, omic='rna', alpha=0.05)
# in the article, nonparametric MSD was used (function defaults)

# for DNAm
dnaranks = sp.calculate_ranking(df= dna_data, omic='dnam', alpha=0.05)

# assuming the following:
# df: pandas DataFrame with gene expression data (genes as rows, samples as columns).
After running the above functions, the following code should be used to retrieve the dataset:
# make a dataframe of rnaranks and dnaranks where index is gene names and columns are samples and only include "weighted" column
rnaranks_df = pd.concat({k: v['weighted'] for k, v in rnaranks.items()}, axis=1)
dnaranks_df = pd.concat({k: v['weighted'] for k, v in dnaranks.items()}, axis=1)
CNV data
Here, make sure to have copy number data. If GISTIC2 data is present (often through log(Copy_Number +1)), then conversion is usually done through 2**(GISTIC2_value -1)
cnranks = sp.calculate_ranking(cnv_data, omic = 'cnv'):
# cnv_data: Pandas DataFrame with gene-level copy numbers.
# Rows are genes and columns are samples ('tm' for cases, 'tw' for controls).
# Make sure input is integers, floats may have unpredictable behavior.
Afterwards, retrieve the dataframe:
# retrieve the final dataframe with weights
cnranks_df = pd.concat({k: v['adjusted_weight'] for k, v in cnranks.items()}, axis=1)
Running SOPA
To run SOPA, we need 2 available files:
- A single sample gene ranking dataframe
- a number of gene sets as a .gmt file
multiple samples must be available in the single sample ranking dataframe, each column must be a sample name with gene names as rows. Gene names must be ENSEMBL IDs. We could run SOPA:
single_samples_output = sp.sopa(ranking_dataframe, # such as rnaranks_df
                                gene_set_gmt_file, # # such as hallmark
                                folder_to_contain_outputs_for_single_sample_enrichment_analysis)
SIMPA
To run SIMPA, we need to have RNAseq, CNV, and DNA methylation SOPA results in 3 different folders. First, we get file names. This is to be done once, as the output of SOPA is similar across all 3 omics
# get file list
file_list= glob.glob(os.path.join(dir, '*_gsea_results.csv')) # dir is to be replaced with r"X:\sopa_results_folder_Location\".
# sample ids
sample_ids = [os.path.basename(f).split('_')[0] for f in file_list]
Then, we define the paths to RNA, CNVs, and DNAm SOPA results:
# This function requires 3 data directories to run, one for each omic type
# rna_dir = 'path/to/rna/sopa/results'
# cnv_dir = 'path/to/cnv/sopa/results'
# dna_dir = 'path/to/dna/sopa/results'

# run SIMPA
simpa_res = sp.simpa(sample_ids, rna_dir, cnv_dir, dna_dir, output_directory)
Visualization of SIMPA results
Prior to visualization using 3D box, we need 4 - 5 datasets, and as follows:
- Mandatory:
- SIMPA results dataframe from running simpa()
- RNAseq raw data (preferably TPM values, as algorithm clips values at 1,000 TPM)
- CNVs raw data (copy numbers)
- DNAm raw data (beta values)
- Optional:
- Clinical information dataset
Then, we retrieve 2 datasets, one for cases (TMAs here) and one for controls (TWAs in this example):
tmas, twas = sp.process_multiomics_data(simpa_res, # SIMPA results
                                            rna_data_unprocessed, # TPM values
                                             cnv_data, # copy numbers
                                             meth_data, # beta values
                                             pop_info) # for samples clinical information
Afterwards, we could use:
sp.create_interactive_plot(twas, # loading dataframe
                            "TWA") # header title
The code would show the figure below, which can be rotated and interacted with inside jupyter notebooks:
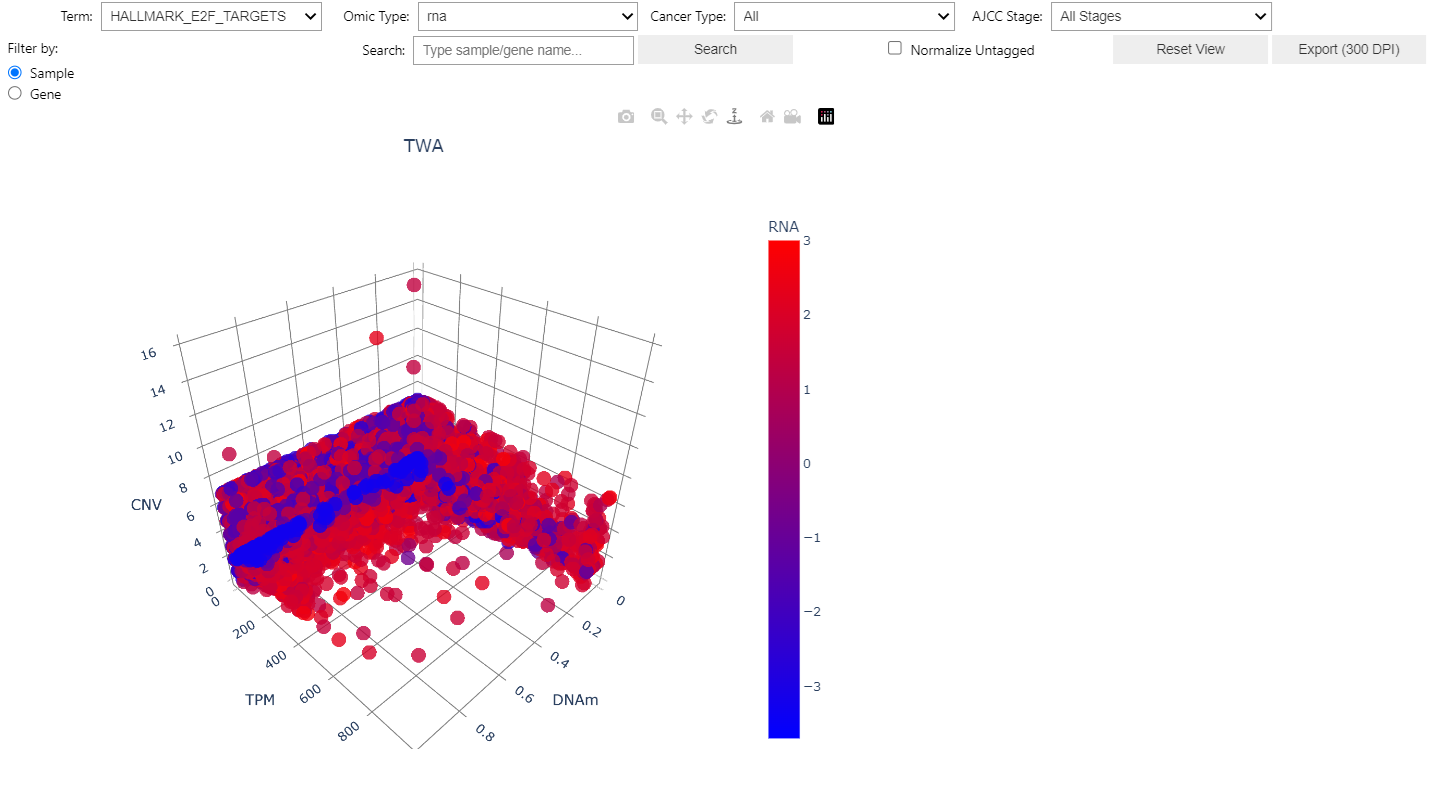
In the figure, each dot is a single gene in a single sample. On hovering each datapoint, the following data is shown:
        - Gene: Gene name of hovered datapoint

        - Sample: Sample name datapoint belongs to

        - Term: Term the datapoint enriches (in general, the Term/pathway would match the dropdown menu's Term)

        - Cancer Type: clinical information (if available)

        - AJCC Stage: clinical (if available)

        - DNAm: DNA methylation beta value

        - TPM: TPM value (clipped to 1,000)

        - CNV: Copy number value

        - Enrichment: NES or MPES

        - Tagged: 1 if leading edge (impactful on enrichment), 0 if not. This is determined by the GSEA algorithm

        - Multiomics FDR: BH-corrected p-value for the Term/pathway the datapoint belongs to.
Figure settings allow the following:
- Term (dropdown menu): Filtering based on pathway/term

- Omic Type (dropdown menu): Changes color based on enrichment of the selected omic (options are RNA, CNV, DNA, MPES)

- Cancer Type (dropdown menu): Filtering based on clinical information

- AJCC Stage (dropdown menu): Filtering based on clinical information

- Filter by (buttons): This setting is used prior to search in the Search box. If sample is selected, the search box filters all datapoints to match the sample searched for. If gene selected, the search box will filter the datapoints to include only genes matching the gene name searched for. Clicking behavior, when clicking the datapoints, is also affected by the *Filter by* setting

- Search (search box): After the selection of Sample/Gene from the *Filter by* option, the search box will retrieve matching variables (not case sensitive). After writing, click *Search*.

- Normalize Untagged (checkbox): This setting allows for normalizing untagged datapoints (Tagged = 0), by controlling their NES values to 0. This option is mainly for single -omics, as on MPES, all -omics must be tagged for a single datapoint for it to not be normalized.

- Reset View (button): Restores the view to unfiltered.

- Export (300DPI): This options exports the current view of the 3D box.
Downstream analysis
This package also offers direct analysis of results obtained with both SOPA and SIMPA through the .analyze module. Please consult the module's documentation for further instructions.
Citation
If you found this python package helpful in your research, please consider citing the original publication.
To reproduce the article (doi.org/10.1093/bib/bbag338), SIMPApy v1.1.3 was used in a Windows environment.
If SIMPApy helped you, please remember to cite the package through:
@article{Alsharoh2026,
	author = {Alsharoh, H. and Ismaiel, A. and Calin G. and Pop O. and Berindan-Neagoe, I. and Bender, A.},
	title = {SOPA and SIMPA: Normalized single sample integrated multiomics pathway analysis of tumor heterogeneity in solid cancers},
	journal = {Briefings in Bioinformatics},
	year = {2026},
	doi = {10.1093/bib/bbag338}
}
License
Apache-2.0
1 maintainer

Release files for SIMPApy 1.1.4
For a detailed explanation of source distributions (sdists) and built distributions (wheels), please see the package formats documentation.
Source distribution (sdist)
| File | Size | Uploaded | |
|---|---|---|---|
| simpapy-1.1.4.tar.gz | 38.6 kB | Details |
Built distribution (wheel)
| File | Interpreter | ABI | Platform | Reset |
|---|---|---|---|---|
| simpapy-1.1.4-py3-none-any.whl | Python 3 | none | any | Details |
Total release size: 67.3 kB
Release files / simpapy-1.1.4.tar.gz
| Download URL | simpapy-1.1.4.tar.gz |
|---|---|
| Size | 38.6 kB |
| Tags | Source |
|
SHA-256 checksum How to use checksums |
b79de16be333b26be373d3a18483f65d13aea91181dfdaa52df2bca7fd1d6e6a
|
|
BLAKE2b-256 checksum How to use checksums |
3cf6474bad3a6e33e1dfbb8a8e813ad619766b0c53246528245d0fea8531597c
|
| Upload date | |
|
Uploaded using Trusted Publishing? What is trusted publishing? |
Yes |
| Uploaded via |
twine/6.1.0 CPython/3.13.12
|
Provenance
Provenance describes where a file came from. On PyPI, provenance is shared via attestations, which provide a verifiable record of the build or publishing details. View details, limitations and caveats.


PyPI Publish Attestation
PyPI verified that this artifact, at this checksum, originated from the publisher listed below.
Signed by GitHub Actions, verified by PyPI on Jun 12, 2026.
Transparency logRelease files / simpapy-1.1.4-py3-none-any.whl
| Download URL | simpapy-1.1.4-py3-none-any.whl |
|---|---|
| Size | 28.7 kB |
| Tags | Python 3 |
|
SHA-256 checksum How to use checksums |
c51dff491722bde2048aead2f1f4f94e782c8f46d7d8d998b4d60d7ff9194d49
|
|
BLAKE2b-256 checksum How to use checksums |
3c911da5d0325608c0bb52548a213c2eb0333bb7cf5ca4d34d02777b28737ee5
|
| Upload date | |
|
Uploaded using Trusted Publishing? What is trusted publishing? |
Yes |
| Uploaded via |
twine/6.1.0 CPython/3.13.12
|
Provenance
Provenance describes where a file came from. On PyPI, provenance is shared via attestations, which provide a verifiable record of the build or publishing details. View details, limitations and caveats.
PyPI Publish Attestation
PyPI verified that this artifact, at this checksum, originated from the publisher listed below.
Signed by GitHub Actions, verified by PyPI on Jun 12, 2026.
Transparency log













