Format Matplotlib for scientific plotting


Project description
Science Plots
| PyPI version |
|
| conda-forge version |
|
| DOI |
|
Warning : As of version 2.0.0, you need to add
import scienceplotsbefore setting the style (plt.style.use('science')).
Matplotlib styles for scientific figures
This repo has Matplotlib styles to format your figures for scientific papers, presentations and theses.
You can find the full gallery of included styles here.
Getting Started
The easiest way to install SciencePlots is by using pip:
# to install the latest release (from PyPI)
pip install SciencePlots

# to install the latest release (using Conda)
conda install -c conda-forge scienceplots

# to install the latest commit (from GitHub)
pip install git+https://github.com/garrettj403/SciencePlots

# to clone and install from a local copy
git clone https://github.com/garrettj403/SciencePlots.git
cd SciencePlots
pip install -e .
From version v1.1.0 on, import scienceplots is needed on top of your scripts so Matplotlib can make use of the styles.
Notes:
- SciencePlots requires Latex (see Latex installation instructions).
- If you would like to use CJK fonts, you will need to install these font separately (see CJK font installation instructions).
Please see the FAQ for more information and troubleshooting.
Using the Styles
"science" is the primary style in this repo. Whenever you want to use it, simply add the following to the top of your python script:
import matplotlib.pyplot as plt
import scienceplots

plt.style.use('science')
You can also combine multiple styles together by:
plt.style.use(['science','ieee'])
In this case, the ieee style will override some of the parameters from the science style in order to configure the plot for IEEE papers (column width, fontsizes, etc.).
To use any of the styles temporarily, you can use:
with plt.style.context('science'):
    plt.figure()
    plt.plot(x, y)
    plt.show()
Examples
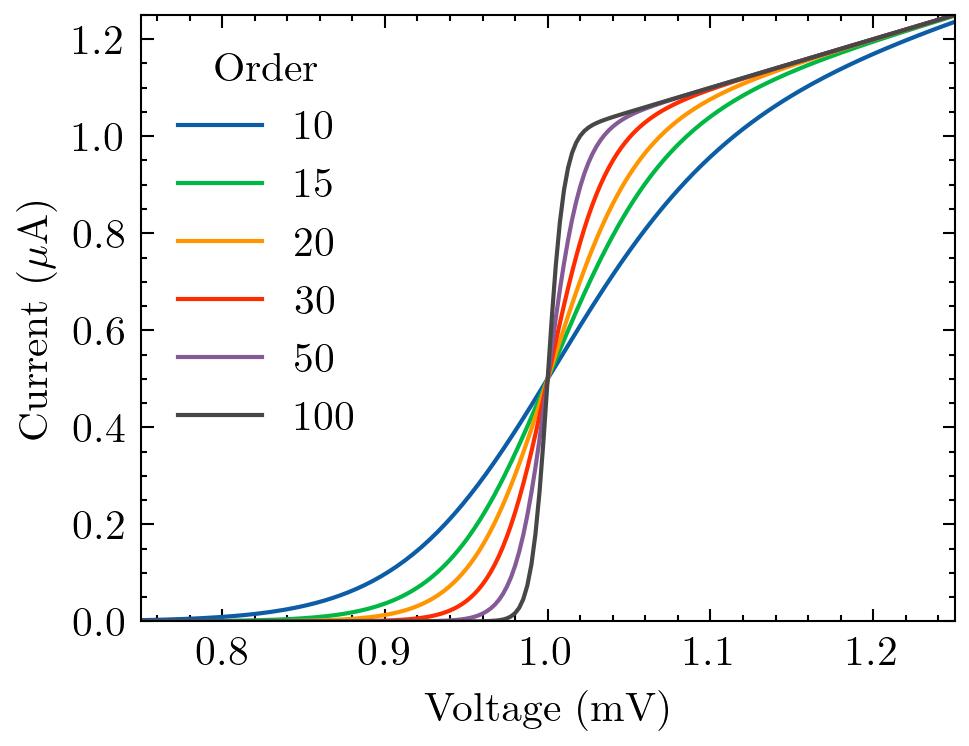
The basic science style is shown below:
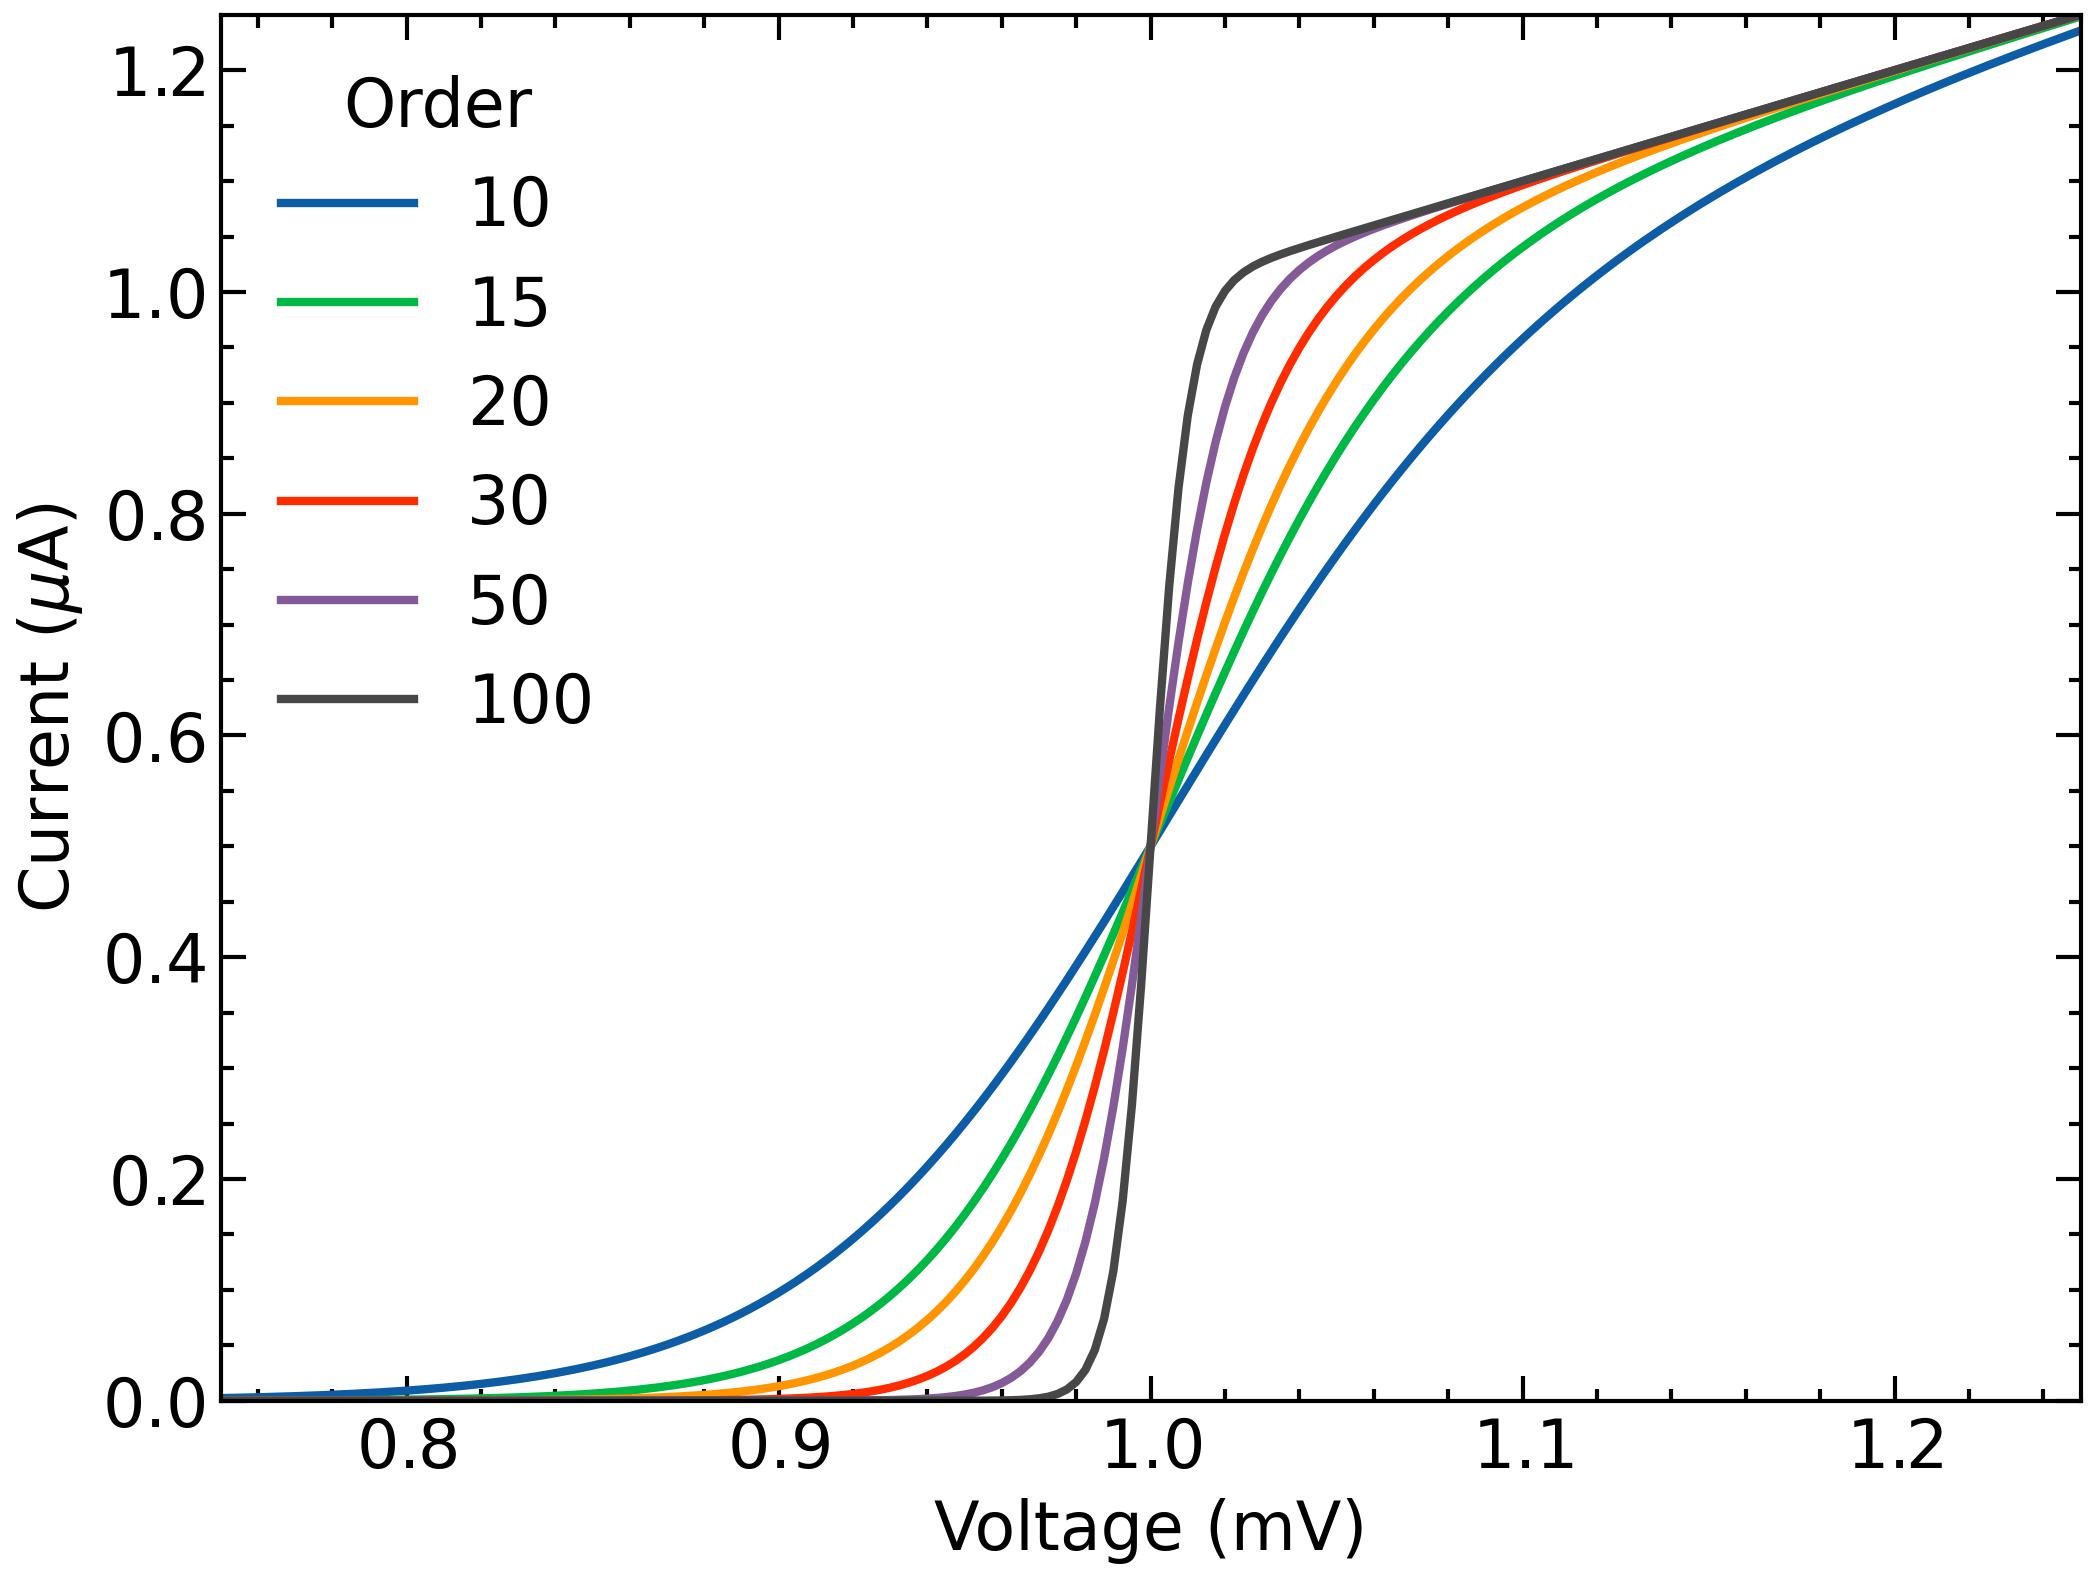
It can be cascaded with other styles to fine-tune the appearance. For example, the science + notebook styles (intended for Jupyter notebooks):
Please see the project Wiki for a full list of available styles.
Specific Styles for Academic Journals
The science + ieee styles for IEEE papers:
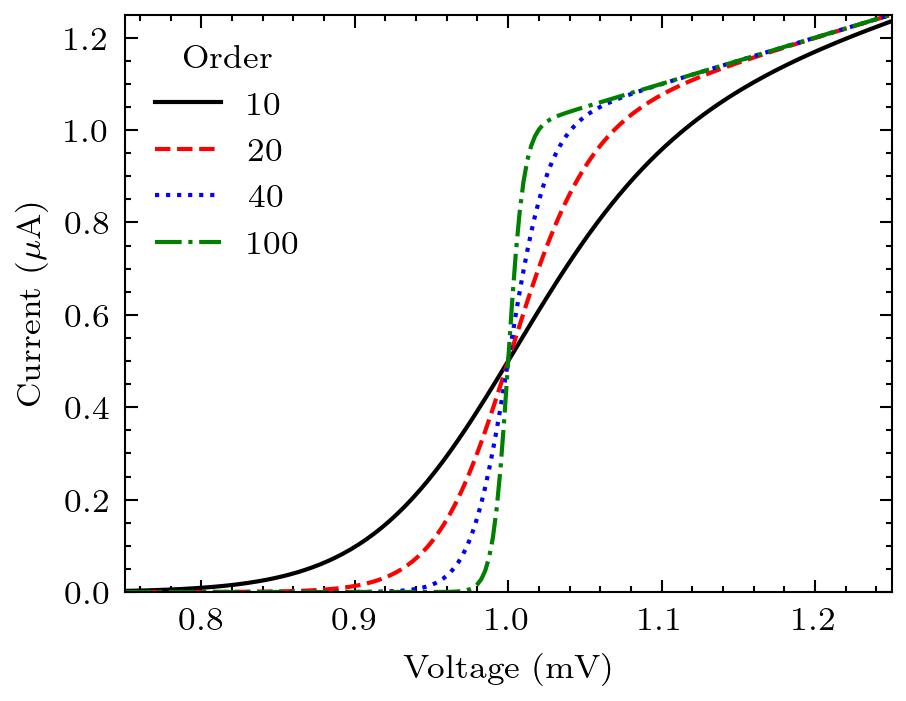
- IEEE requires figures to be readable when printed in black and white. The
ieeestyle also sets the figure width to fit within one column of an IEEE paper.
The science + nature styles for Nature articles:
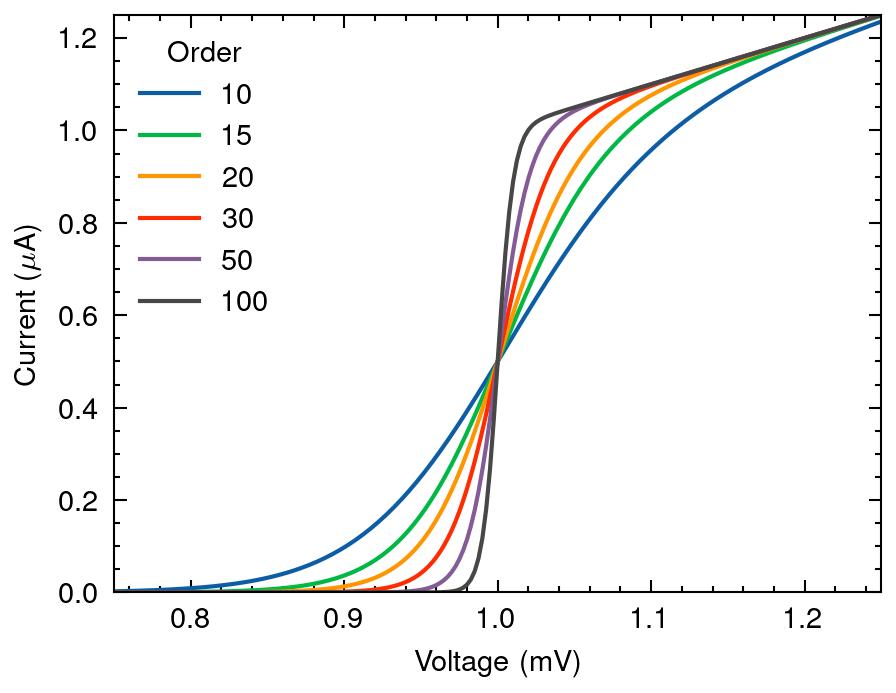
- Nature recommends sans-serif fonts.
Other languages
SciencePlots currently supports:
Example: Traditional Chinese (science + no-latex + cjk-tc-font):
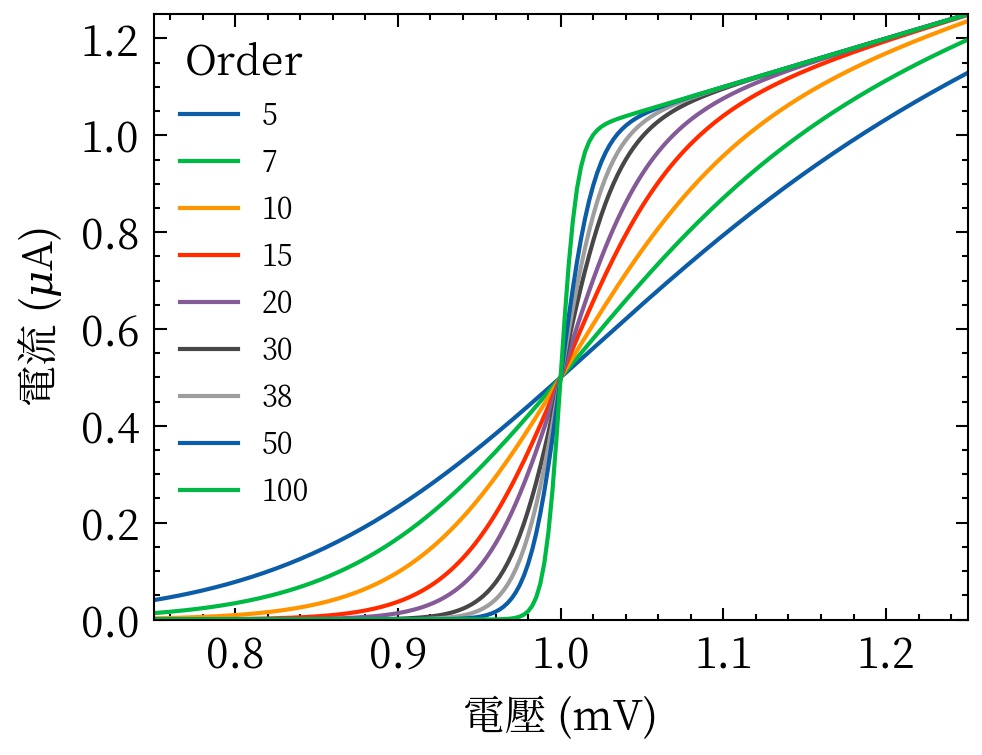
See the FAQ for information on installing CJK fonts.
Other color cycles
SciencePlots comes with a variety of different color cycles. For a full list, see the project Wiki. Two examples are shown below.
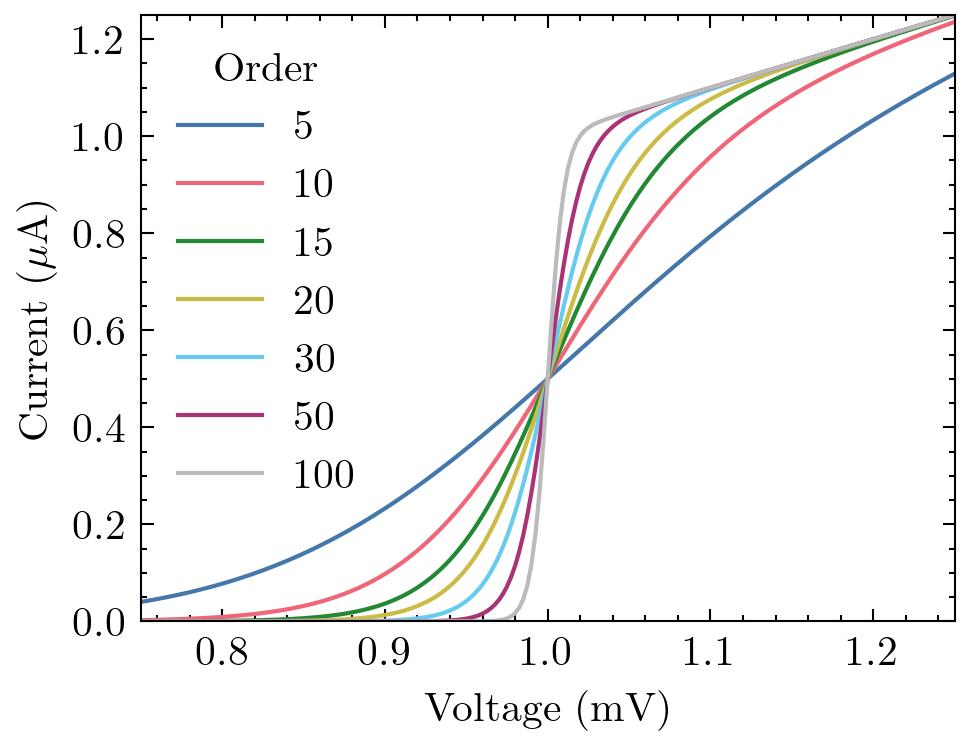
The bright color cycle (color blind safe):
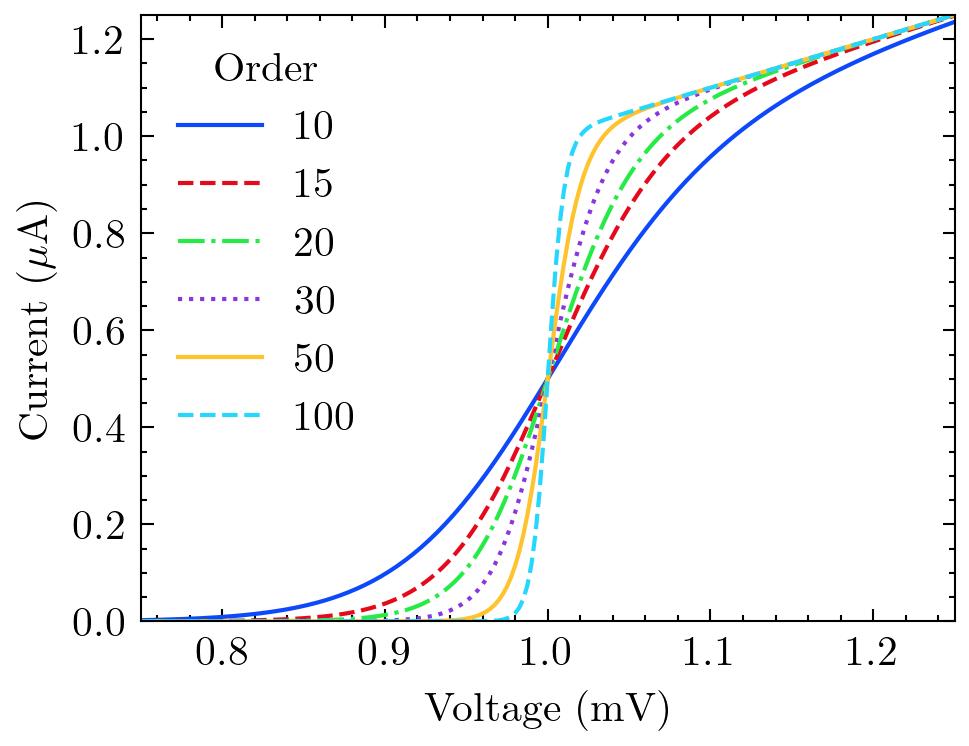
The high-vis color cycle:
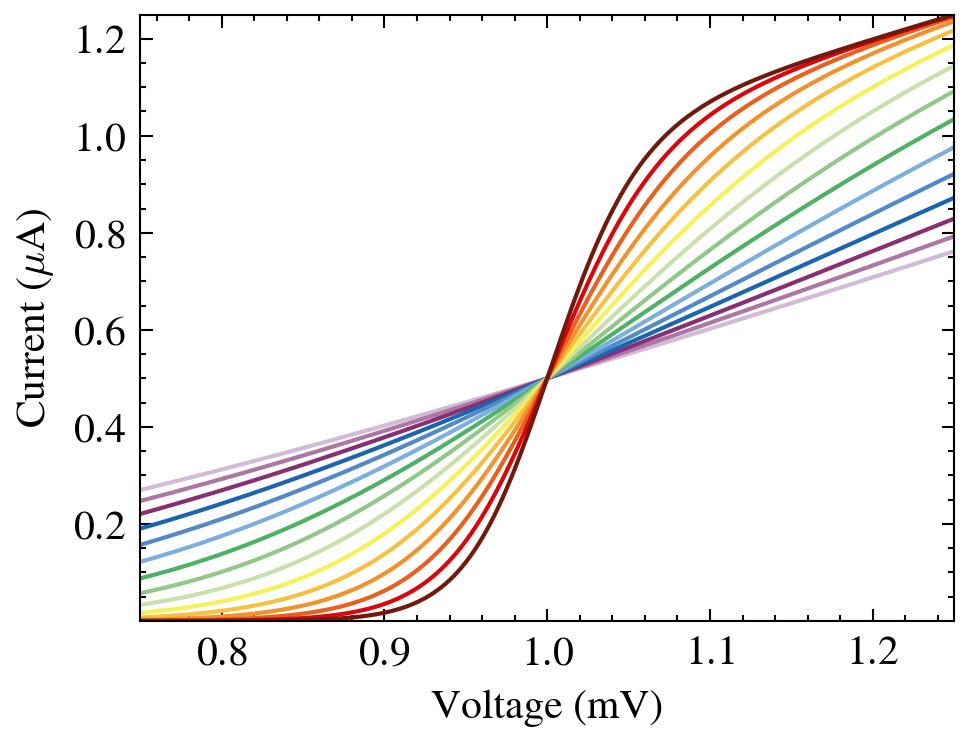
Paul Tol's discrete rainbow color sets are available as well, with the style identifier discrete-rainbow-<n>, where <n> is the number of unique colors. <n> ranges from 1 to 23 (inclusive). For example, discrete-rainbow-15:
Help and Contributing
Please feel free to contribute to the SciencePlots repo! For example, it would be good to add new styles for different journals and add new color cycles. Before starting a new style or making any changes, please create an issue through the GitHub issue tracker. That way we can discuss if the changes are necessary and the best approach.
If you need any help with SciencePlots, please first check the FAQ and search through the previous GitHub issues. If you can't find an answer, create a new issue through the GitHub issue tracker.
You can checkout Matplotlib's documentation for more information on plotting settings.
FAQ
You can find the FAQ in the project Wiki.
SciencePlots in Academic Papers
The following papers use SciencePlots:
-
C.-S. Li, S.-P. Ma, and T.-H. Lin, "FMSA: A Universal Microservice Architecture Based on FHIR Medical Informatics Standard," 2025 Second International Conference on Artificial Intelligence for Medicine, Health and Care (AIxMHC), pp. 42–49, Oct. 2025.
-
Keçeci, Mehmet. "Scalable Complexity: Mathematical Analysis and Potential for Physical Applications of the Keçeci Circle Fractal", 13 May 2025. https://doi.org/10.5281/zenodo.15396198. (Reference has been made to the module "SciencePlots".)
-
J. D. Garrett, C.-Y. E. Tong, L. Zeng, T.-J. Chen and M.-J. Wang, "A 345 GHz Sideband-Separating Receiver Prototype with Ultra-Wide Instantaneous Bandwidth," IEEE Trans. THz Sci. Technol., vol. 13, no. 3, pp. 237-245, Mar. 2023.
-
J. Garrett, B.-K. Tan, C. Chaumont, F. Boussaha, and G. Yassin, "A 230-GHz Endfire SIS Mixer With Near Quantum-Limited Performance," IEEE Microw. Wirel. Compon. Lett., Jul. 2022. (open access)
-
J. Garrett, and E. Tong, "Measuring Cryogenic Waveguide Loss in the Terahertz Regime," IEEE Trans. THz Sci. Technol., vol. 12, no. 3, pp. 293-299, May 2022.
-
Y. Liu, X. Liu, and Y. Sun, "QGrain: An open-source and easy-to-use software for the comprehensive analysis of grain size distributions", Sedimentary Geology, vol. 423, 105980, Aug. 2021.
-
M. Gasanov, et al., "A New Multi-objective Approach to Optimize Irrigation Using a Crop Simulation Model and Weather History" in Computational Science–ICCS 2021, Krakow, Poland, Jun. 2021, pp. 75-88. (open access)
-
J. Garrett, and E. Tong, "A Dispersion-Compensated Algorithm for the Analysis of Electromagnetic Waveguides," IEEE Signal Process. Lett., vol. 28, pp. 1175-1179, Jun. 2021.
-
G. Jegannathan, et al., "Current-Assisted SPAD with Improved p-n Junction and Enhanced NIR Performance", Sensors, Dec 2020. (open access)
-
H. Tian, et al., "ivis Dimensionality Reduction Framework for Biomacromolecular Simulations", J. Chem. Inf. Model., Aug 2020. (open access)
-
P. Stoltz, et al., "A new simple algorithm for space charge limited emission," Phys. Plasmas, vol. 27, no. 9, pp. 093103, Sep. 2020. (open access)
-
J. Garrett, et al., "A Nonlinear Transmission Line Model for Simulating Distributed SIS Frequency Multipliers," IEEE Trans. THz Sci. Technol., vol. 10, no. 3, pp. 246-255, May 2020. (open access)
-
J. Garrett, et al., "Simulating the Behavior of a 230 GHz SIS Mixer Using Multi-Tone Spectral Domain Analysis," IEEE Trans. THz Sci. Technol., vol. 9, no. 9, pp. 540-548, Nov. 2019. (open access)
-
J. Garrett, et al., "A Compact and Easy to Fabricate E-plane Waveguide Bend," IEEE Microw. Wireless Compon. Lett., vol. 29, no. 8, pp. 529-531, Aug. 2019. (open access)
-
J. Garrett, "A 230 GHz Focal Plane Array Using a Wide IF Bandwidth SIS Receiver," DPhil thesis, University of Oxford, Oxford, UK, 2018. (open access)
If you use SciencePlots in your paper/thesis, feel free to add it to the list!
Citing SciencePlots
You don't have to cite SciencePlots if you use it but it's nice if you do:
@article{SciencePlots,
  author       = {John D. Garrett},
  title        = {{garrettj403/SciencePlots}},
  month        = sep,
  year         = 2021,
  publisher    = {Zenodo},
  version      = {1.0.9},
  doi          = {10.5281/zenodo.4106649},
  url          = {http://doi.org/10.5281/zenodo.4106649}
}
Release history Release notifications | RSS feed


Download files
Download the file for your platform. If you're not sure which to choose, learn more about installing packages.
Source Distribution
Built Distribution
Filter files by name, interpreter, ABI, and platform.
If you're not sure about the file name format, learn more about wheel file names.
Copy a direct link to the current filters
File details
Details for the file scienceplots-2.2.2.tar.gz.
File metadata
- Download URL: scienceplots-2.2.2.tar.gz
- Upload date:
- Size: 19.7 kB
- Tags: Source
- Uploaded using Trusted Publishing? No
- Uploaded via: twine/6.2.0 CPython/3.14.5
File hashes
| Algorithm | Hash digest | |
|---|---|---|
| SHA256 |
d46ce7170b4160265c777a48f73a0db1fdff8460f59a0ded0e364acb139ab115
|
|
| MD5 |
ec4a5efa3513b6b42ea7456e18f5293e
|
|
| BLAKE2b-256 |
500573a19270d548caadf145b0fc8ab94a8c716faeca528c254a4192676e048b
|
File details
Details for the file scienceplots-2.2.2-py3-none-any.whl.
File metadata
- Download URL: scienceplots-2.2.2-py3-none-any.whl
- Upload date:
- Size: 33.4 kB
- Tags: Python 3
- Uploaded using Trusted Publishing? No
- Uploaded via: twine/6.2.0 CPython/3.14.5
File hashes
| Algorithm | Hash digest | |
|---|---|---|
| SHA256 |
f63d04e6ec11fe2036ec120feb6c2f1d84b7c38e96cc7edcde7208064653af98
|
|
| MD5 |
ee9197bc6df3b7e69a5253e2909c4e33
|
|
| BLAKE2b-256 |
5dff6469a5cabf230ebc94f927246874136098dde1aacc9328bc40dceb24ba13
|


