SimulatedLIBS provides simple Python class to simulate LIBS spectra with NIST LIBS Database interface

Project description
Simulated LIBS


SimulatedLIBS provides Python class to simulate LIBS spectra with NIST LIBS Database interface. SimulatedLIBS also allows the creation of simulated data sets that can be used to train ML models. SimulatedLIBS was mentioned is FOSS For Spectroscopy by Prof. Bryan A. Hanson, DePauw University.
Project created for B.Eng. thesis: Computer methods of the identification of the elements in optical spectra obtained by Laser Induced Breakdown Spectroscopy.
Thesis supervisor: Paweł Gąsior PhD e-mail: pawel.gasior@ifpilm.pl Institute of Plasma Physics and Laser Microfusion - IPPLM
Installation
pip install SimulatedLIBS
Import
from SimulatedLIBS import simulation
Example
Parameters:
- Te - electron temperature [eV]
- Ne - electron density [cm^-3]
- elements - list of elements
- percentages - list of elements concentrations
- resoulution
- wavelength range: low_w, upper_w
- maximal ion charge: max_ion_charge
- websraping: 'static' or 'dynamic'
Static websraping
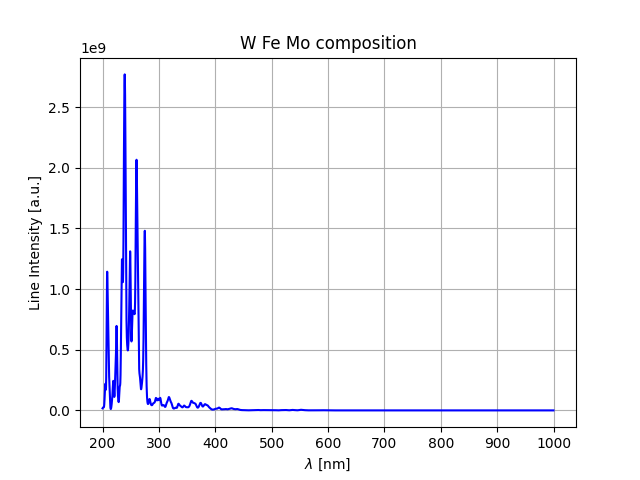
libs = simulation.SimulatedLIBS(Te=1.0,
                                Ne=10**17,
                                elements=['W','Fe','Mo'],
                                percentages=[50,25,25],
                                resolution=1000,
                                low_w=200,
                                upper_w=1000,
                                max_ion_charge=3,
                                webscraping='static')
Plot
libs.plot(color='blue', title='W Fe Mo composition')
Save to file
libs.save_to_csv('filename.csv')
Interpolated spectrum
SimulatedLIBS interpolates retrieved data from NIST with cubic splines.
libs.get_interpolated_spectrum()
Raw spectrum
Raw retrieved data from NIST
libs.get_raw_spectrum()
Dynamic webscraping
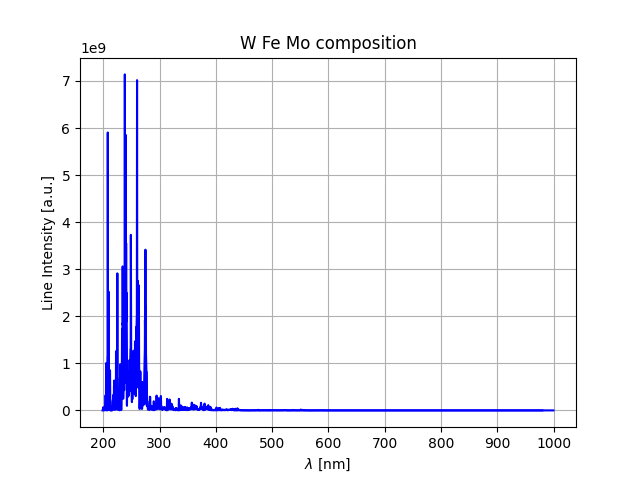
libs = simulation.SimulatedLIBS(Te=1.0,
                                Ne=10**17,
                                elements=['W','Fe','Mo'],
                                percentages=[50,25,25],
                                resolution=1000,
                                low_w=200,
                                upper_w=1000,
                                max_ion_charge=3,
                                webscraping='dynamic')
Plot
libs.plot(color='blue', title='W Fe Mo composition')
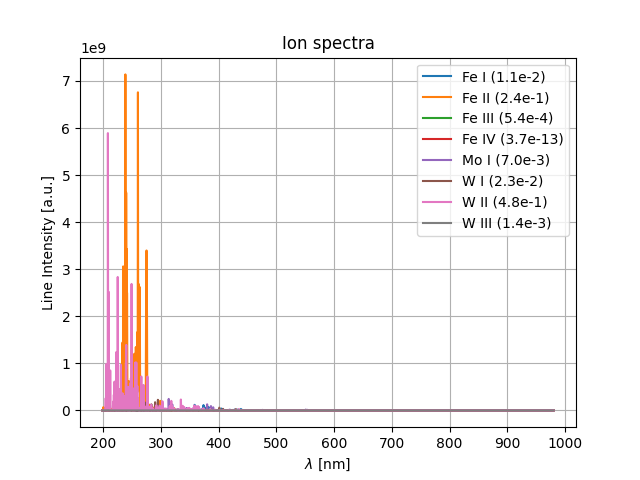
Ion spectra
After simulation with parameter websraping = dynamic, ion spectra are stored in ion_spectra (pd.DataFrame) and can be plotted.
libs.plot_ion_spectra()
Random dataset of samples
Based on .csv file with chemical composition of samples, one can generate dataset of simulated LIBS measurements with different Te and Ne values.
Example of input .csv file:
| W | H | He | name |
|---|---|---|---|
| 50 | 25 | 25 | A |
| 30 | 60 | 10 | B |
| 40 | 40 | 20 | C |
simulation.SimulatedLIBS.create_dataset(input_csv_file="data.csv",
                                        output_csv_file='output.csv',
                                        size=100,
                                        Te_min=1.0,
                                        Te_max=2.0,
                                        Ne_min=10**17,
                                        Ne_max=10**18)
Example of output .csv file:
| 200.0 | 200.1 | 200.2 | 200.3 | 200.4 | ... | H | W | Te | Ne | |
|---|---|---|---|---|---|---|---|---|---|---|
| 0 | 0 | 0 | 0 | 0 | 0 | ... | 2 | 50 | 1.43 | 1.08e+17 |
| 1 | 0 | 0 | 0 | 0 | 0 | ... | 0 | 0 | 1.06 | 1.08e+17 |
| 2 | 0 | 0.1 | 0.1 | 0.1 | 0.1 | ... | 0 | 68 | 1.82 | 1.18e+17 |
| 3 | 0 | 54.5 | 56.7 | 54.4 | 48.4 | ... | 0 | 3 | 1.25 | 1.06e+17 |
| 4 | 0 | 121.7 | 143.1 | 140.5 | 115.3 | ... | 0 | 84 | 1.08 | 9.23e+17 |
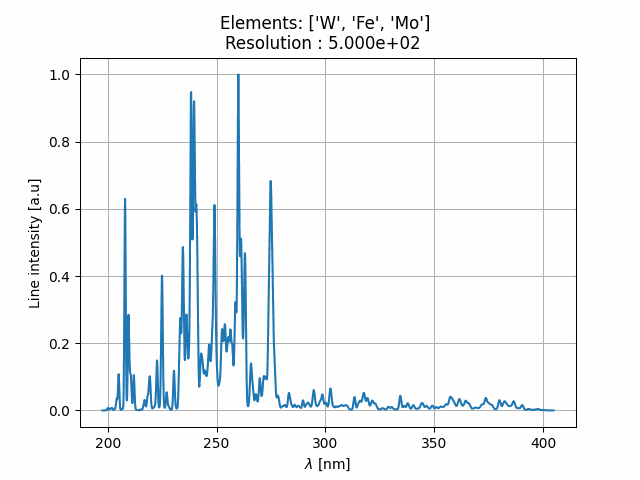
Animations
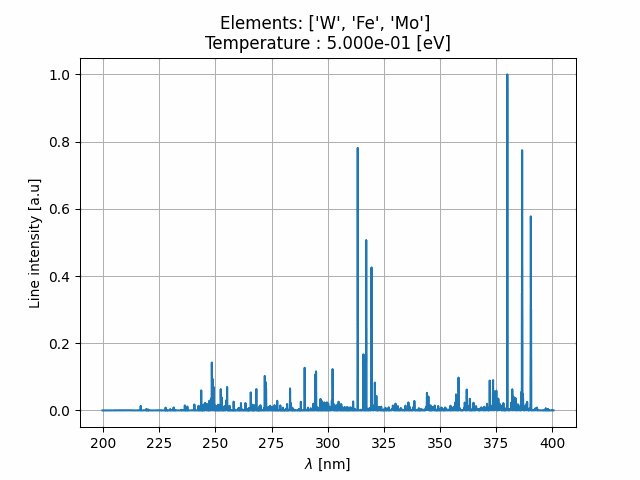
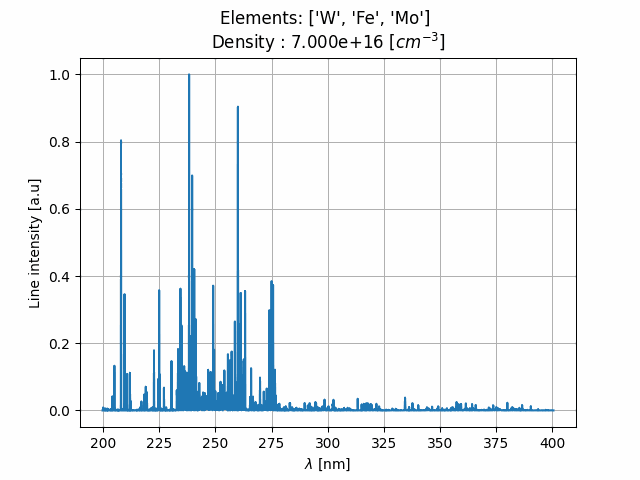
SimulatedLIBS can be helpful in creating LIBS animations mostly for educational purpose.
Resolution animation
Changes in resolution in range: 500-10000.
Electron temperature animation
Changes in electron temperature Te in range: 0.5-5 eV.
Electron density animation
Changes in electron density Ne in range: 0.7-1.3 e+17 [cm^-3].
References
- M. Kastek, et al., Analysis of hydrogen isotopes retention in thermonuclear reactors with LIBS supported by machine learning. Spectrochimica Acta Part B Atomic Spectroscopy 199: 106576. DOI: 10.1016/j.sab.2022.106576.
Used in Research
- Chen Z, Chen Z, Jiang W, Guo L, Zhang Y. Line intensity calculation of laser-induced breakdown spectroscopy during plasma expansion in nonlocal thermodynamic equilibrium. Opt Lett. 2023 Jun 15;48(12):3227-3230. DOI: 10.1364/OL.488250.


Download files
Download the file for your platform. If you're not sure which to choose, learn more about installing packages.
Source Distribution
Built Distribution
Filter files by name, interpreter, ABI, and platform.
If you're not sure about the file name format, learn more about wheel file names.
Copy a direct link to the current filters
File details
Details for the file SimulatedLIBS-1.1.0.tar.gz.
File metadata
- Download URL: SimulatedLIBS-1.1.0.tar.gz
- Upload date:
- Size: 7.9 MB
- Tags: Source
- Uploaded using Trusted Publishing? No
- Uploaded via: twine/4.0.2 CPython/3.11.4
File hashes
| Algorithm | Hash digest | |
|---|---|---|
| SHA256 |
66ff9cb2081a9bb6dd3991b9ff6c1165338ccf9cd18a95c6fd8a19f5dc7a6d9e
|
|
| MD5 |
d30692ef50e554113ea3f03fb9375b9c
|
|
| BLAKE2b-256 |
3055baa065edffe6fdc40ddc096aaf4cc9eda399f9d625e59bf9b3dc1c678ed0
|
File details
Details for the file SimulatedLIBS-1.1.0-py3-none-any.whl.
File metadata
- Download URL: SimulatedLIBS-1.1.0-py3-none-any.whl
- Upload date:
- Size: 9.6 kB
- Tags: Python 3
- Uploaded using Trusted Publishing? No
- Uploaded via: twine/4.0.2 CPython/3.11.4
File hashes
| Algorithm | Hash digest | |
|---|---|---|
| SHA256 |
3e5cc39d40ac805e645668af590910a21977502396f9754c67dd4ace951df542
|
|
| MD5 |
8db633f20412f1eb2bbbc4d65d2ca5fd
|
|
| BLAKE2b-256 |
0d4c1d03802fba45205985e7f853cb941c26877ed7f37166b8518a97fca42329
|


