
a-token-monitor




English | 中文
One local dashboard for every coding agent you pay for. Quota windows, live sessions, token spend and suspicious uploads for Codex, Claude Code, Grok, Kimi Code and seven more agents, on one always-on page. Nothing leaves your machine, and it runs on the Python standard library alone.
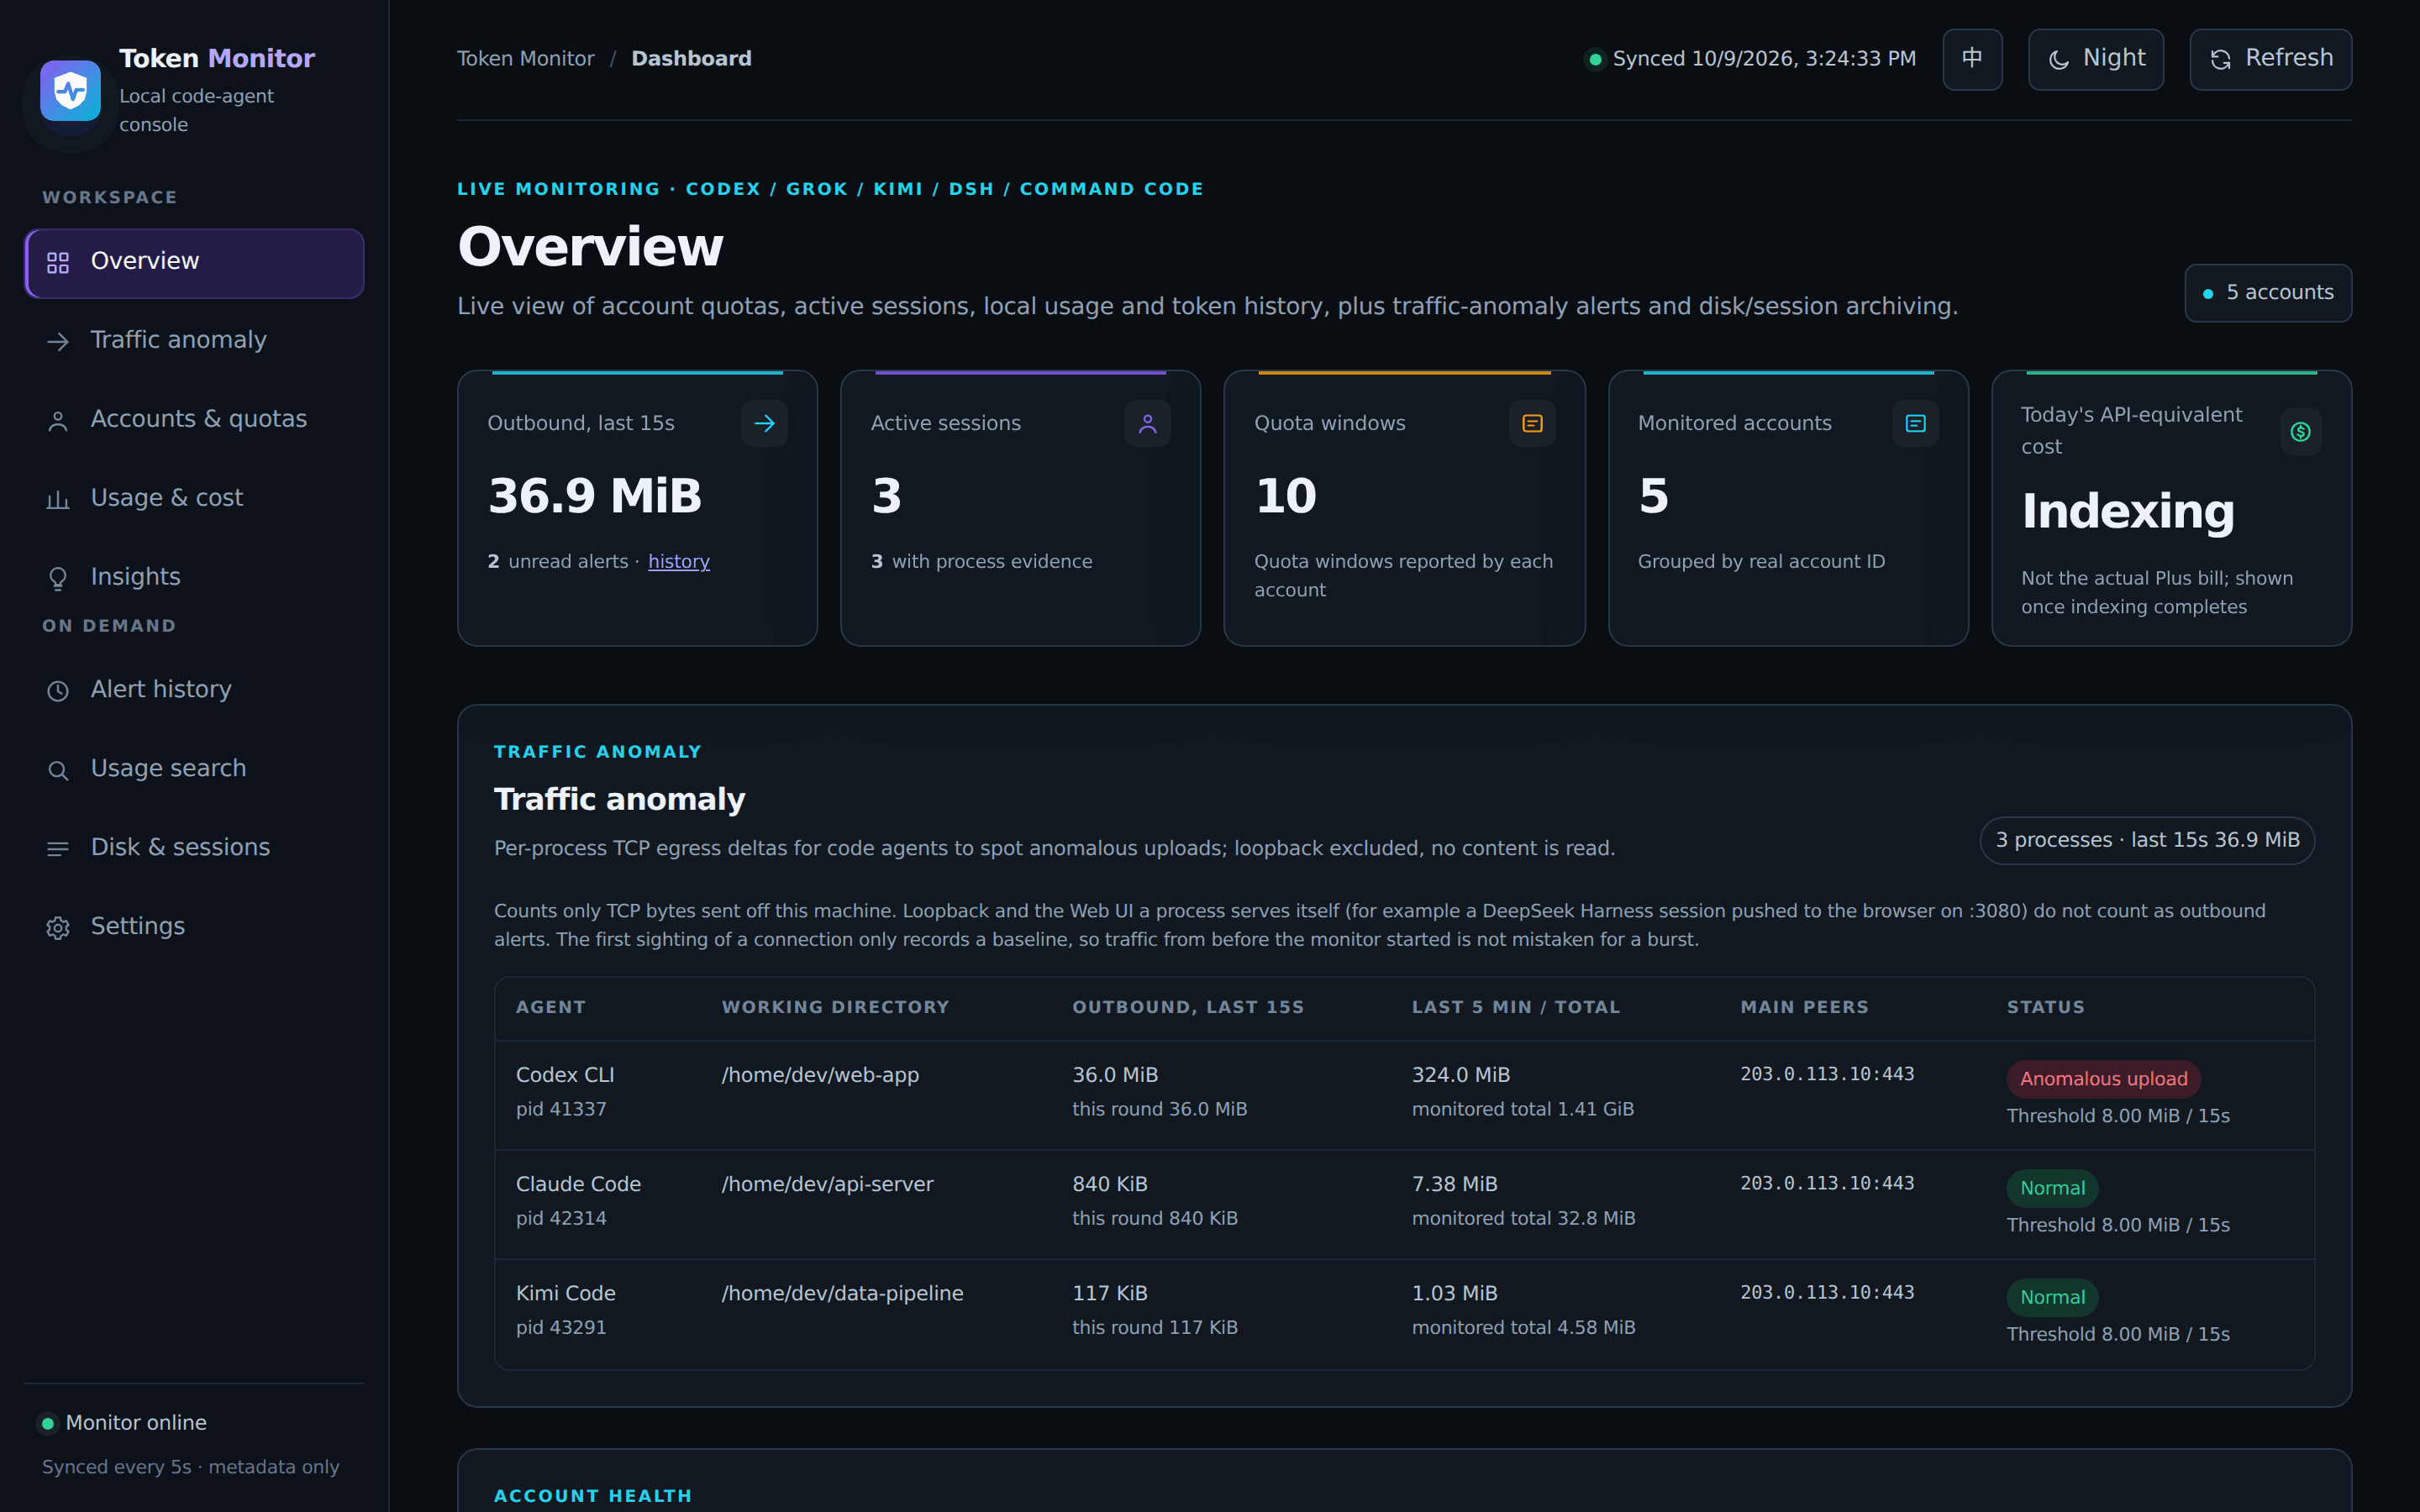
Screenshots use demo data generated by
docs/screenshots/generate.py; no real account is shown.
Quick start
pip install a-token-monitor
a-token-monitor daemon --dashboard
Open http://127.0.0.1:8765/. Agents in their default locations (~/.codex,
~/.claude, ~/.grok, ~/.kimi-code and the rest) are detected automatically, with no
configuration file. To keep it running after you close the terminal, install it as a
background service with a-token-monitor service install --dashboard (systemd, launchd
or a Windows scheduled task).
Signature features
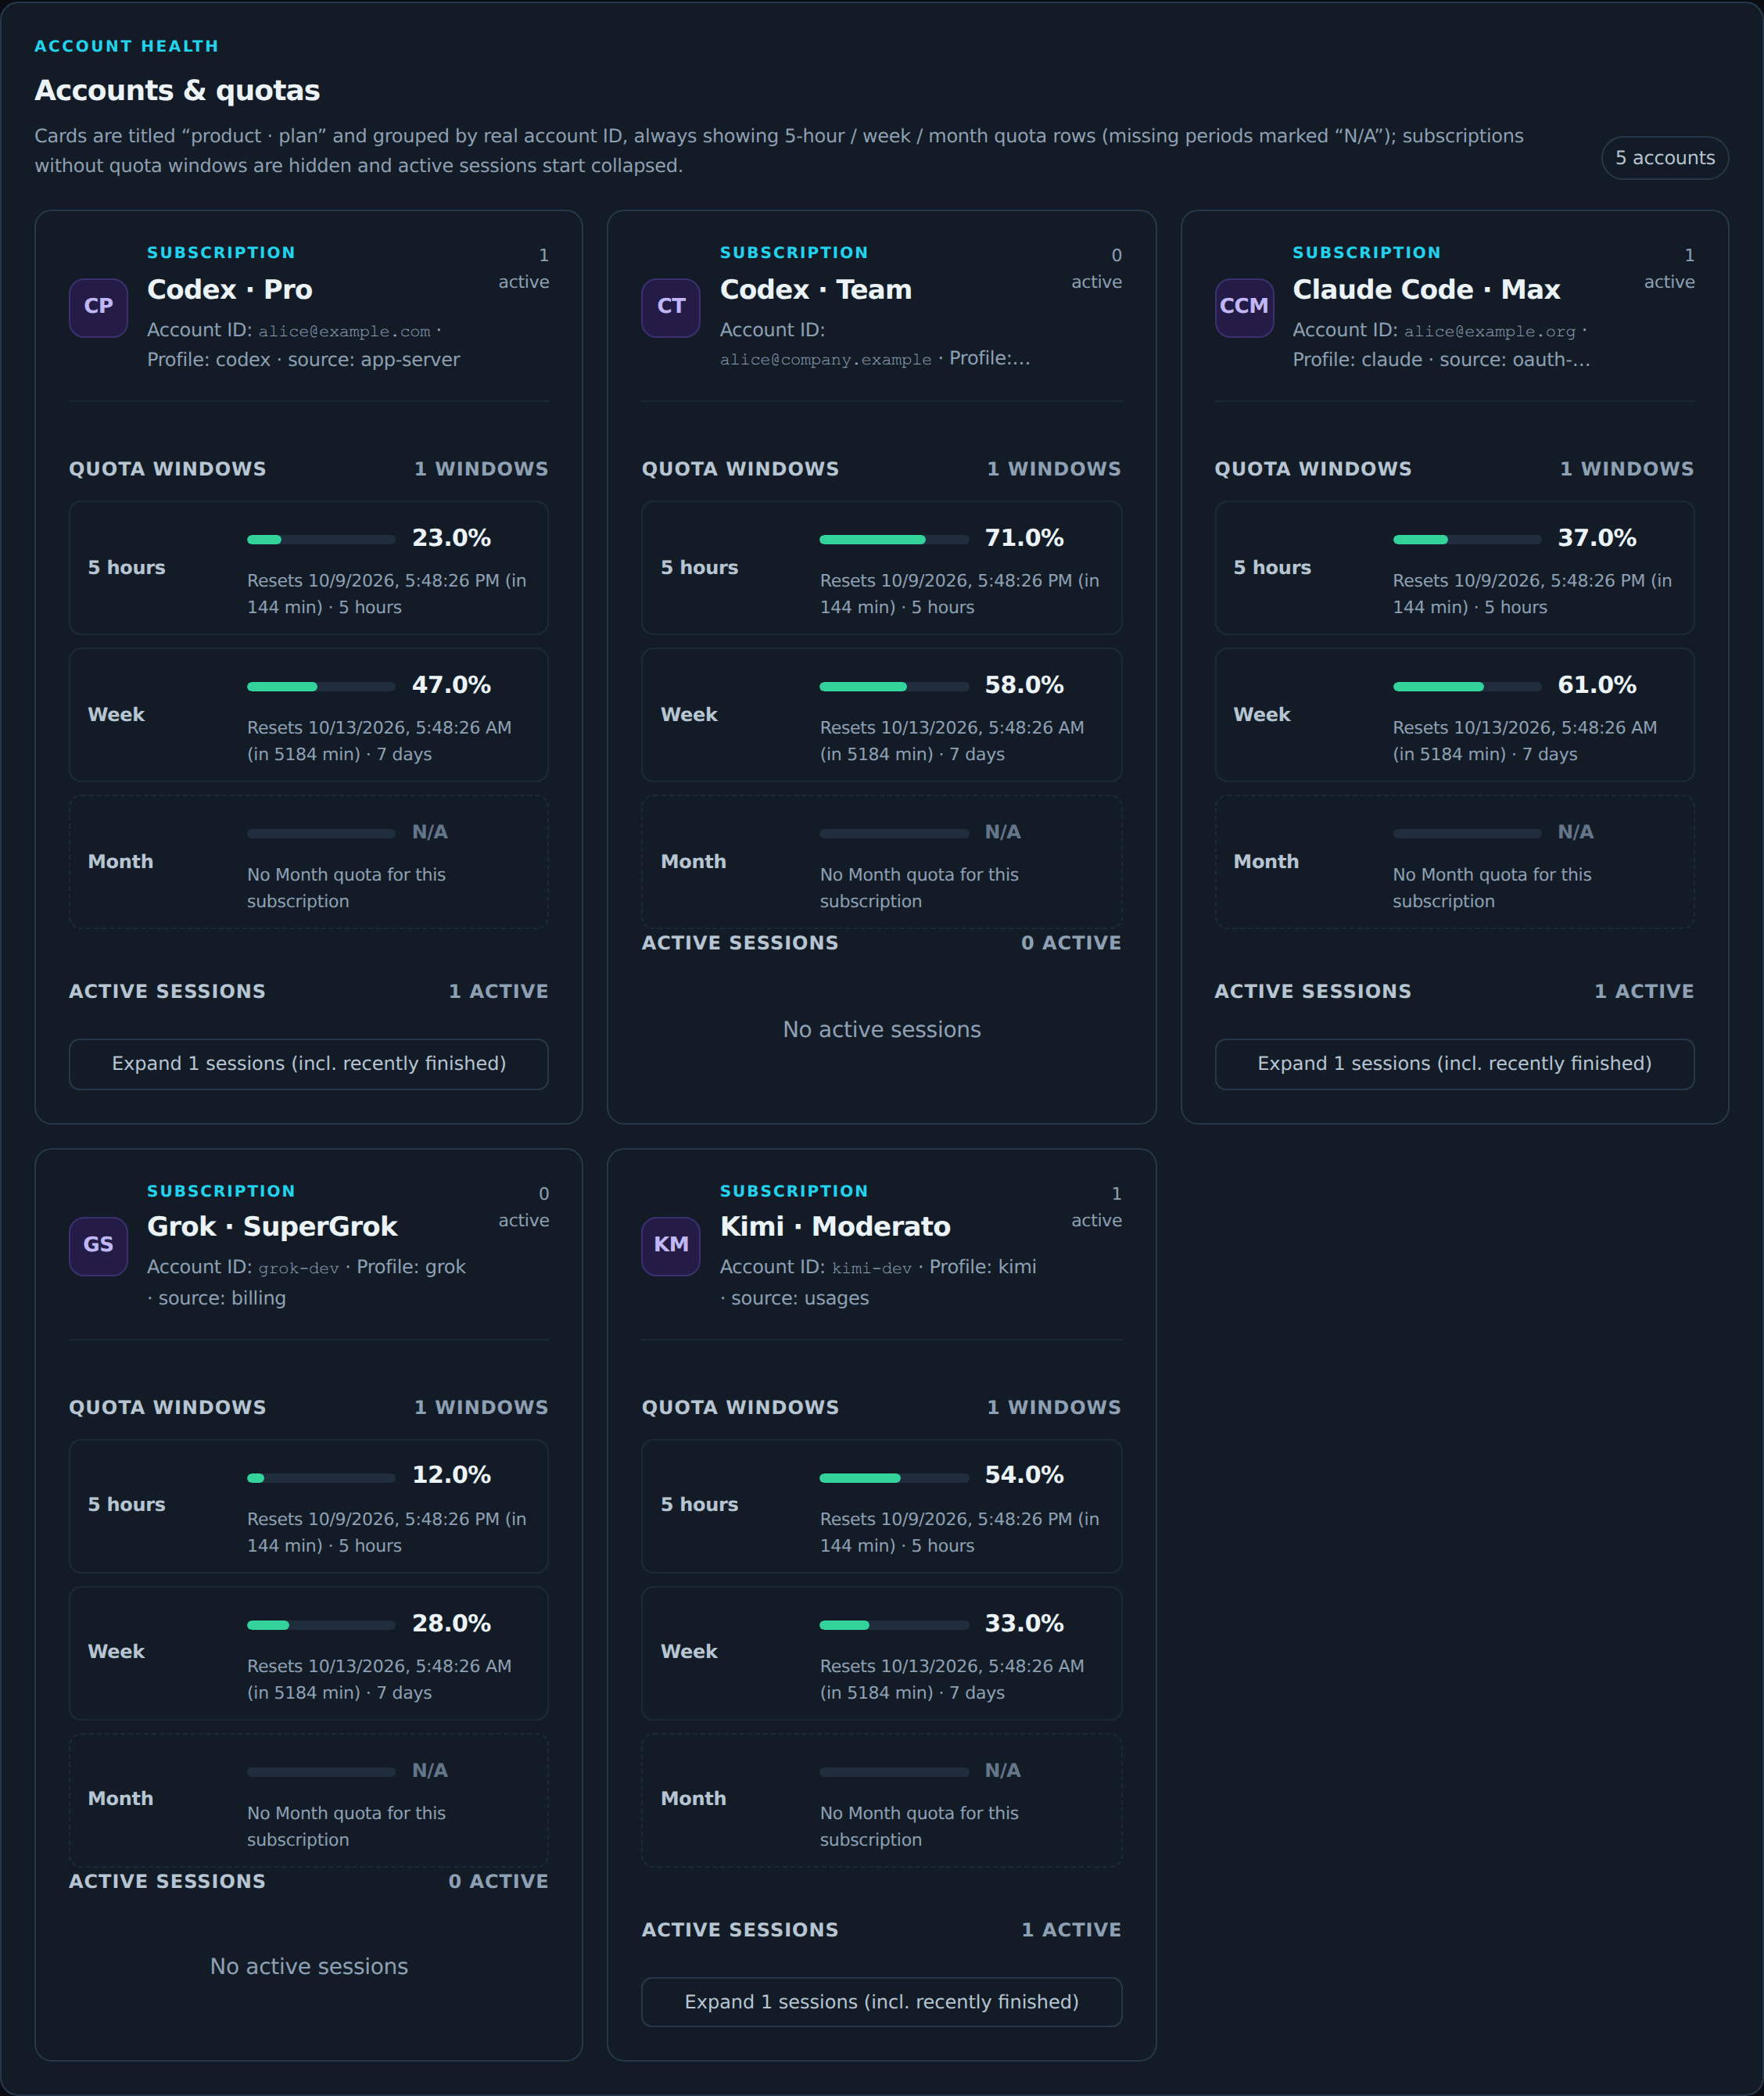
Multiple accounts from the same vendor, told apart
Run a personal and a work subscription of the same agent side by side: pass one data
directory per account (--codex-home ~/.codex --codex-home ~/.codex-work, and the same
for --claude-home, --kimi-home and the rest, or add them in the settings page).
Each account is identified by the ID in its own login data, gets its own card with its
own quota windows and plan, and its sessions and token usage are counted separately.
Two directories logged into the same account merge into one card, and after you switch
accounts in a directory, earlier sessions stay with the account that ran them.
Session disk analysis
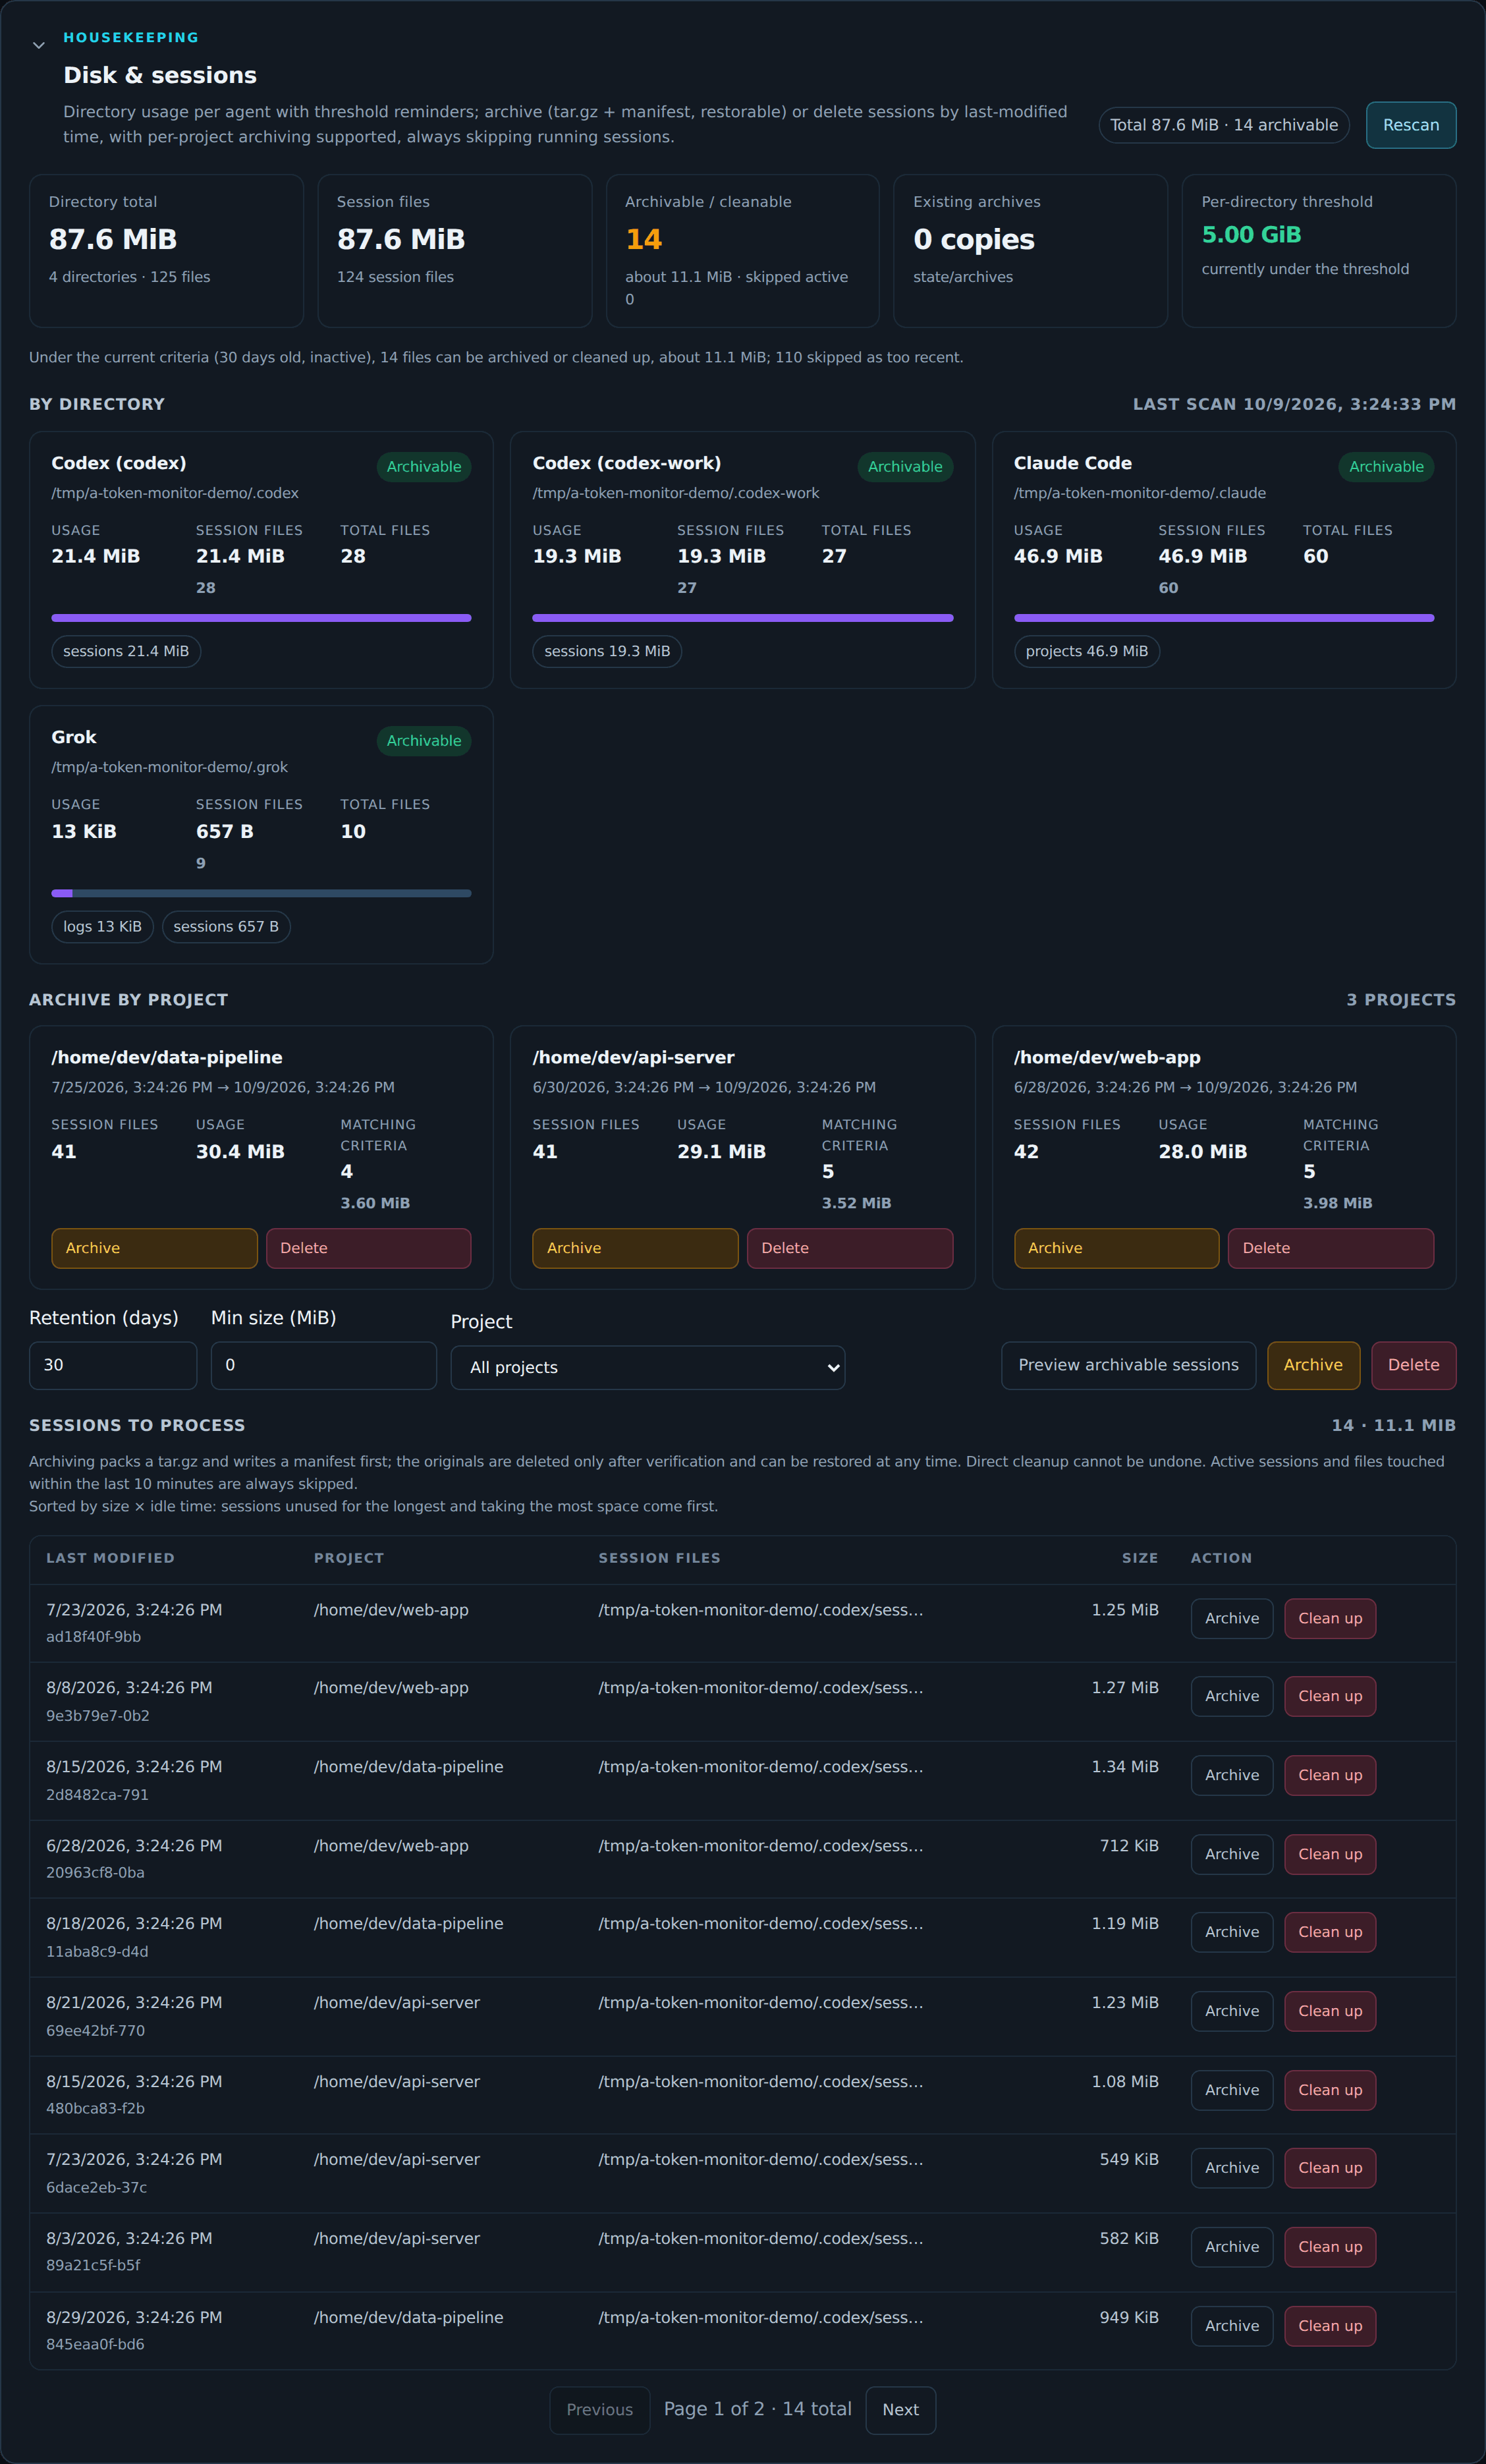
Agent data directories grow quietly: every session leaves a log, often megabytes each.
The disk page shows how much space each agent and account uses, warns when a directory
passes a threshold (5 GiB per directory, 10 GiB in total by default), and lists the
sessions you can archive, sorted so the largest and longest-idle come first. Archive or
clean up by project or one session at a time: archives are tar.gz files with a SHA-256
manifest and can be restored, and running sessions or files touched in the last
10 minutes are always skipped. a-token-monitor disk gives the same report in the
terminal.
Upload monitoring for agents
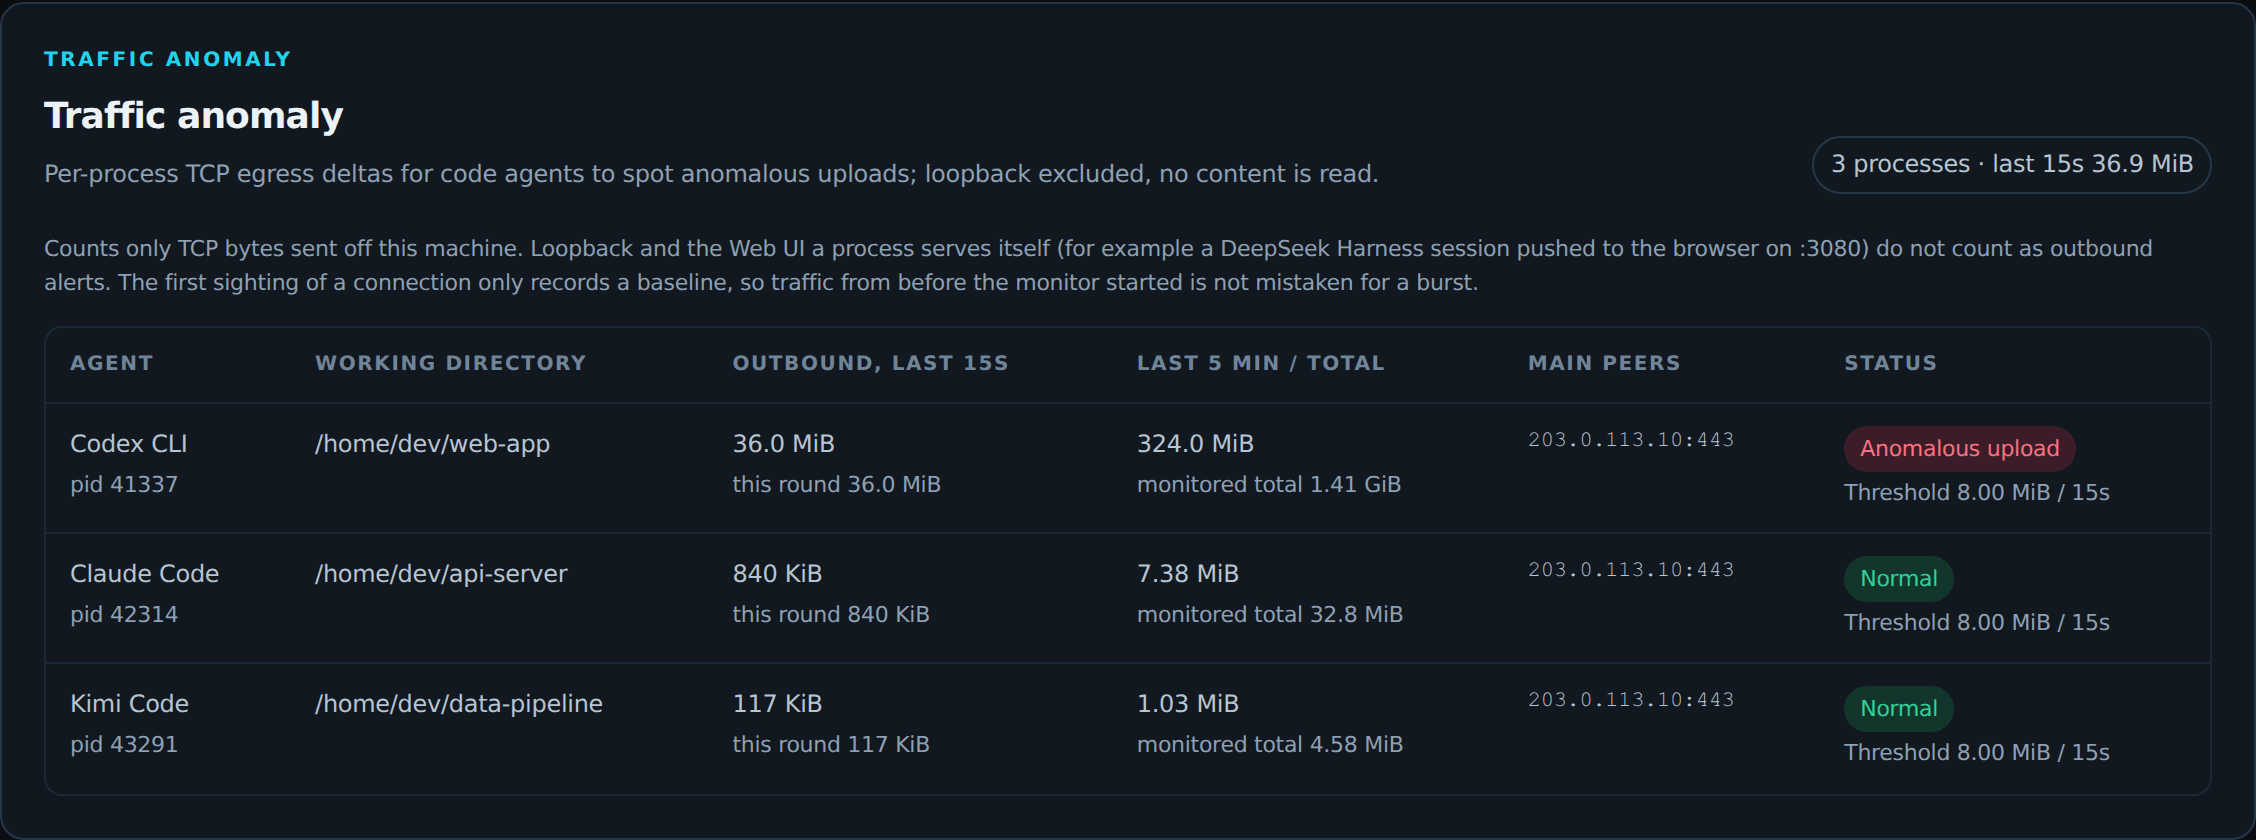
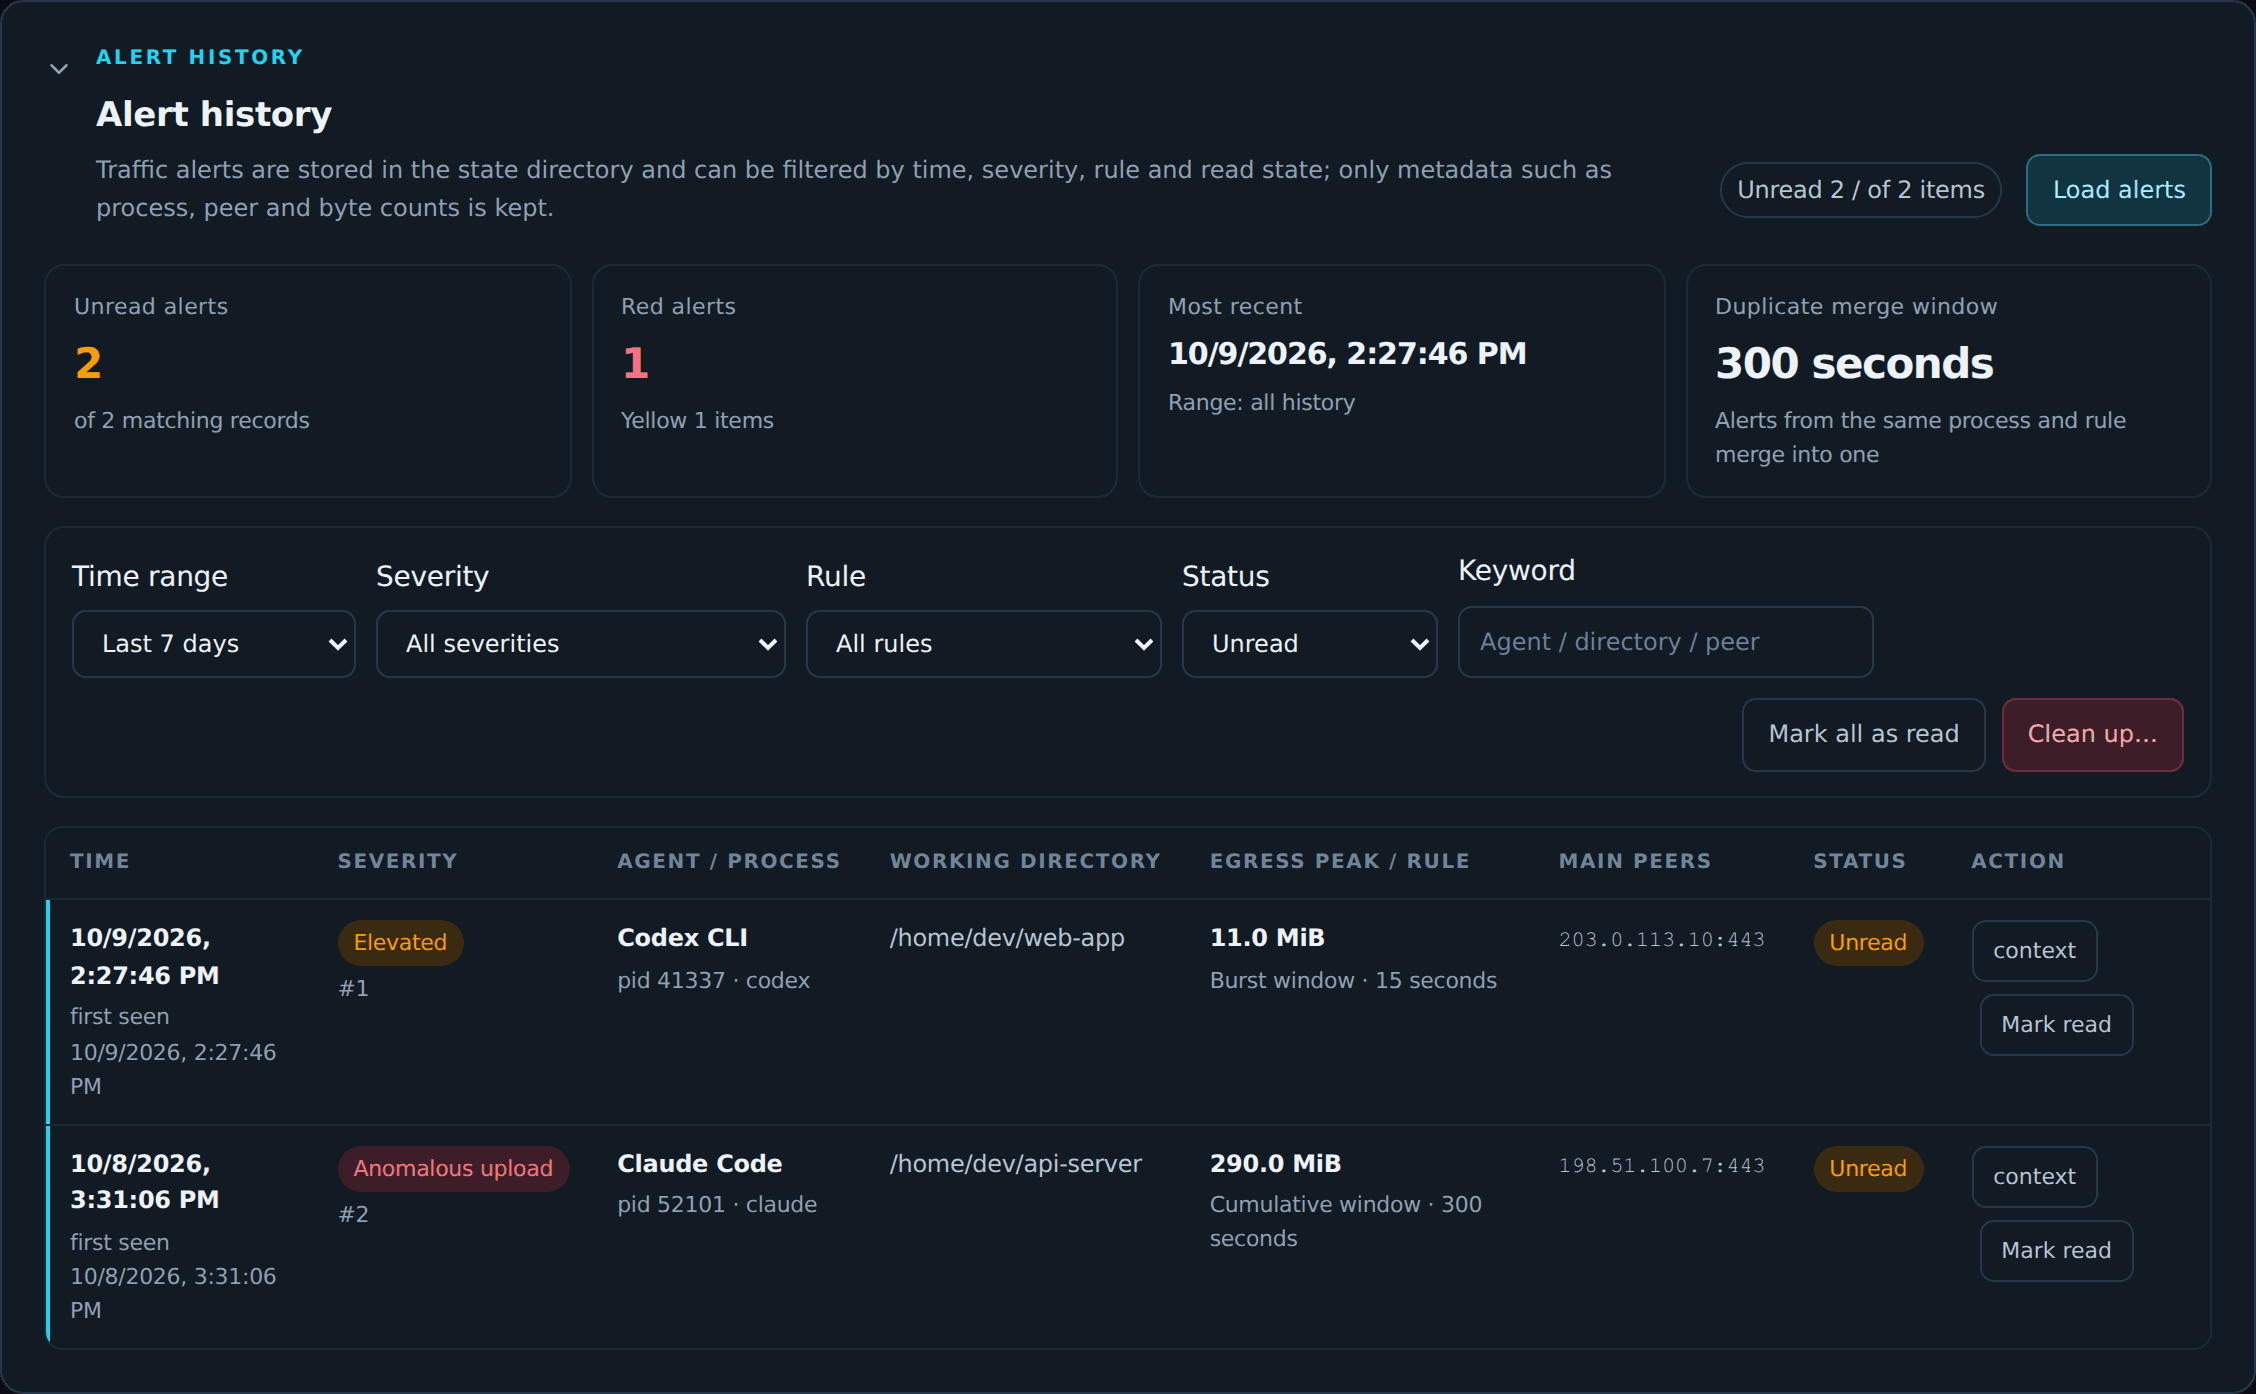
Coding agents send your code to remote APIs, and it is worth knowing when one sends far more than usual. On Linux, outbound TCP bytes are counted per agent process (loopback excluded, contents never read), with a 15-second burst threshold and a 5-minute cumulative threshold. Alerts are kept in a searchable history, and each one can be linked to the local session that was running in that directory at the time, summarised as actions such as "pushed code" or "read a file". Each alert also gets a likely cause: a long context re-uploaded with every model request, large new content such as images or tool output, or traffic the session log cannot account for, with the numbers behind it and a tip. On macOS and Windows the panel lists agent processes and their connections without byte counts.
Why use it
- Stop guessing how much quota is left. Codex, Claude Code, Grok, Kimi Code and Command Code are read from each vendor's own read-only quota API: 5-hour, weekly and monthly windows, reset times and plan names, side by side for every account.
- See where the tokens actually went. Local session logs are indexed per request into tokens and API-equivalent cost, by day, account, model and project, with a monthly budget bar, cache savings and a searchable history.
- Catch runaway sessions early. A session counts as active only while a process has its file open. Sessions that run too many turns or carry too much context get a "start a new session" nudge.
- Install it and forget it. Eleven agents, many accounts, zero runtime dependencies; Chinese and English UI, light and dark themes.
Amounts are API-equivalent estimates from each vendor's public price list; they use a different meter from your subscription bill.
A quick tour
Usage and API-equivalent cost
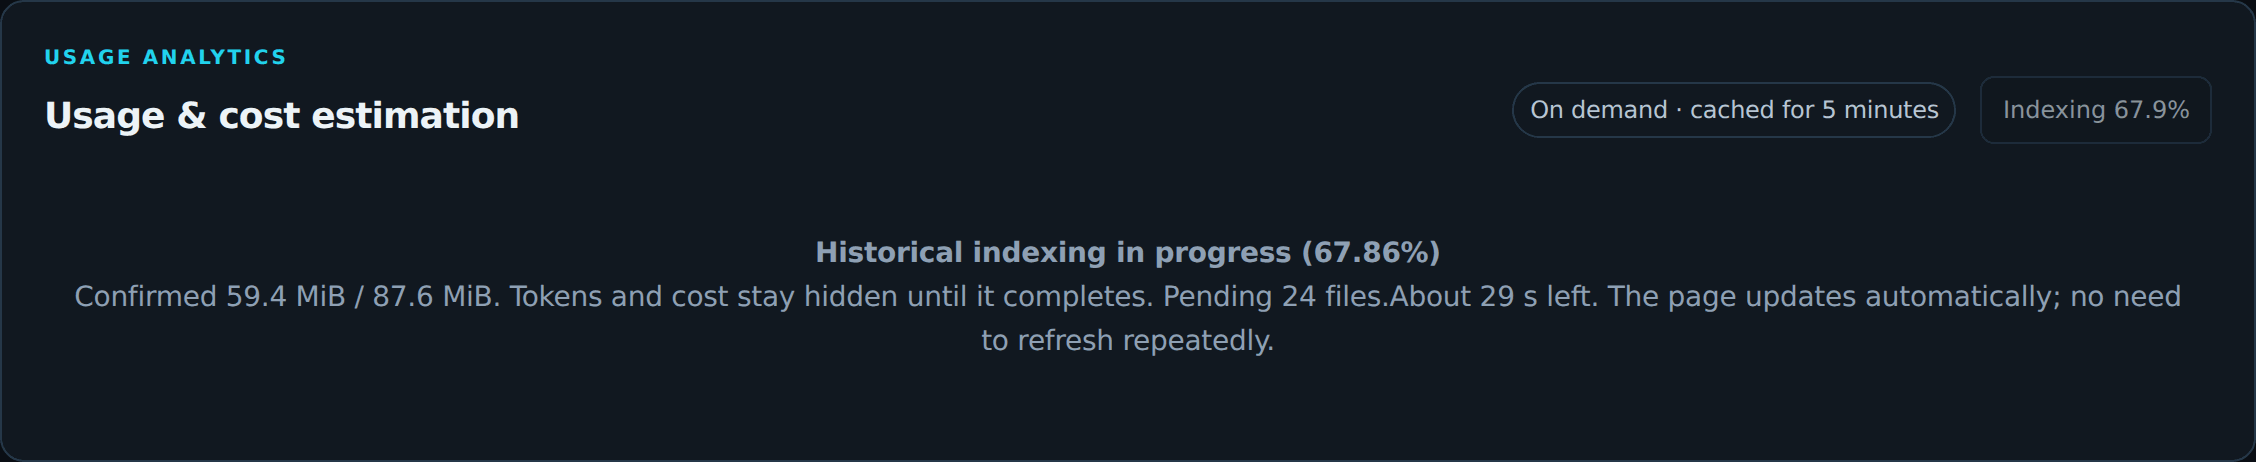
A 30-day cost trend, then the same numbers by account, model or project, with filters, Top 5 rankings and a monthly budget.
Habits and token-saving tips
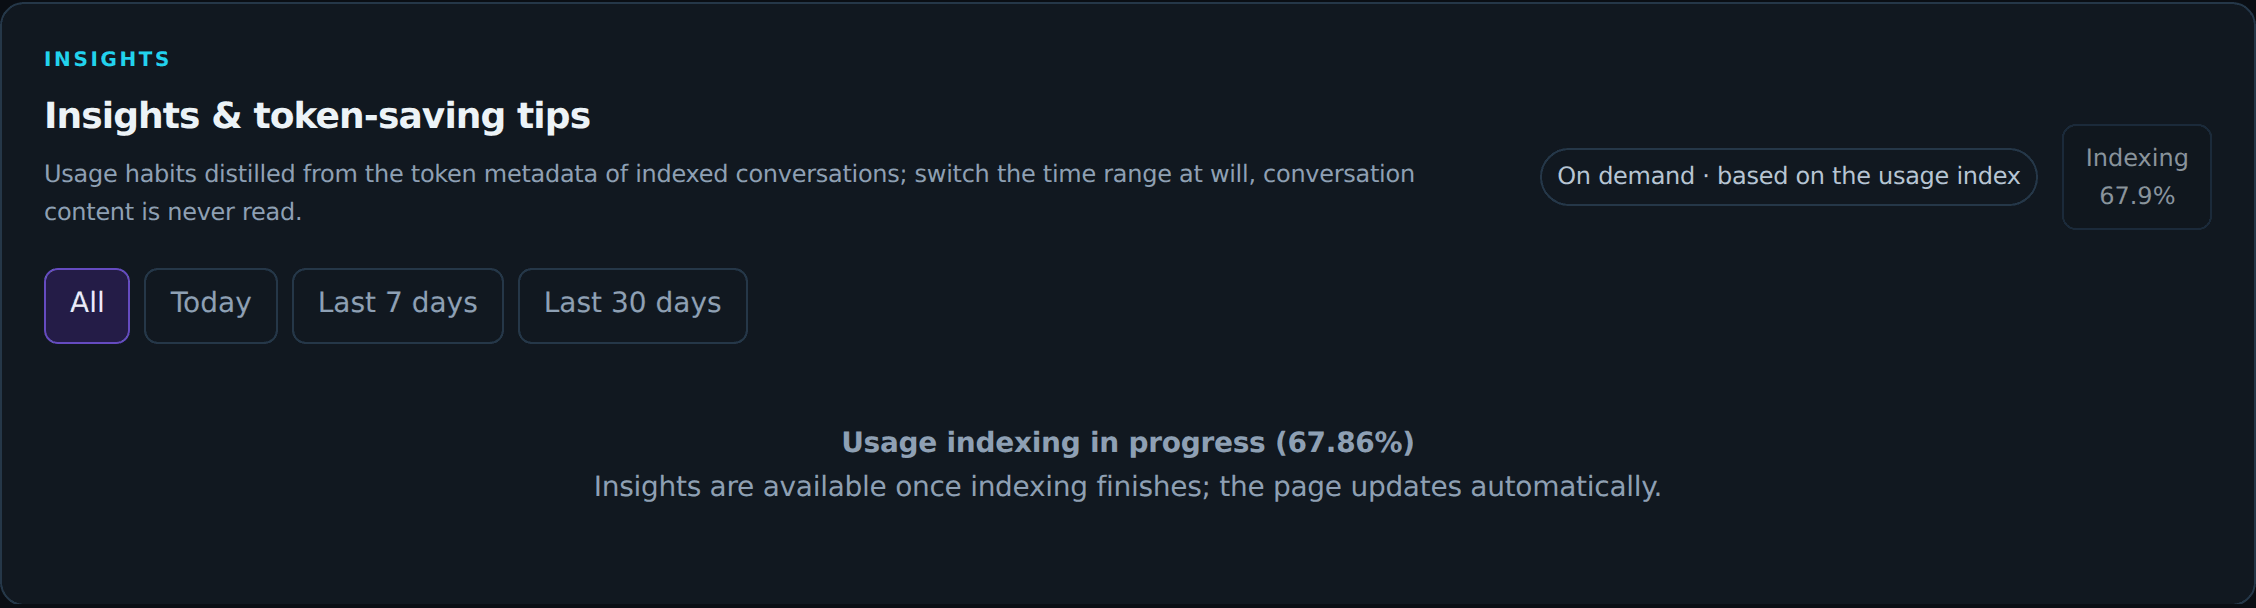
Built from token metadata only (prompts are never read): busiest hours, cost by model, conversation sizes, the most expensive conversations, and concrete advice on where tokens can be saved.
Compared with similar tools
Most tools in this space do one job: on-demand reports from local logs (ccusage), or a live gauge for one or two vendors (Claude Code Usage Monitor, tokmeter, CodexBar, and similar). This project keeps quotas, sessions, usage, traffic and disk in one always-on process.
| Capability | a-token-monitor | ccusage | Quota / burn-rate tools |
|---|---|---|---|
| Form | Always-on daemon, web Dashboard, CLI | On-demand CLI reports | TUI, menu bar, or one-shot dashboard |
| Runtime dependencies | Python standard library only | Node.js | Varies |
| Official quota windows | Codex / Grok / Kimi / Command Code / Claude Code | Mostly local logs | Usually one or two vendors |
| Local token usage | 11 agents, incremental searchable index | Broader log coverage, one-shot reports | Usually one or two |
| Live sessions | Files the process actually has open | No live discovery | Rare |
| Traffic anomalies | Per-process egress bytes on Linux, with activity context | No | No |
| Session archives | Preview, archive, restore; skips live files | No | No |
| Chinese UI | CLI, API, Dashboard | English-first | Varies |
One-shot history across many CLI log formats: ccusage. Quotas, sessions, traffic and disk that stay on screen: this tool.
Installation
Python ≥ 3.10 is required; only the standard library is used, with no third-party runtime dependencies:
pip install a-token-monitor
# or install it isolated with pipx
pipx install a-token-monitor
From source (development):
conda env create -f environment.yml   # or use your current Python
conda activate a-token-monitor
python -m pip install -e .
Usage
Global options go before the subcommand. The default state directory is
~/.a-token-monitor and the default account directory is ~/.codex; --codex-home,
--grok-home, --kimi-home and friends can be repeated for multiple directories.
# Show the current account quotas
a-token-monitor quota --json

# Discover active sessions once
a-token-monitor sessions --json

# Scan local code-agent processes for traffic anomalies (1 second between samples by default)
a-token-monitor traffic --json

# Query / clear persisted traffic alerts
a-token-monitor alerts --days 7 --unread
a-token-monitor alerts --ack-all
a-token-monitor alerts --clear-before 30 --dry-run

# Search token usage history (by date, model, account, session)
a-token-monitor usage --days 30 --group model --sort tokens
a-token-monitor usage --account account-work --group model

# Inspect agent data-directory usage, disk reminders and archivable sessions
a-token-monitor disk --days 30

# Session archiving (preview first, --yes actually runs it) and restore
a-token-monitor sessions --archive --older-than 30
a-token-monitor sessions --archive --older-than 30 --yes
a-token-monitor sessions --restore ~/.a-token-monitor/archives/sessions-<timestamp>.tar.gz

# Keep monitoring several accounts and start the web Dashboard
a-token-monitor \
  --codex-home "$HOME/.codex" \
  --codex-home "$HOME/.codex-work" \
  --commandcode-home "$HOME/.commandcode" \
  daemon \
  --dashboard \
  --dashboard-port 8765
The Dashboard is served at http://127.0.0.1:8765/ by default; pages and endpoints are
embedded in the daemon, so no separate front-end service is needed.
--dashboard-host 0.0.0.0 exposes it to the local network (for example to reach WSL from
Windows) — the page has no authentication by default, so make sure the network is
trusted first.
Update notifications
A newer release is reported on both sides: the Dashboard keeps a small update button in
the top bar, and every CLI command prints a one-line reminder on stderr once per version.
The button is always there — it reads Check for updates before the first check, Up to date afterwards, and turns cyan with the version number once a newer release exists — and
clicking it checks again whenever the cached result is stale. The check reads GitHub
Releases first, then GitHub tags, then PyPI, and stores the result in the state directory,
so day-to-day commands read a cache instead of waiting on the network.
# Check now and print the release notes of the new version
a-token-monitor update --notes

# Machine-readable result; the exit code stays 0 even when the check fails
a-token-monitor update --json

# Read the cached result only, without any network access
a-token-monitor update --cached

# Run the detected upgrade command (pip / pipx / git pull), then restart
a-token-monitor update --upgrade
The panel behind the button shows when the last check ran, links to the release notes and
prints the exact upgrade command for how this copy was installed (pip, pipx or a source
checkout), ready to copy; Ignore this version only drops the highlight, so the version and
the command stay available. The version you are running is printed at the bottom of the
sidebar. Pass --no-update-check (or set
A_TOKEN_MONITOR_NO_UPDATE_CHECK=1) to turn the automatic reminder off, and set
GITHUB_TOKEN if you hit GitHub API rate limits.
Common tuning flags
| Flag | Default | Description |
|---|---|---|
--budget-usd |
none | Monthly API-equivalent budget; warning at 80%, alert at 100% |
--upload-warn-mb / --upload-alert-mb |
8 / 32 | Warning / alert threshold for MiB sent by one process within 15 seconds |
--upload-window-warn-mb / --upload-window-alert-mb |
64 / 256 | Warning / alert threshold for MiB accumulated over 5 minutes |
--disk-warn-gb / --disk-total-warn-gb |
5 / 10 | Disk reminder thresholds for a single directory / all directories (GiB) |
--session-turn-warn |
100 | Suggest a new session once a session reaches this many turns |
--session-context-warn-tokens |
200000 | Suggest a new session once the latest context reaches this many tokens |
--usage-retention-days / --session-retention-days |
90 / 30 | Retention days for the usage index / finished session history (editable in the settings page) |
--alert-retention-days |
30 | Retention days for traffic alerts |
--lang en / --lang zh |
auto | Force the CLI and Dashboard language |
--no-update-check |
off | Skip the version check and the update reminder (A_TOKEN_MONITOR_NO_UPDATE_CHECK=1 also works) |
All of these work on both daemon and service install.
Dashboard details
- Accounts & quotas: one card per subscription, always showing the
5 hours / week / monthrows (missing periods are marked “N/A” and cards stay strictly aligned); the card title is the subscription type (product · plan) while the account ID and profile move to a secondary line. Codex plan names are read from thechatgpt_plan_typeclaim ofid_tokenin the localauth.json(the token content itself is not parsed); Grok and Command Code use the plan names returned by their own quota endpoints, and Claude Code uses the subscription type (Pro / Max, …) stored in its local credentials. - Usage & cost estimation: switch between the account / model / project dimensions with one set of aggregation rules; filters stack, the table ends with a total row and share percentages, and the Top 5 accounts and projects by cost are always shown.
- Usage search: query the usage index directly by time range, model, account and
keyword, with four summary views, paging and per-session drill-down;
GET /api/usage/searchexposes the same capability. - Alert history / traffic anomalies: a live process table plus persisted alerts searchable by time, severity, rule, read state and keyword, with read-state marking and range deletion.
- Collapse on demand: “Alert history”, “Usage search” and “Disk & session management” start collapsed into a single summary line and only fetch details when expanded; the expanded state is remembered in the browser.
Alert details correlate local sessions by working directory and time window, prioritizing
actions and object types such as initiating an image upload, pushing code, reading code,
or providing an image to the model. Details currently cover Codex, Claude Code, Kimi
Code, Command Code, Grok, DeepSeek Harness, OpenCode, Cursor, Gemini CLI, Qwen
Code, and Aider. The alerts command prints the same activity summary under each alert. Image
inputs come from recorded image message blocks;
other purposes are inferred from recognizable parameters, with the evidence shown alongside.
Local file reads are not labeled as uploads, unrecognized purposes remain unknown, and
outputs are linked to their originating purposes by call ID. Timestamps and local record
byte counts are also shown. These are local activity clues, not proof of the
actual network payload. This feature reads session logs on demand; message, tool argument,
and search excerpts are hidden from the page and API by default and are never persisted.
To show message excerpts and target filenames, add --alert-context-content to daemon or service install.
It requires a loopback listening address, redacts common tokens, passwords, and API keys
before truncation, and cannot be combined with --dashboard-host 0.0.0.0.
Archive, cleanup, and restore operations run serially. Before deleting an original session, its activity and file signature are checked again; files changed or resumed during compression are preserved. The archive and manifest are saved before deletion, and restore verifies the archive SHA-256 recorded in the manifest; legacy archives without a digest remain restorable. Directory changes apply to quotas, active sessions, indexing, and alert details.
Usage summaries reuse per-file incremental pricing buckets while keeping cache and long-context pricing per request. SQLite performs grouping, sorting, and pagination; each response includes the current page and complete filtered totals. Concurrent dashboard refreshes share a state snapshot, and browser polling does not overlap slow requests.
Settings page
A separate /settings page with two blocks:
- Scan directories: view, add, edit and remove the data directories of each provider
(Codex / Grok / Kimi Code / DeepSeek Harness / Command Code / Claude Code / OpenCode /
Cursor / Gemini CLI / Qwen Code / Aider). Changes are
hot-reloaded without restarting the daemon and without losing usage-index checkpoints.
Priority is web config > CLI flags > auto-detection, persisted in
scan-dirs.jsonin the state directory; clearing a provider's directories disables it explicitly, and “Reset” falls back to the CLI flags or auto-detection. Safety limits: only directories that exist, are readable and live inside the current user's home are accepted; sensitive directories such as~/.sshand the state directory itself cannot be configured, and the page offers no arbitrary path browsing. - History data: shows the disk usage of the state directory and each index, and edits
the retention of the usage index (90 days by default), session history (30 days
by default) and alert history (30 days by default) online, persisted in
settings.json. Priority is web config > CLI flags > defaults.--alert-retention-daysis the initial alert-history value when the page has not saved an override. Cleanup is previewed first (what will be deleted plus the expected space freed); the daemon cleans up automatically every day according to the effective retention and VACUUMs afterwards. Cleanup only removes expired rows and never touches active sessions or incremental-index checkpoints; a failed automatic cleanup records the reason and surfaces it in the Dashboard top bar.
Health checks
GET /healthz: liveness. Returns 200 while the main loop has a heartbeat inside the threshold (max(2 × scan interval, 120s)); returns 503 when it is stuck or has never completed a first pass.GET /readyz: readiness. Returns 503 when a critical component (the main loop) has failed or has not finished starting; the body carries per-component state (last success time, redacted latest error). A single non-critical component (one provider, traffic collection, the indexer, …) failing only shows as degraded and does not change the readiness status code.
The Dashboard top bar shows an “OK / partly degraded / starting / error” badge from these endpoints; click it for details about the failing components.
Supported providers
| Provider | Quota | Active-session evidence | Usage source |
|---|---|---|---|
| Codex | App Server account/rateLimits/read |
Open session JSONL + App Server state | Incremental session JSONL index |
| Grok | Quota endpoint (including plan name) | Open session files, falling back to working-directory matching | unified logs |
| Kimi Code | GET {base}/usages (including booster-wallet reconciliation) |
Open state.json / wire.jsonl |
wire logs |
| DeepSeek Harness | No local quota window | Open session.lock |
projcache |
| Command Code | /alpha/whoami, /alpha/billing/*, /alpha/usage/summary |
Open session JSONL, falling back to a working-directory lookup | Session JSONL |
| Claude Code | OAuth usage endpoint (5-hour / week / Design windows) | Open session JSONL (only the file header is read) | message.usage in session JSONL |
| OpenCode | No local quota window | Running process | Assistant tokens in opencode.db; only recorded requests count |
| Cursor | No local quota window | Open session file, falling back to working-directory matching | usage / tokens on a transcript line; otherwise 0, never estimated from text length |
| Gemini CLI | No local quota window | Open session file, falling back to working-directory matching | Token summary on chat records |
| Qwen Code | No local quota window | Open session file, falling back to working-directory matching | Same token summary parser as Gemini CLI |
| Aider | No local quota window | Open .aider.chat.history.md, falling back to {cwd}/.aider.chat.history.md |
> Tokens: lines in that file; counts of 1000 or more follow Aider's rounded display, not the raw API integer |
Shared rules:
- Every data directory is initialized independently: missing directories are skipped and read failures are only logged, without affecting other providers; the daemon still starts with no accounts at all (it then monitors traffic and disk only).
- Session detection never reads prompts or tool output; API keys / tokens are used only for authenticated requests and are never written to logs, return values or the Dashboard.
- When a Kimi access token expires it is refreshed with the same directory-lock protocol as the official CLI and written back atomically; every quota endpoint is cached (60 seconds on success, 15 seconds on failure) so that polling does not repeat requests.
- Claude Code quotas are read from
/api/oauth/usage(the same undisclosed endpoint the Claude Code/usagecommand uses, so it may change upstream): Linux / Windows read~/.claude/.credentials.json, macOS reads the “Claude Code-credentials” Keychain entry. An expired access token is not refreshed here (Claude Code refreshes it itself), and the endpoint rate-limits aggressively, so successful results are cached for 5 minutes and failures for 1 minute; when it is rate-limited or unreadable, only the account identity is shown and local usage statistics are unaffected.
Built-in unit prices cover the GPT-6 family (gpt-6.1-sol, gpt-6-astra/sol/luna), Xiaomi MiMo, Zhipu
GLM (the glm-5.3 family) and StepFun (step-5-preview); aggregator prefixes, letter
case and official snapshot suffixes all resolve to the same price. Claude Code amounts are
converted from Anthropic's public API prices, and cache writes are estimated at 1.25× the
input price.
Deployment and background service
Requirements
- Python ≥ 3.10, standard library only. The
python3shipped with macOS is usually 3.9, so use Homebrew / python.org / conda for 3.10+; on Windows, python.org, the Microsoft Store or conda all work. - SQLite's JSON1 extension speeds up aggregation; when it is missing, aggregation falls back to Python — nothing is lost, queries are just slower.
- The state directory is created as
0700and lock files and configuration files as0600; the daemon uses a file lock to guarantee a single instance per state directory.
Platform capability matrix
| Capability | Linux | macOS | Windows |
|---|---|---|---|
| Quota queries, usage index and search, alerts, disk and session management, Dashboard, health checks | ✅ | ✅ | ✅ |
| Active sessions and process evidence | ✅ /proc |
✅ ps + lsof |
✅ Toolhelp32 + Restart Manager |
| Traffic byte accounting | ✅ netlink INET_DIAG |
⚠️ lists processes and connections only, no byte counts | ⚠️ same as macOS |
| Background service | systemd user service | launchd LaunchAgent | Scheduled task (schtasks, starts at logon) |
| Single-instance lock | flock |
flock |
msvcrt.locking |
Linux (including WSL2)
a-token-monitor service install --dashboard --dashboard-port 8765
a-token-monitor service status
a-token-monitor service logs --lines 100
a-token-monitor service restart
a-token-monitor service stop
a-token-monitor service uninstall
WSL2 needs systemd=true in /etc/wsl.conf followed by a restart of the distribution.
The systemd unit is stored at ~/.config/systemd/user/a-token-monitor.service.
macOS
service takes exactly the same arguments as on Linux and writes a LaunchAgent:
a-token-monitor service install --dashboard --dashboard-port 8765
a-token-monitor service status
a-token-monitor service logs --lines 100
a-token-monitor service uninstall
- The LaunchAgent lives at
~/Library/LaunchAgents/com.a-token-monitor.daemon.plistand logs to~/.a-token-monitor/launchd.log. service plistprints the service definition for the current platform, for review or manual installation.- There is no netlink: the traffic panel and
trafficdegrade to listing processes and remote connections only (no byte counts, no traffic alerts) and state the reason explicitly. - Active sessions rely on the system
psandlsof; whenlsofis unavailable, sessions are still detected by directory but the “which session file is open” evidence is missing. - Claude Code quotas read the OAuth credential from the Keychain: on first access macOS shows an "allow Keychain access" dialog — pick Allow (it won't ask again); this is not a hang. Denying it only hides Claude quota; everything else keeps working.
Windows
pip install a-token-monitor
a-token-monitor service install --dashboard
a-token-monitor service status
a-token-monitor service logs --lines 100
a-token-monitor service uninstall
- The scheduled task is named
ATokenMonitor, starts at logon, runs withLeastPrivilegeand needs no administrator rights; its configuration is written back to<state_dir>\service.jsonand a backup of the task definition is kept at<state_dir>\a-token-monitor-task.xml. - Logs go to
<state_dir>\daemon.log, andservice logs --followpolls in Python instead of relying ontail. - Scheduled tasks have no POSIX-style graceful stop signal:
service stopis equivalent to ending the process, SQLite transactions and the single-instance lock are reclaimed by the system, and the next start resumes from the checkpoint. - Process discovery uses a Toolhelp32 snapshot plus the Restart Manager (to find out which process holds a session file); the working directory is inferred from the session file's own metadata.
- As on macOS there is no netlink, so traffic features degrade to process-only.
- Notes:
- When the Restart Manager is unavailable or a file is held by a higher-privilege process, the activity state of individual sessions may not be detected; quotas, the usage index and the Dashboard are unaffected.
- Volumes other than NTFS (FAT/exFAT, some network drives) have no stable file IDs, so log-rotation detection degrades to size/time comparison.
chmod 0700/0600on the state directory only affects the read-only bit on Windows and is not a permission boundary; useicaclsto tighten the ACLs if you need strict isolation.- Paths longer than 260 characters require
LongPathsEnabledon the system. - A CLI installed through an npm
.cmdwrapper is started withcmd.exe /cautomatically, and process matching also strips.exe/.cmd/.batsuffixes andnode .../cli.jswrappers. - Session files currently held open by an agent cannot be deleted: archiving/cleanup skips them with an explanation instead of aborting the whole batch.
- In a container or without scheduled tasks, run it in the foreground:
a-token-monitor ... daemon.
Containers
- Monitoring other agent processes requires sharing the host PID namespace:
docker run --pid=host ...; otherwise the usage index keeps working, but active sessions, process evidence and traffic attribution stay empty. - Mount the state directory read-write (for example
-v "$HOME/.a-token-monitor:/state"together with--state-dir /state); mount agent data directories read-only as needed. - Expose the Dashboard port with
-p 8765:8765, and pass--dashboard-host 0.0.0.0inside the container. - Without systemd/launchd, run
daemonin the foreground;/healthzand/readyzwork for container and reverse-proxy probes.
Data and security
Uninstalling the service never deletes monitoring data. Files in the state directory
(~/.a-token-monitor by default):
| File | Contents |
|---|---|
monitor.sqlite3 |
Session registry, quota snapshots and recovery records |
usage-index.sqlite3 |
Usage index and incremental-read checkpoints |
traffic-alerts.sqlite3 |
Traffic alert history |
service.json |
Daemon configuration saved by service install (identical on all three platforms) |
scan-dirs.json |
Web scan-directory overrides saved from the settings page |
settings.json |
Web retention overrides saved from the settings page |
archives/ |
Session archives: sessions-*.tar.gz (legacy codex-sessions-* archives still restore) plus .manifest.json |
Besides pages and read-only endpoints, the Dashboard accepts only a few write endpoints
(POST /api/alerts, POST /api/housekeeping, and the settings page's scan-directory and
history endpoints). All of them require Content-Type: application/json and enforce a
request-body size limit; POST to any other path returns 405. The page has no
authentication by default, so when you expose it to the local network with
--dashboard-host 0.0.0.0, make sure the other devices on that network are trusted.
Development
python -m pytest tests/ -q    # or python -m unittest discover -s tests -v
ruff check src tests
python -m mypy                # type check (scope in pyproject.toml)
python -m coverage run -m pytest -q && python -m coverage report
CI runs the same test suite across the full Linux / macOS / Windows × Python 3.10 / 3.13
matrix; platform-specific capabilities (symlinks, POSIX permission bits, /proc) are
skipped explicitly by test decorators. Coverage (78% floor) and mypy run once on
ubuntu / 3.13. See CONTRIBUTING.md for the code layout, how to add an
agent, and project conventions.
License
GNU General Public License v3.0 or later (GPL-3.0-or-later); see LICENSE for
the full terms.
Copyright (C) 2026 pantlive
You are free to use, modify and distribute this program; but when you distribute it or a modified version, you must license it under the GPL as well and provide the complete source code to recipients, without adding further restrictions.
1 maintainer

Metadata
1 maintainer
Release files for a-token-monitor 1.0.0
For a detailed explanation of source distributions (sdists) and built distributions (wheels), please see the package formats documentation.
Source distribution (sdist)
| File | Size | Uploaded | |
|---|---|---|---|
| a_token_monitor-1.0.0.tar.gz | 672.3 kB | Details |
Built distribution (wheel)
| File | Interpreter | ABI | Platform | Reset |
|---|---|---|---|---|
| a_token_monitor-1.0.0-py3-none-any.whl | Python 3 | none | any | Details |
Total release size: 1.2 MB
Release files / a_token_monitor-1.0.0.tar.gz
| Download URL | a_token_monitor-1.0.0.tar.gz |
|---|---|
| Size | 672.3 kB |
| Tags | Source |
|
SHA-256 checksum How to use checksums |
087cea957b5bfec2fb7b8531494462674f6fba748f1abf6a9cefcfd1e07fa05c
|
|
BLAKE2b-256 checksum How to use checksums |
0f5c6549aa6a64061b338f1c4697ea5927448d9889ad708c108ca01c1fb38f27
|
| Upload date | |
|
Uploaded using Trusted Publishing? What is trusted publishing? |
Yes |
| Uploaded via |
twine/7.0.0 CPython/3.13.14
|
Provenance
Provenance describes where a file came from. On PyPI, provenance is shared via attestations, which provide a verifiable record of the build or publishing details. View details, limitations and caveats.


PyPI Publish Attestation
PyPI verified that this artifact, at this checksum, originated from the publisher listed below.
Signed by GitHub Actions, verified by PyPI on Oct 10, 2026.
Transparency logRelease files / a_token_monitor-1.0.0-py3-none-any.whl
| Download URL | a_token_monitor-1.0.0-py3-none-any.whl |
|---|---|
| Size | 523.5 kB |
| Tags | Python 3 |
|
SHA-256 checksum How to use checksums |
3e7670a96a247fc931ffb070f527664fbb1d222de53b775b1538060542e4048a
|
|
BLAKE2b-256 checksum How to use checksums |
08c9def53324d7688d59932d733af0ae03dc2745bd185db32e93a74497e35f56
|
| Upload date | |
|
Uploaded using Trusted Publishing? What is trusted publishing? |
Yes |
| Uploaded via |
twine/7.0.0 CPython/3.13.14
|
Provenance
Provenance describes where a file came from. On PyPI, provenance is shared via attestations, which provide a verifiable record of the build or publishing details. View details, limitations and caveats.
PyPI Publish Attestation
PyPI verified that this artifact, at this checksum, originated from the publisher listed below.
Signed by GitHub Actions, verified by PyPI on Oct 10, 2026.
Transparency log












