The AB Testing Module is a comprehensive suite designed for analyzing and reporting A/B test experiments, featuring functions for statistical analysis, advanced modeling, and data visualization to transform experimental results into actionable insights.
Project description
AB Testing Module
Overview
The AB Testing Library is a comprehensive suite designed for analyzing and reporting A/B test experiments, featuring functions for statistical analysis, advanced modeling, and data visualization to transform experimental results into actionable insights.
Features
A/B Testing Function Documentation
Purpose
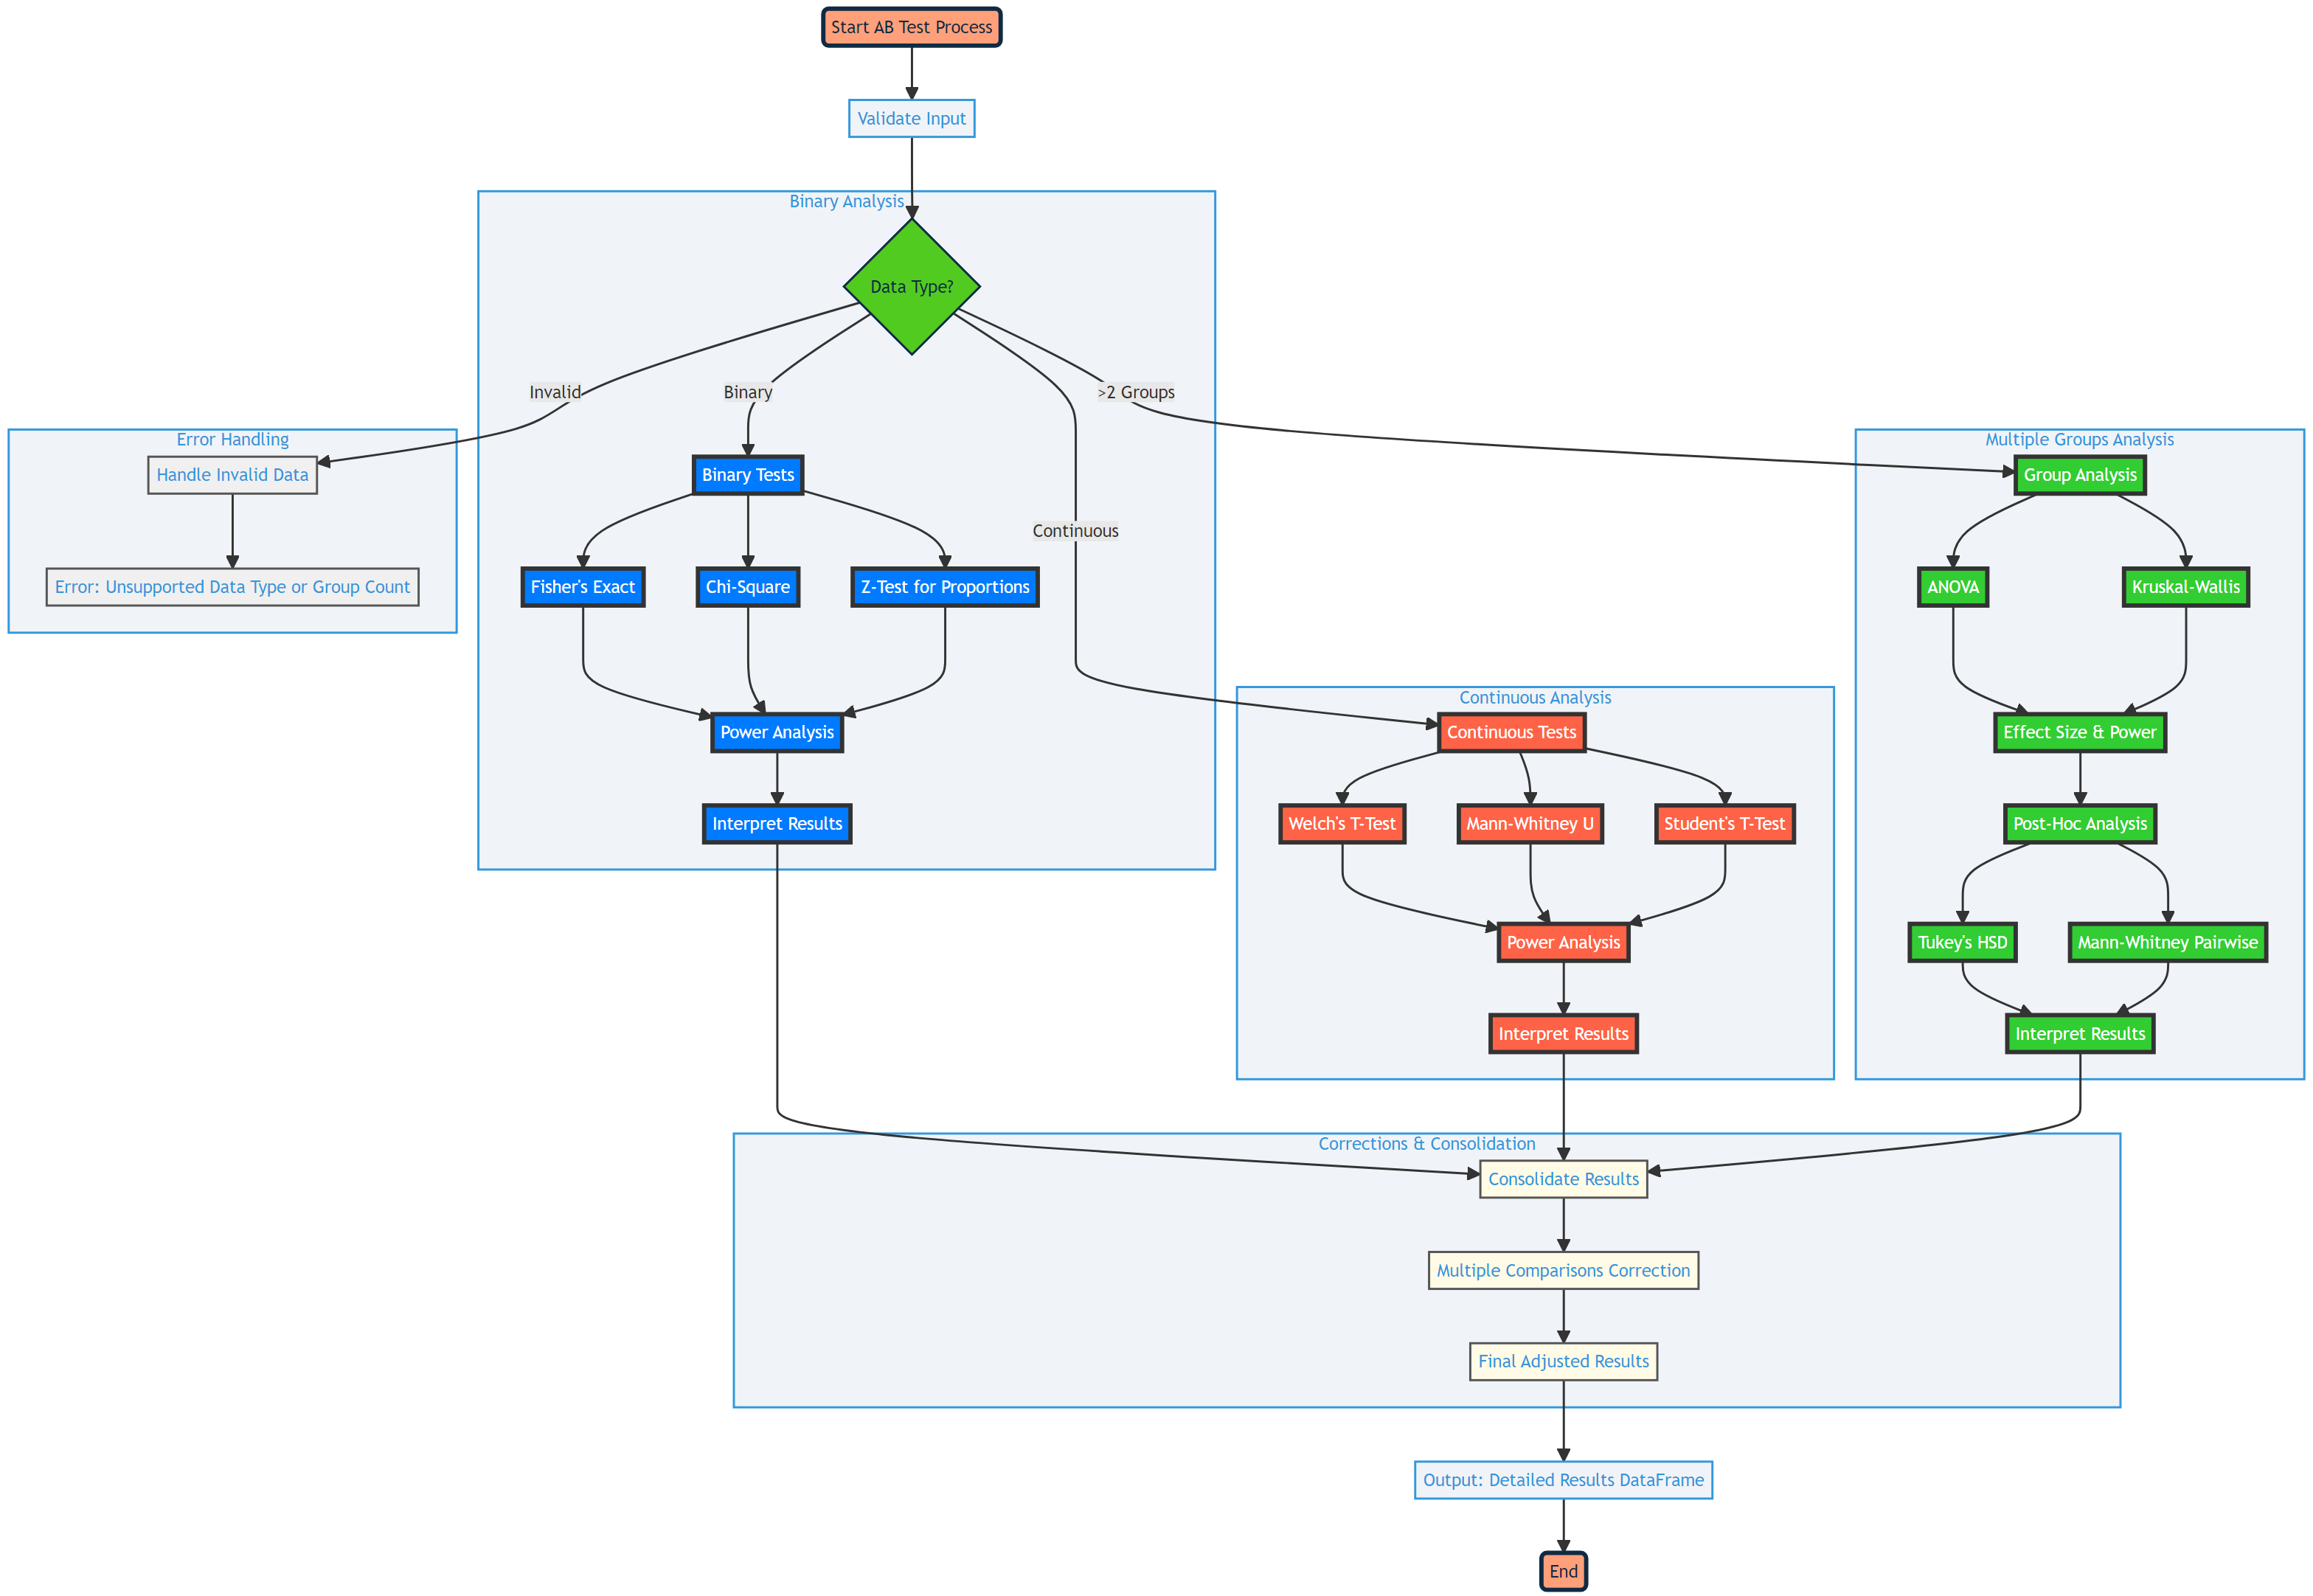
The ab_test function is designed to facilitate A/B testing and statistical analysis within a given dataset. This robust tool can handle both binary and continuous outcome data, performing appropriate statistical tests to determine if there are significant differences between groups.
Function Map

Parameters
data: Pandas DataFrame containing the dataset for analysis.group_column: String specifying the column indatathat contains the group labels.value_column: String specifying the column with the values to analyze.control_group: (Optional) String specifying the control group's label for comparison.alpha: (Optional) Float defining the significance level for the statistical tests, defaulting to 0.05.handle_outliers: (Optional) List specifying the method and strategy for handling outliers.mc_correction: (Optional) String specifying the method for multiple comparisons correction.
Functionality
- Validates input data and columns.
- Handles outliers if specified.
- Selects and performs the appropriate statistical tests based on data characteristics.
- Calculates effect sizes and conducts power analysis for the tests conducted.
- Applies multiple comparisons correction if specified.
- Generates interpretations of test results.
Output
Returns a Pandas DataFrame with columns for each test performed, including the test name, p-values, effect sizes, power, and interpretations.
Installation
This is the environment we need to load.
pip install ab_testing_module==3.1.7
Load Package
from ab_testing_module import ab_test
Base Operations
# Perform ab test or abc test
df_results = ab_test(data=df,
                    group_column='group',
                    value_column='outcome',
                    control_group='control',
                    alpha=0.05,
                    handle_outliers=None,
                    mc_correction=None)
The ab_test function performs statistical analysis to compare outcomes across different groups in an A/B testing framework.
-
data: The dataset to analyze, provided as a Pandas DataFrame. It should contain at least two columns: one for grouping (e.g., experimental vs. control groups) and one for the outcomes of interest (e.g., conversion rates, scores). -
group_column: A string specifying the name of the column indatathat contains the group labels. This column is used to differentiate between the groups involved in the A/B test (e.g., 'group'). -
value_column: A string indicating the name of the column indatathat contains the values or outcomes to be analyzed (e.g., 'outcome'). These values are the focus of the statistical comparison between groups. -
control_group: (Optional) A string specifying the label of the control group within thegroup_column. This argument is essential when the analysis involves comparing each test group against a common control group to assess the effect of different treatments or conditions. -
alpha: (Optional) A float representing the significance level used in the statistical tests. The default value is0.05, which is a common threshold for determining statistical significance. Lowering this value makes the criteria for significance stricter, while increasing it makes the criteria more lenient. -
handle_outliers: (Optional) A list specifying the method and strategy for handling outliers in thevalue_column. The first element of the list is the method ('IQR' for interquartile range or 'Z-score'), and the second element is the strategy ('remove', 'impute', or 'cap'). IfNone, no outlier handling is performed.IQR: Identifies outliers based on the interquartile range. Typically, values below Q1-1.5IQR or above Q3+1.5IQR are considered outliers.Z-score: Identifies outliers based on the Z-score, with values typically beyond 3 standard deviations from the mean considered outliers.remove: Outliers are removed from the dataset.impute: Outliers are replaced with a specified statistic (e.g., the median).cap: Outliers are capped at a specified maximum and/or minimum value.
-
mc_correction: (Optional) A string specifying the method for multiple comparisons correction when conducting multiple statistical tests. This argument is critical for controlling the family-wise error rate or the false discovery rate in experiments involving multiple group comparisons. Options include:None: No correction is applied.'bonferroni': The Bonferroni correction, which adjusts p-values by multiplying them by the number of comparisons.'fdr': The False Discovery Rate correction, which controls the expected proportion of incorrectly rejected null hypotheses.'holm': The Holm-Bonferroni method, a step-down procedure that is less conservative than the standard Bonferroni correction.
-
The function returns a Pandas DataFrame (
df_results) containing the results of the statistical tests, including test names, p-values, effect sizes, power analyses (where applicable), and detailed interpretations of the results. The DataFrame provides a comprehensive summary of the findings from the A/B test analysis.
Advanced Modeling Function Documentation
Purpose
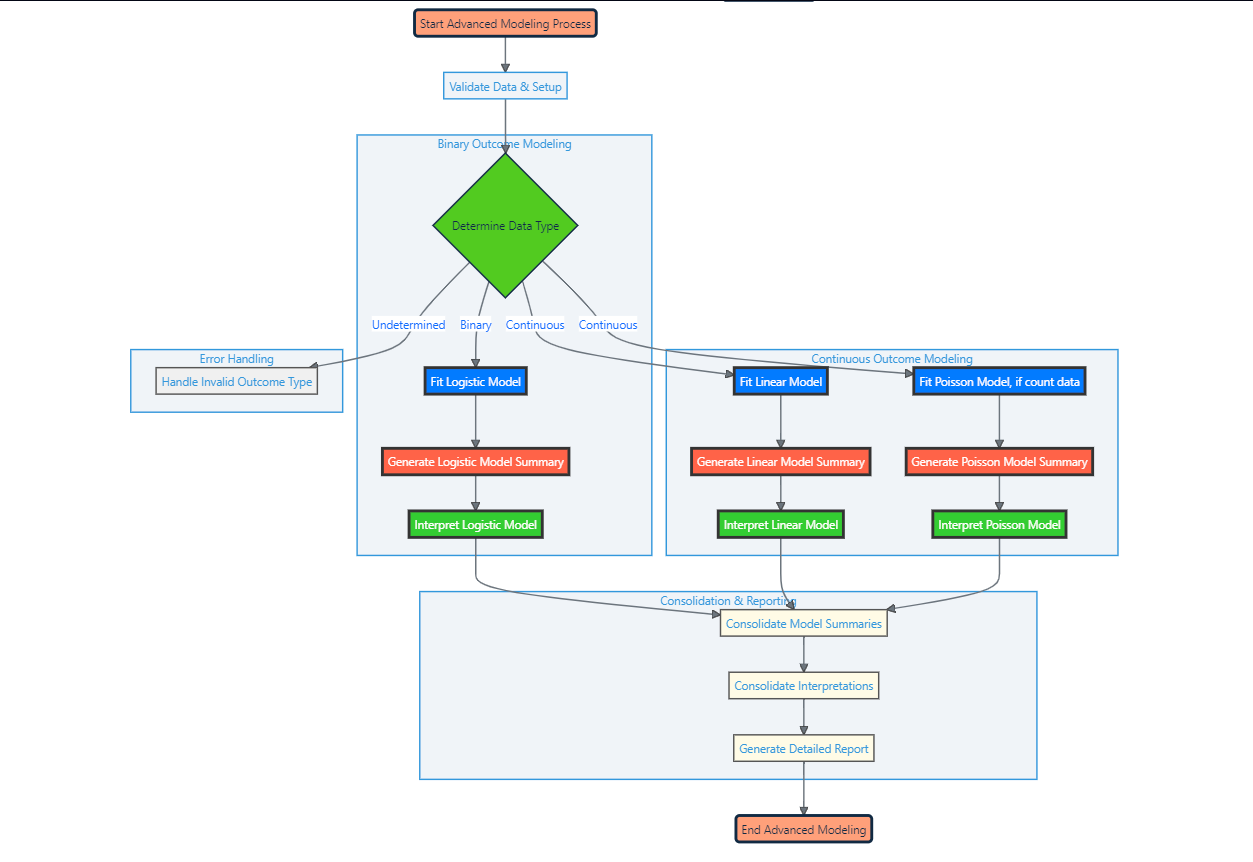
The modeling is a sophisticated function designed for conducting advanced statistical modeling. It fits different types of statistical models to explore relationships between variables, quantify effects, and provide insights into the data structure.
Function Map

Parameters
data: Pandas DataFrame containing the dataset.group_column: String specifying the column with the group information.value_column: String specifying the column with the dependent variable.control_group: (Optional) String specifying the label of the control group.
Functionality
- Automatically determines the model type based on the dependent variable's characteristics.
- Fits the chosen model and generates summaries, including parameter estimates and their significance.
- Performs effect size and power analysis where applicable.
- Provides detailed interpretations of the modeling results.
Output
- Model summaries for each fitted model.
- Structured interpretations of each model's results.
- Effect sizes and results of power analyses for the conducted models.
Installation
This is the environment we need to load.
pip install ab_testing_module==3.1.7
Load Package
from ab_testing_module import modeling
Base Operations
# Perform advanced modeling
model_summaries, interpretations, model_summaries_df, interpretations_df = modeling(data=df,
                                                                                    group_column='group',
                                                                                    value_column='outcome',
                                                                                    control_group='control')
The modeling function conducts advanced statistical modeling to explore relationships between variables in the context of A/B testing.
data(DataFrame): The dataset for modeling, including independent variables and the dependent variable of interest.group_column(str): The column indatathat identifies the grouping of data points (e.g., different conditions or treatments).value_column(str): The column indatarepresenting the dependent variable or outcome of interest.control_group(str, optional): Specifies the label of the control group for comparative modeling purposes.
The function returns a tuple containing four elements, designed to provide both the raw statistical outputs from the modeling process and their synthesized interpretations for easier understanding:
-
model_summaries: A list or other collection type that includes detailed summaries for each of the statistical models fitted during the analysis. These summaries typically contain information on model coefficients, p-values, confidence intervals, and other pertinent statistical metrics. -
interpretations: This output consists of narrative interpretations for each fitted model. It aims to translate the technical statistical findings into more accessible insights, highlighting significant results and their potential implications. -
model_summaries_df(Pandas DataFrame): A DataFrame consolidating the statistical summaries of all models into a tabular format. This structure facilitates a straightforward comparison across models, offering a clear view of the estimated effects and their statistical significance. -
interpretations_df(Pandas DataFrame): Similar tomodel_summaries_df, this DataFrame organizes the interpretations of each model's results into a structured table. It provides a narrative summary of the findings in an easily digestible format, suitable for reporting or further discussion.
Data Visualization Function Documentation
Purpose
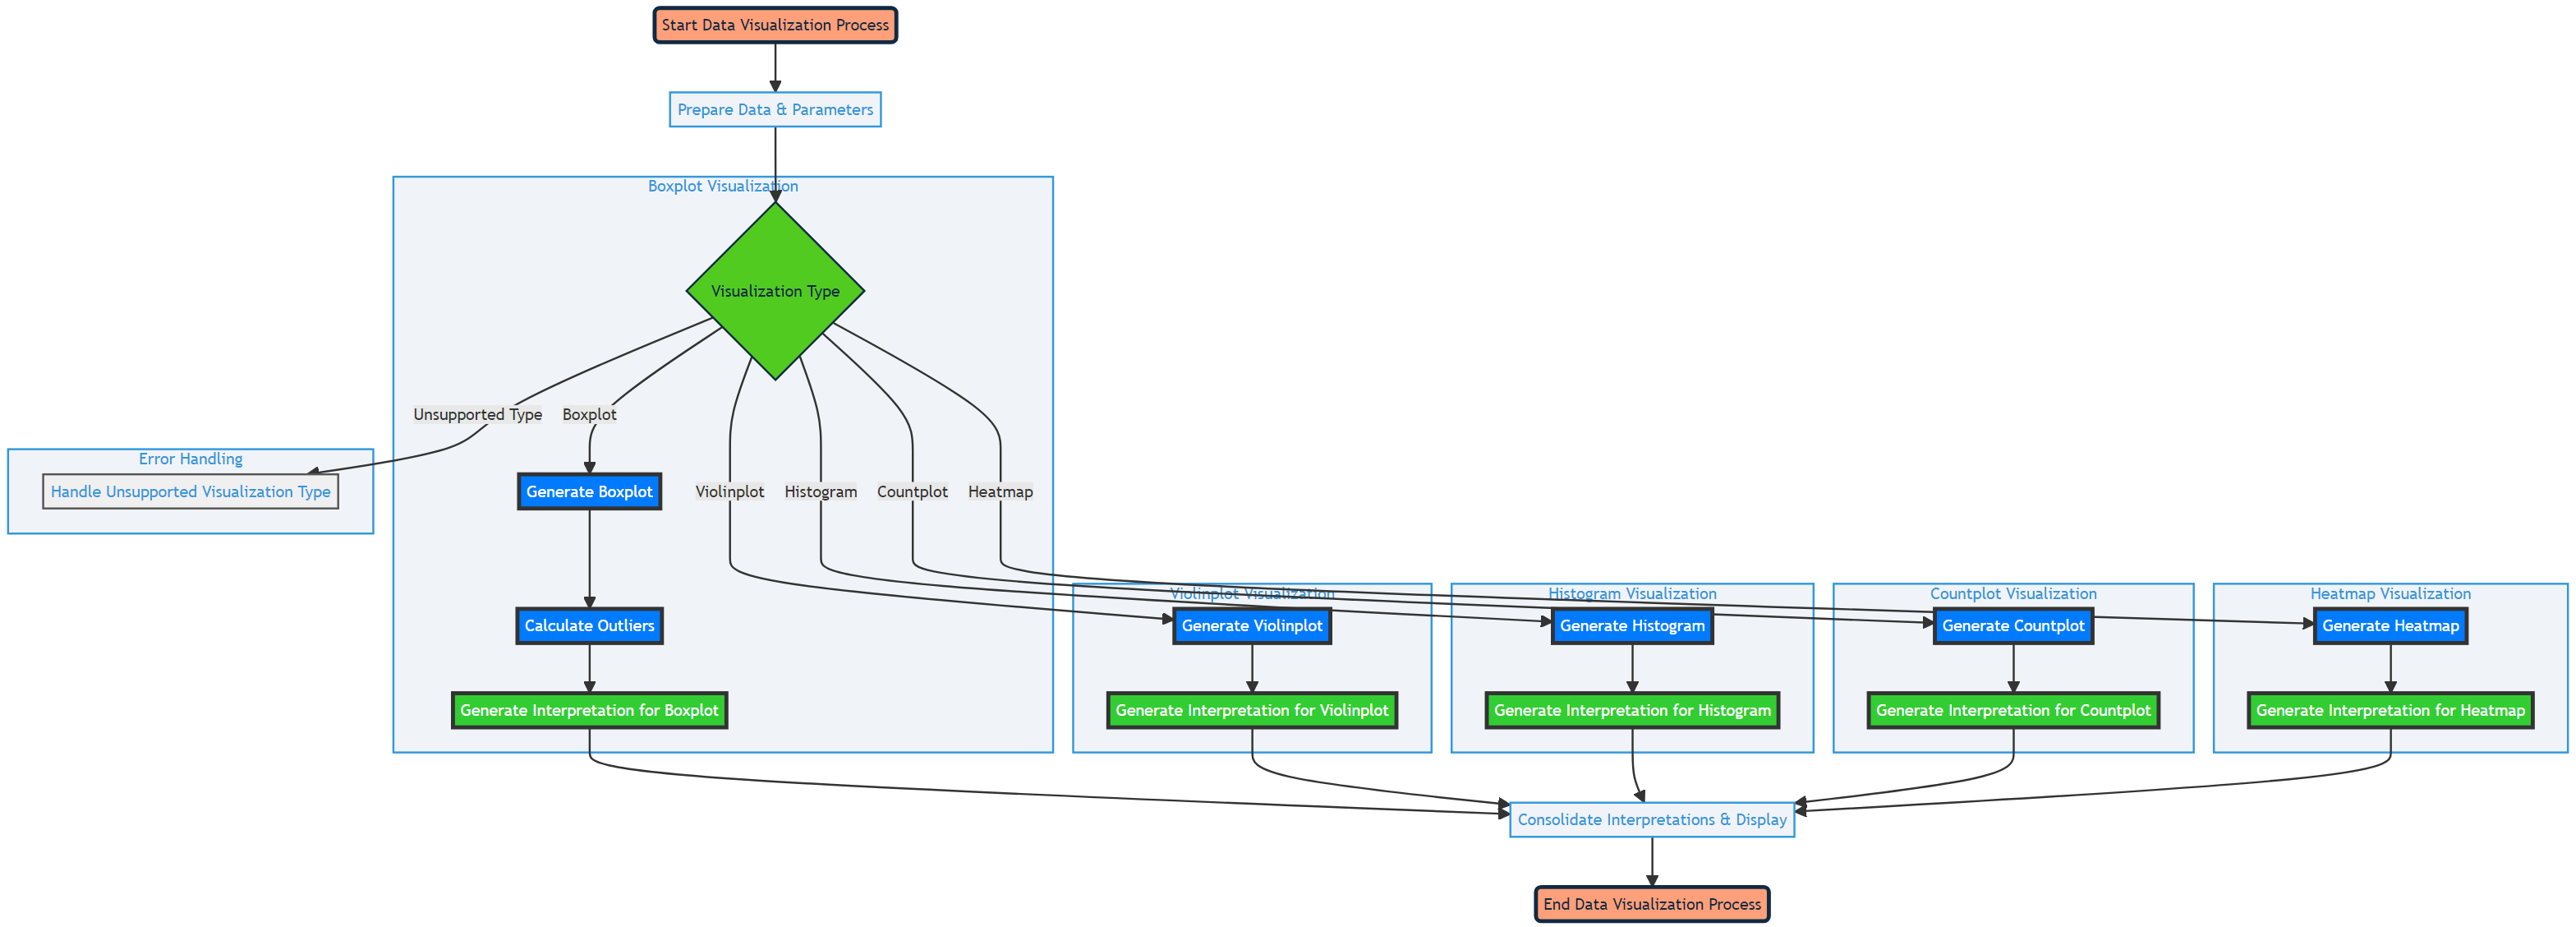
The data_viz function creates a series of data visualizations based on a provided dataset. It aims to facilitate data exploration, presentation, and the comprehension of statistical analyses through visual means.
Function Map

Parameters
data: Pandas DataFrame with the dataset to be visualized.group_column: String specifying the column with group labels.value_column: String specifying the column with values to analyze.viz_types: List of strings indicating the types of visualizations to generate.
Functionality
- Selects and customizes visualizations based on
viz_types. - Handles grouping and value considerations for data segmentation.
- Generates data-driven interpretations for each visualization.
- Employs interactive and aesthetically pleasing visualization techniques.
Output
- Displays requested visualizations.
- Provides interpretations for each visualization to highlight key findings.
Installation
This is the environment we need to load.
pip install ab_testing_module==3.1.7
Load Package
from ab_testing_module import data_viz
Base Operations
# Create data visualization
visualizations = data_viz(data=df,
                        group_column='group',
                        value_column='outcome',
                        viz_types=['boxplot', 'violinplot', 'histogram', 'countplot', 'heatmap'])
The data_viz function creates a series of visualizations to aid in the exploratory data analysis and presentation of findings from the dataset.
data(DataFrame): The dataset to be visualized, should include the variable(s) for grouping and the variable of interest.group_column(str): The column name indatathat contains the labels for different groups or categories within the data.value_column(str): The column name indatathat contains the values or outcomes to be visualized and analyzed.viz_types(list of str): A list specifying the types of visualizations to generate, such as['boxplot', 'violinplot', 'histogram', 'countplot', 'heatmap'].
Ideal Use Cases
The Statistical Analysis Toolbox is designed to support a wide range of data analysis scenarios, particularly those involving A/B testing, statistical modeling, and data visualization. Below are the ideal use cases for each of the key functions within the toolbox: ab_test, modeling, and data_viz.
ab_test Function
Ideal Use Cases
- Comparing Conversion Rates: Ideal for analyzing the effectiveness of two different webpage designs on user conversion rates. The
ab_testfunction can statistically determine if one design leads to significantly higher conversions than the other. - Evaluating Marketing Strategies: Useful for assessing the impact of different marketing campaigns or strategies on sales or customer engagement metrics.
- Product Feature Testing: When introducing new features or changes to a product,
ab_testcan help evaluate the change's impact on user behavior or satisfaction.
modeling Function
Ideal Use Cases
- Predictive Modeling: For scenarios where the goal is to predict outcomes based on a set of variables, such as forecasting sales based on historical data and market conditions.
- Causal Inference: In situations where understanding the causal relationship between variables is crucial, such as determining the effect of educational interventions on student performance.
- Complex Comparative Analysis: Suitable for analyzing datasets with multiple groups and variables, where simple statistical tests are insufficient. For example, comparing the effects of various teaching methods across different schools or demographic groups.
data_viz Function
Ideal Use Cases
- Data Exploration: Before diving into complex analyses,
data_vizcan help uncover patterns, trends, and outliers in the data, guiding further investigation. - Reporting and Presentation: Creating compelling visual representations of analysis results for reports, presentations, or dashboards. It's particularly useful for conveying findings to non-technical stakeholders.
- Comparative Analysis Visualization: When the goal is to visually compare outcomes across different groups, such as visualizing the distribution of customer satisfaction ratings before and after implementing a customer service improvement plan.
Contributing
We welcome contributions, suggestions, and feedback to make this library even better. Feel free to fork the repository, submit pull requests, or open issues.
Documentation & Examples
For documentation and usage examples, visit the GitHub repository: https://github.com/knowusuboaky/ab_testing_module
Author: Kwadwo Daddy Nyame Owusu - Boakye
Email: kwadwo.owusuboakye@outlook.com
License: MIT
Project details
Release history Release notifications | RSS feed
Download files
Download the file for your platform. If you're not sure which to choose, learn more about installing packages.
Source Distribution
File details
Details for the file ab_testing_module-3.1.7.tar.gz.
File metadata
- Download URL: ab_testing_module-3.1.7.tar.gz
- Upload date:
- Size: 23.7 kB
- Tags: Source
- Uploaded using Trusted Publishing? No
- Uploaded via: twine/4.0.2 CPython/3.8.18
File hashes
| Algorithm | Hash digest | |
|---|---|---|
| SHA256 |
911fdad32637c892f93be34c01bc264f64505c48a260ccb7e52adc9fca37fc5d
|
|
| MD5 |
a06661ce677485b7126390a111f3ed2b
|
|
| BLAKE2b-256 |
7a91bd26e46ce4a230ab5d56f56bdb5a92a4b85927532798e09d785e56f4b223
|


