
ablechart
ablechart is a focused Python SDK for creating, inspecting, parsing,
and updating editable PowerPoint chart assets.
It is built for workflows where a chart must stay a real PowerPoint chart, not a screenshot:
- editable in Microsoft PowerPoint after generation
- backed by an embedded workbook
- able to carry semantic metadata for round-trip parsing
- replaceable in an existing
.pptxwithout rebuilding the whole slide - shaped around financial reporting chart families rather than a generic chart zoo
The project is intentionally narrow. It is a chart asset kernel, not a full presentation generation framework, report builder, template library, or AI slide generator.
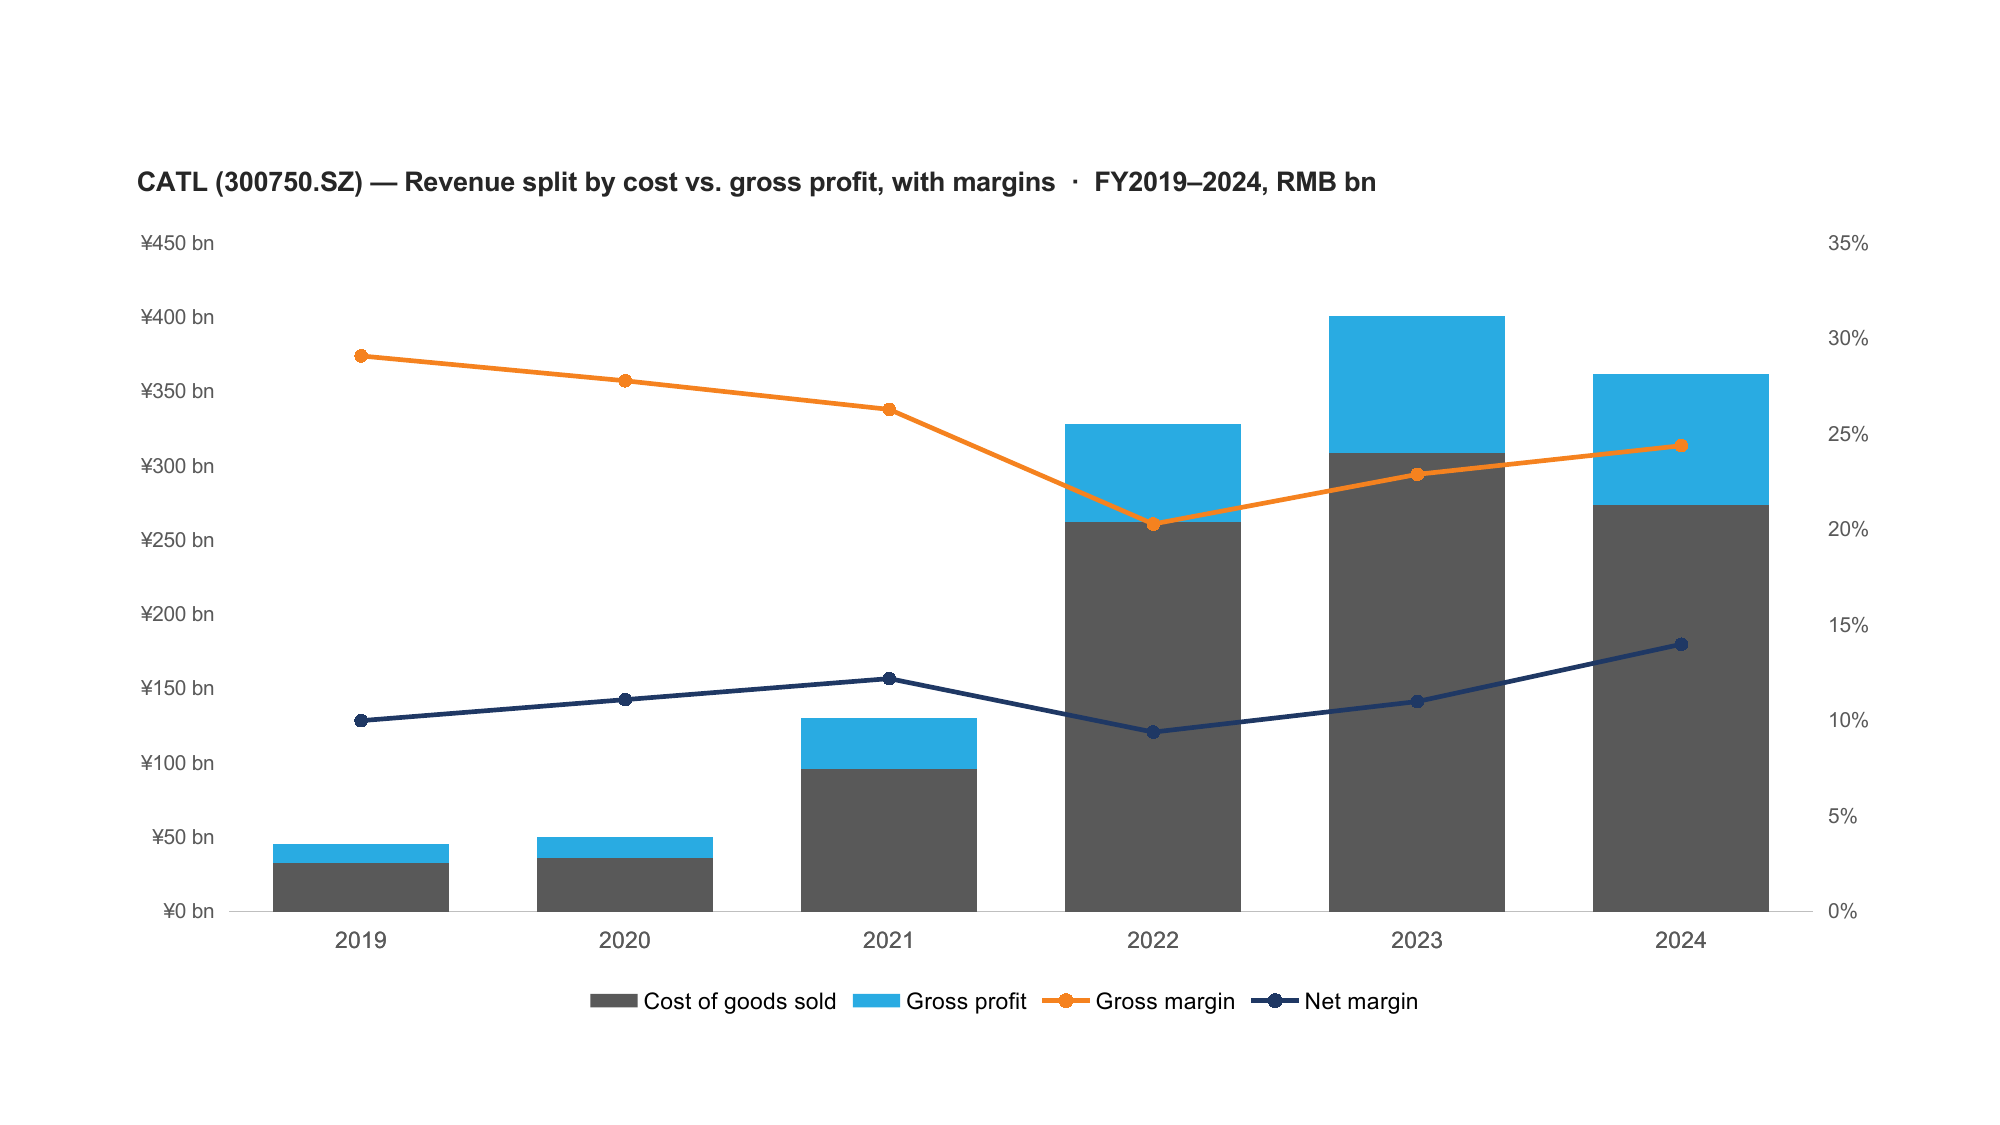
A real, editable PowerPoint chart rendered from a .pptx produced by ablechart — stacked columns and two lines on a second value axis, with per-axis number formats. Data: CATL (300750.SZ) FY2019–2024 annual filings (source: Tushare).
Install
pip install ablechart
Python >=3.10 is required.
Core dependencies:
python-pptx>=1.0.2,<1.1pandas>=2.2,<3numpy>=1.26,<2lxml>=5,<6openpyxl>=3.1,<4
For local development:
git clone https://github.com/hanlinlibham/ablechart.git
cd ablechart
pip install -e .
python -m pytest
Quickstart
Create an editable combo chart
import pandas as pd
from pptx import Presentation
from ablechart import create_combo_chart

df = pd.DataFrame(
    {
        "Year": [2021, 2022, 2023, 2024],
        "Revenue": [100, 110, 120, 140],
        "Profit": [10, 12, 15, 18],
    }
)

prs = Presentation()
slide = prs.slides.add_slide(prs.slide_layouts[6])

create_combo_chart(
    slide=slide,
    df=df,
    categories_col="Year",
    series_config=[
        {"key": "Revenue", "name": "Revenue", "type": "bar", "axis": "primary"},
        {"key": "Profit", "name": "Profit", "type": "line", "axis": "secondary"},
    ],
    title="Revenue and profit",
)

prs.save("combo-demo.pptx")
Parse a chart back into data and metadata
from ablechart import parse_chart_from_pptx

df, series_config, chart_type, layout_info = parse_chart_from_pptx("combo-demo.pptx")

print(chart_type)
print(df.head())
print(series_config)
Inspect and update charts in an existing deck
from ablechart import SeriesData, inspect_pptx_charts, replace_pptx_chart_data

inventory = inspect_pptx_charts("template.pptx")
target = next(item for item in inventory if item.replaceable)

result = replace_pptx_chart_data(
    input_pptx="template.pptx",
    output_pptx="updated.pptx",
    selector=target.selector,
    categories=["2026Q1", "2026Q2", "2026Q3"],
    series=[
        SeriesData(name="Revenue", values=[120.0, 132.0, 141.0]),
        SeriesData(name="Cost", values=[82.0, 88.0, 91.0]),
    ],
)

assert result.status == "ok", result.error_detail
What It Supports
Chart families
| Family | Entry point | Notes |
|---|---|---|
| Combo | create_combo_chart() |
Bar, line, area, stacked, percent-stacked, dual-axis, date-axis presets |
| Waterfall | create_waterfall_chart() |
Editable bridge chart with total and relative measures |
| Scatter | create_scatter_chart() |
Native scatter chart with parse helpers |
| Bubble | create_bubble_chart() |
Native bubble chart with parse helpers |
| Range snapshot | create_range_snapshot_chart() |
Valuation range snapshot with min/max/average/current markers |
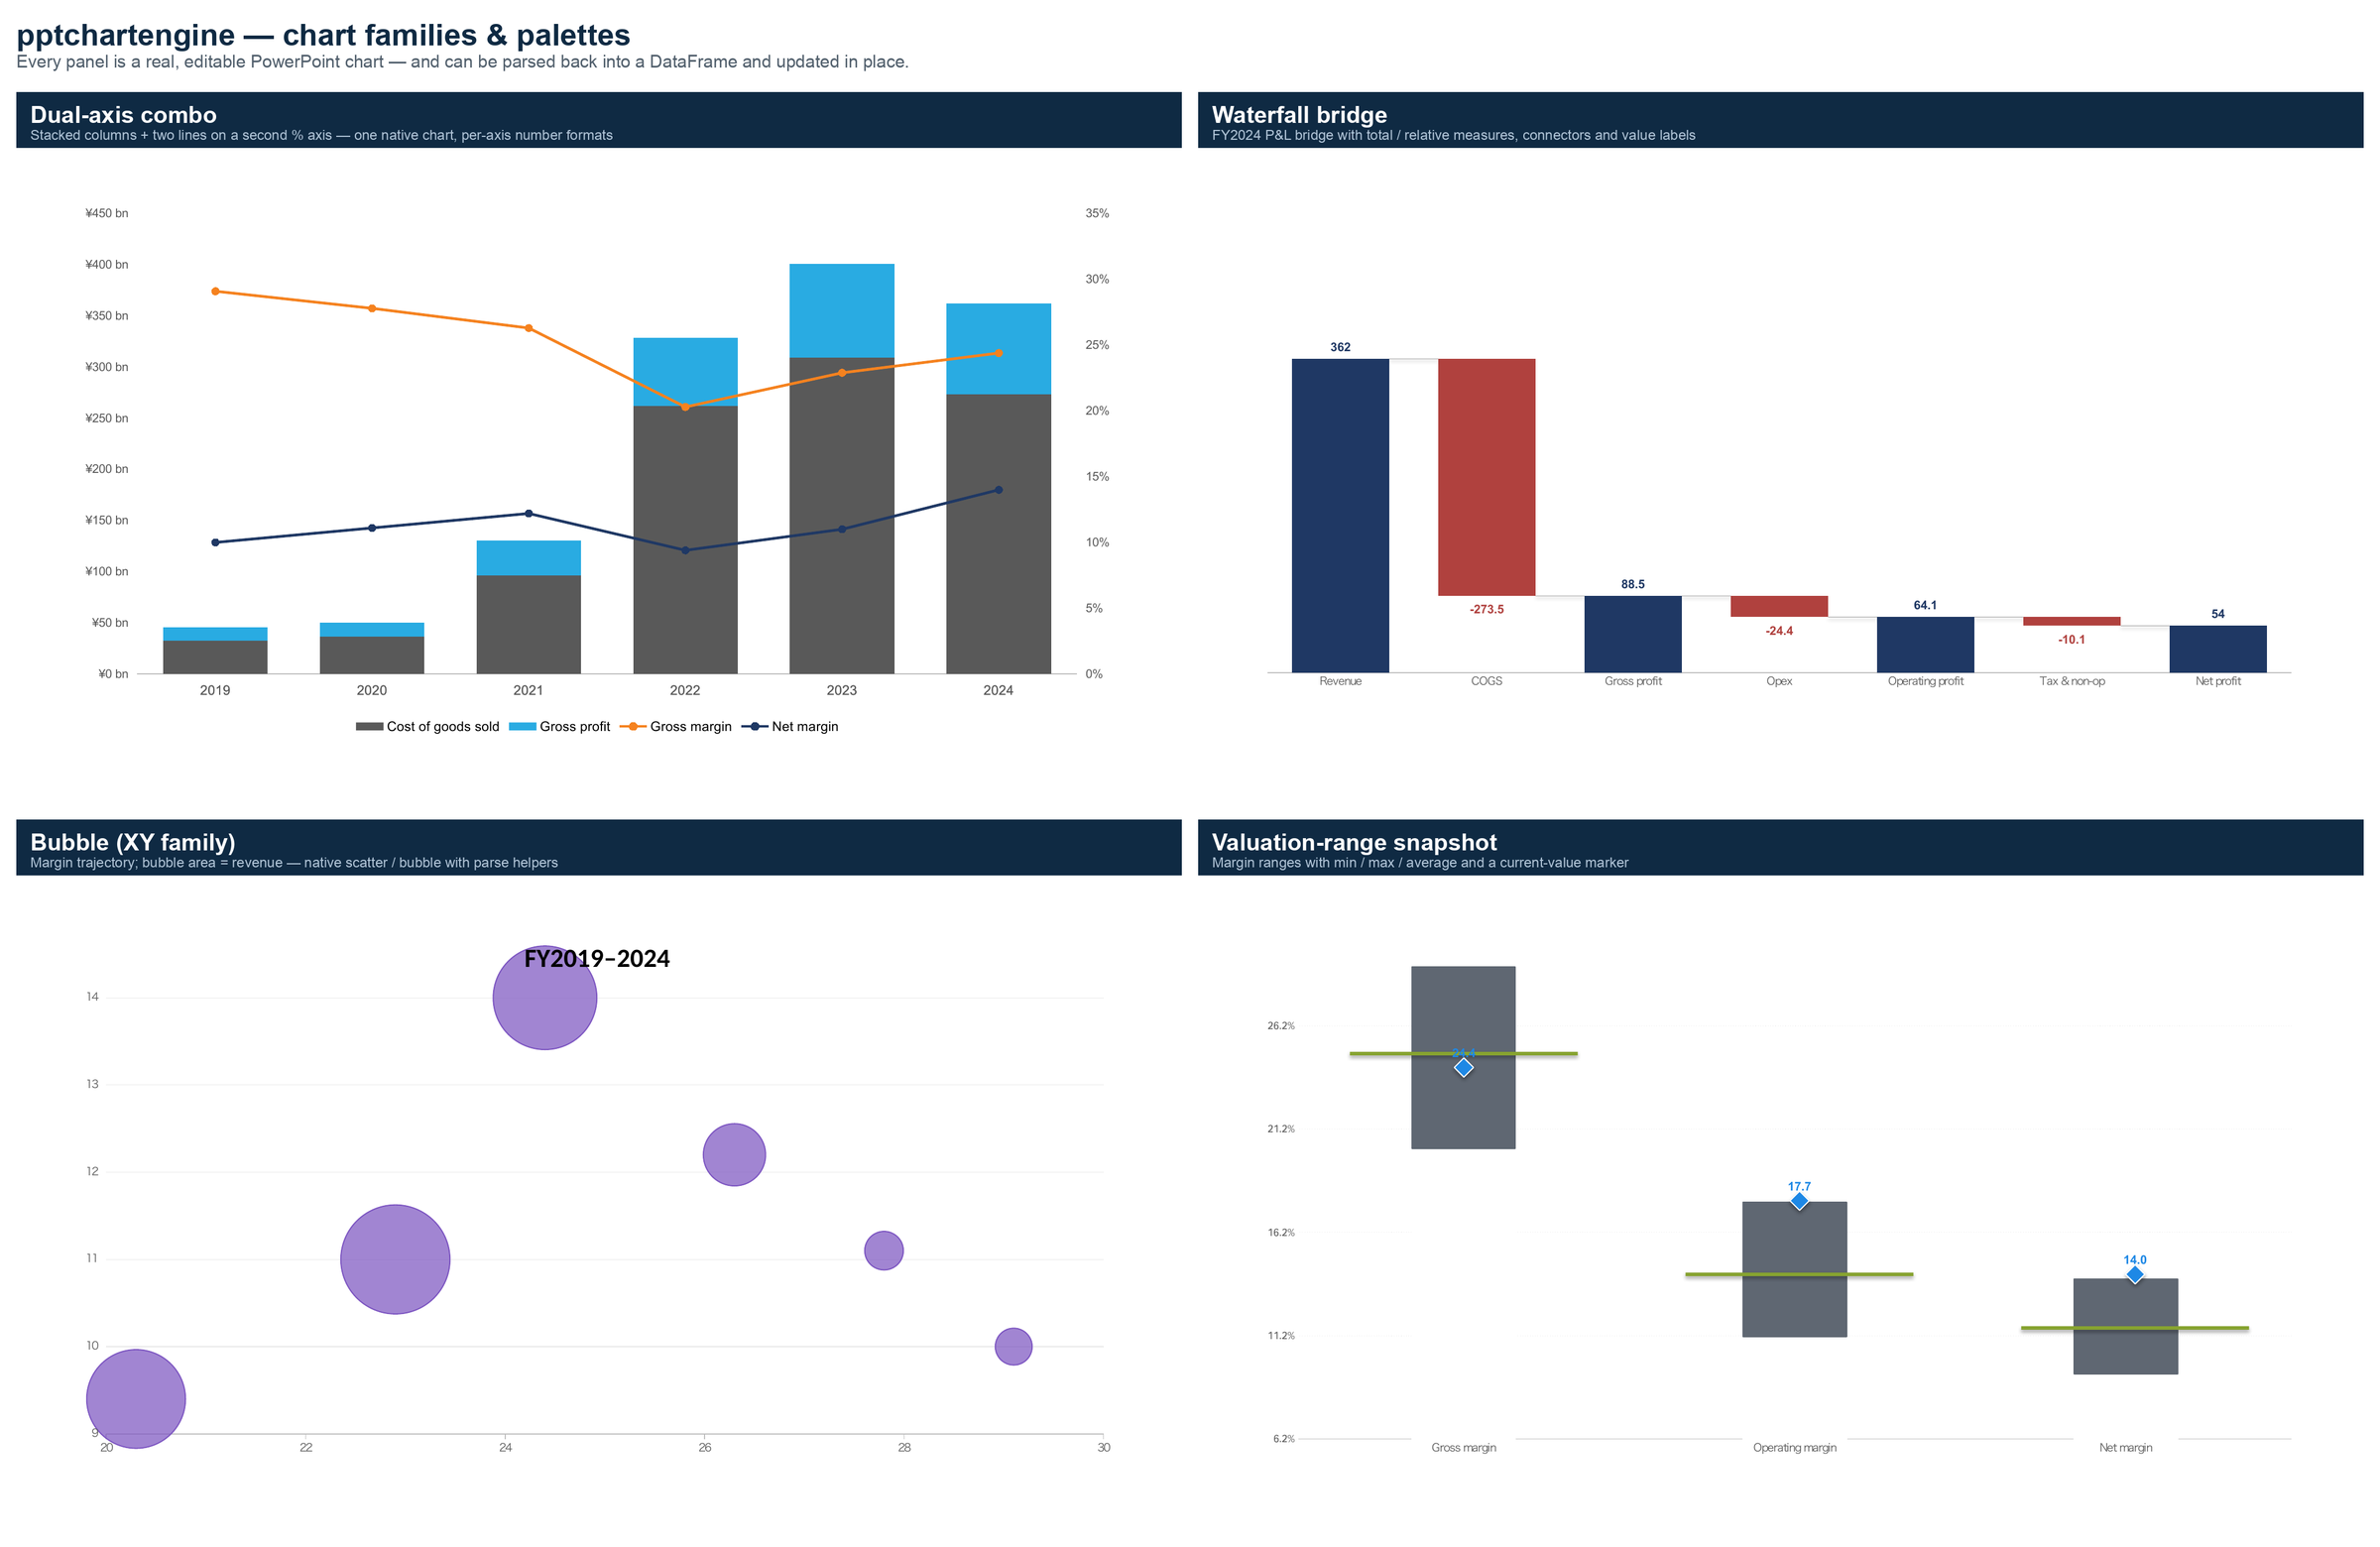
Each panel is a real, editable PowerPoint chart produced by ablechart, then rendered to an image. Every one can be parsed back into a DataFrame and updated in place. All four use the same real dataset (CATL 300750.SZ, source: Tushare); regenerate with python scripts/make_gallery.py.
Semantic financial families
create_semantic_chart() and the family-specific helpers provide a higher
level mapping from financial-report concepts to native chart or shape
composition primitives.
Currently exposed families include:
performance_comparedistribution_plus_historystyle_boxstyle_allocationfactor_exposurescore_overlayconcentrationevent_timelineattribution_decompositionranked_tile_matrixheatmap_matrixtable_plus_chart_compositefactor_attribution_panelregime_table_panelmanager_timeline_profileaward_timeline_panelselection_timing_griddual_chart_panelholding_detail
This layer is useful for single-slide financial report components. It is not a report orchestration engine.
Public API Shape
The public API is organized around the chart asset lifecycle:
| Lifecycle | Representative APIs |
|---|---|
| Create | create_combo_chart(), create_waterfall_chart(), create_semantic_chart() |
| Parse | parse_chart_from_pptx(), parse_all_charts_from_pptx(), get_semantic_chart_spec() |
| Metadata | ChartMetadataV1, write_chart_metadata, METADATA_SCHEMA_VERSION |
| Inspect | inspect_pptx_charts(), ChartInventoryItem, ChartSelector |
| Replace | replace_pptx_chart_data(), SeriesData, ReplaceResult |
The design goal is that a generated chart can become a durable asset: created once, opened and edited in PowerPoint, parsed again later, and updated without losing its position, size, identity, or basic editability.
How This Differs From Similar Packages
ablechart is not trying to replace broad PowerPoint SDKs. It is a
small layer for high-quality chart assets and template-safe chart updates.
| Project | Main strength | How ablechart differs |
|---|---|---|
python-pptx |
General Python library for creating and updating .pptx files, including adding charts and replacing chart data. |
ablechart builds on the PowerPoint-native path but adds financial chart families, semantic metadata, chart round-trip parsing, inventory, and template-safe replacement contracts. |
PptxGenJS |
Broad JavaScript presentation generation for Node.js, browser, React, Electron, charts, tables, images, and HTML-to-PPTX workflows. | ablechart is Python-only and intentionally narrower: it does not generate full decks from layouts, but focuses on editable chart assets and parse/update lifecycles. |
mschart |
R package for native editable Microsoft Office charts, commonly used with officer. |
ablechart targets Python financial-report workflows and adds inspect/replace and metadata round-trip APIs for existing .pptx chart assets. |
Aspose.Slides for Python via .NET |
Commercial, full-featured presentation processing SDK with broad PowerPoint manipulation, chart modules, export, animation, SmartArt, VBA, and conversion features. | ablechart is MIT-licensed and much smaller. It does not aim to cover the whole PowerPoint object model or rendering/export conversion. |
Spire.Presentation for Python |
Commercial presentation API covering creation, editing, conversion, and chart operations. | ablechart avoids broad document processing scope and concentrates on deterministic chart creation, chart metadata, and safe data replacement. |
In short:
- Use
python-pptxwhen you need a general Python PowerPoint building block. - Use
PptxGenJSwhen your stack is JavaScript or browser-side PPTX generation. - Use Aspose or Spire when you need broad commercial document processing, conversion, or complete PowerPoint object-model coverage.
- Use
ablechartwhen your hard problem is editable, updateable, inspectable PowerPoint charts for data-heavy reports.
Current Limits
ablechart does not currently provide:
- full report assembly
- slide template management
- data connectors
- CLI job orchestration
- PDF or image export
- AI prompt-to-deck generation
- complete coverage of every PowerPoint chart type
- HTML or interactive web output
Unsupported chart replacement cases fail explicitly rather than silently rebuilding the chart. The first-batch replacement path is focused on common embedded-workbook chart types such as bar, line, combo, area, pie, scatter, and bubble charts.
Styling granularity also has known gaps. Supported: legend (5 preset
positions), per-axis number format / font / range / gridlines / tick marks
(primary and secondary), axis titles (category + both value axes), and
tick-label rotation, and hiding a single series from the legend
(show_in_legend=False). Not yet implemented: log scale, native display units
(thousands / millions), and manual (XY) legend placement.
Development
Run the test suite:
python -m pytest
Build the distribution artifacts:
python -m build --sdist --wheel
python -m twine check dist/*
The repository keeps contract tests for:
- public exports
- generated chart round-trips
- semantic metadata recovery
- existing-deck chart inspection
- in-place chart data replacement
- checked-in
.pptxfixture behavior
License
MIT License. See LICENSE.
1 maintainer

Release files for ablechart 0.2.0
For a detailed explanation of source distributions (sdists) and built distributions (wheels), please see the package formats documentation.
Source distribution (sdist)
| File | Size | Uploaded | |
|---|---|---|---|
| ablechart-0.2.0.tar.gz | 222.8 kB | Details |
Built distribution (wheel)
| File | Interpreter | ABI | Platform | Reset |
|---|---|---|---|---|
| ablechart-0.2.0-py3-none-any.whl | Python 3 | none | any | Details |
Total release size:372.1 kB
Release files / ablechart-0.2.0.tar.gz
| Download URL | ablechart-0.2.0.tar.gz |
|---|---|
| Size | 222.8 kB |
| Tags | Source |
|
SHA-256 checksum How to use checksums |
2526b6f2be73dc56e9094618059a132f91ddc94cec9615add73e9c559ebbce1f
|
|
BLAKE2b-256 checksum How to use checksums |
e84a7e75d4fa92c1c63df60ce8692a4822c7d47d6c39a82d55d7020463f141c9
|
| Upload date | |
|
Uploaded using Trusted Publishing? What is trusted publishing? |
Yes |
| Uploaded via |
twine/6.1.0 CPython/3.13.13
|
Provenance
Provenance describes where a file came from. On PyPI, provenance is shared via attestations, which provide a verifiable record of the build or publishing details. View details, limitations and caveats.


PyPI Publish Attestation
PyPI verified that this artifact, at this checksum, originated from the publisher listed below.
Signed by GitHub Actions, verified by PyPI on Jun 21, 2026.
Transparency logRelease files / ablechart-0.2.0-py3-none-any.whl
| Download URL | ablechart-0.2.0-py3-none-any.whl |
|---|---|
| Size | 149.4 kB |
| Tags | Python 3 |
|
SHA-256 checksum How to use checksums |
98521f528869b1b5aeafa2d7551e4550802cc98321159aefcdf6b16dc2cf0100
|
|
BLAKE2b-256 checksum How to use checksums |
12191d1064a242605168918dd07d3846032a33291fa6a539759ab30f7ce7cff2
|
| Upload date | |
|
Uploaded using Trusted Publishing? What is trusted publishing? |
Yes |
| Uploaded via |
twine/6.1.0 CPython/3.13.13
|
Provenance
Provenance describes where a file came from. On PyPI, provenance is shared via attestations, which provide a verifiable record of the build or publishing details. View details, limitations and caveats.
PyPI Publish Attestation
PyPI verified that this artifact, at this checksum, originated from the publisher listed below.
Signed by GitHub Actions, verified by PyPI on Jun 21, 2026.
Transparency log













