Tools for accessing and visualizing historical ACS 1-Year nativity data for the United States and subnational geographies.

Project description
acs-nativity


acs-nativity is a Python package for analyzing immigration trends in the United States using data from the American Community Survey (ACS). It provides a simple interface for downloading and visualizing data on the native-born and foreign-born population.
The package provides data as a time series covering the full span of ACS 1-year estimates (2005-2024). Under the hood, the package downloads and harmonizes two ACS tables: B05002 (2005-2008) and B05012 (2009 onward). The 2025 ACS 1-year estimates are expected to be released in September 2026. The Census Bureau did not release ACS 1-year estimates in 2020.
acs-nativity makes it easy to work with data for several geographies covered by the ACS 1-year estimates. This includes the nation, all states, the District of Columbia, all metropolitan statistical areas, and all counties and places (i.e., towns or cities) with populations of 65,000 or more.
The package exposes three functions:
get_nativity_timeseries()- Downloads ACS nativity data and returns a dataframe covering all available ACS 1-year estimates for the given geography.plot_nativity_timeseries()- Creates a time series visualization of nativity data.plot_nativity_change()- Creates a bar chart showing the year-to-year change in a nativity measure.
Installation
Install acs-nativity with pip:
pip install acs-nativity
Example Workflow
The example below walks you through getting historic nativity data for the entire country, graphing it as a time series, and graphing the year-over-year changes.
Getting Data
The code below will get nativity data for the entire country over the course of the entire ACS (2005-2024):
from acs_nativity import (
    get_nativity_timeseries,
    plot_nativity_timeseries,
    plot_nativity_change,
)

df = get_nativity_timeseries(us="*")
df.head(1)
   Name           Year  Total      Native     Foreign-born  Percent Foreign-born
0  United States  2005  288378137  252688295  35689842      12.376057
The parameter us="*" tells get_nativity_timeseries to return data for the entire country. The key columns are Total, Native, Foreign-born, and Percent Foreign-born. Those columns are provided for all geographies.
Graphing Time Series
To plot a time series of the dataframe, call plot_nativity_timeseries and specify the column you want to chart. Most chart details (e.g., title and axis labels) are handled automatically, and annotations show when presidential administrations changed.
fig = plot_nativity_timeseries(df, column="Foreign-born")
fig.show()
Note: In Jupyter notebooks, you can simply call plot_nativity_timeseries(df, column="Foreign-born") as the last line of a cell and the figure will render automatically. In a Python REPL or script, assign the figure to a variable and call .show().
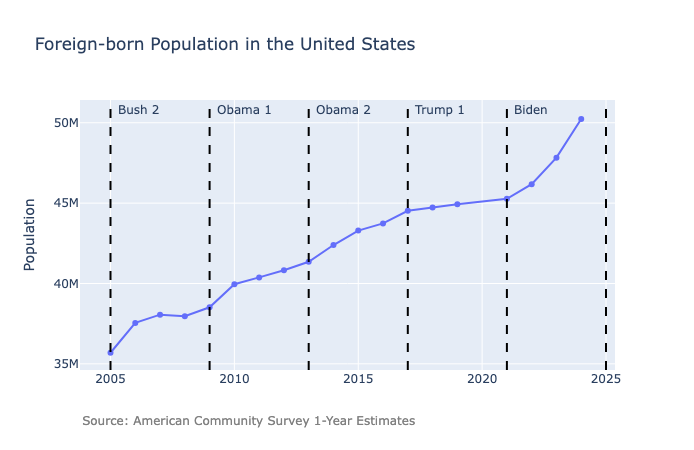
This graph shows that the foreign-born population has increased steadily since 2005, with a particularly large increase during the Biden administration.
Graphing Year-over-Year Change
Sometimes it is helpful to show the year-over-year changes instead of raw values. To do that, call plot_nativity_change with a dataframe and a column:
fig = plot_nativity_change(df, column="Foreign-born")
fig.show()
Note: In Jupyter notebooks, you can simply call plot_nativity_change(df, column="Foreign-born") as the last line of a cell and the figure will render automatically. In a Python REPL or script, assign the figure to a variable and call .show().
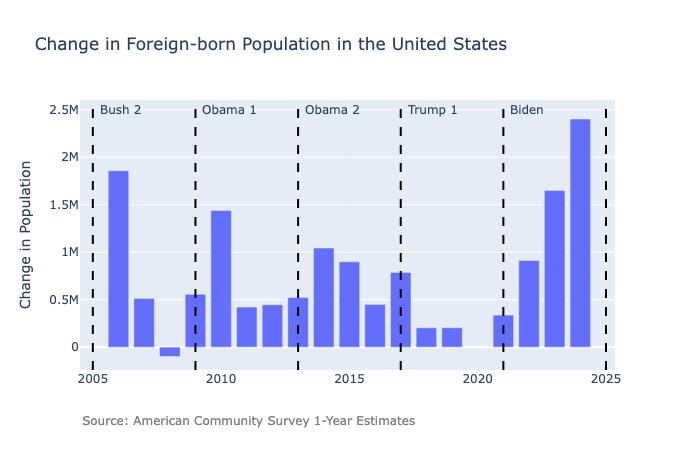
This chart makes it clear that the only year when the foreign-born population decreased was 2008.
Choosing a Geography
get_nativity_timeseries can provide data for several geographies covered by the ACS 1-year estimates. This includes the nation, all states, the District of Columbia, all metropolitan statistical areas, and all counties and places (i.e., towns or cities) with populations of 65,000 or more.
To specify a geography, acs-nativity follows the same conventions as the censusdis package, which provides convenient constants for identifying Census geographies.
A geography is specified using a keyword argument where:
- the keyword identifies the geography type (such as
state) - the value is a constant imported from a
censusdismodule (such ascensusdis.states)
Installing acs-nativity automatically installs censusdis, so these constants are available once the package is installed.
Below are examples for several common geographies.
| Geography | Keyword | Module for Value | Example |
|---|---|---|---|
| United States | us |
— | df = get_nativity_timeseries(us="*") |
| State | state |
censusdis.states |
from censusdis.states import MNdf = get_nativity_timeseries(state=MN) |
| County | county |
censusdis.counties.<state_name> |
from censusdis.states import NYfrom censusdis.counties.new_york import NASSAUdf = get_nativity_timeseries(state=NY, county=NASSAU) |
| City | place |
censusdis.places.<state_name> |
from censusdis.states import ILfrom censusdis.places.illinois import CHICAGO_CITYdf = get_nativity_timeseries(state=IL, place=CHICAGO_CITY) |
| Metropolitan Statistical Area (MSA) | (see note below) | censusdis.msa_msa |
from censusdis.msa_msa import EL_PASO_TX_METRO_AREAdf = get_nativity_timeseries( metropolitan_statistical_area_micropolitan_statistical_area= EL_PASO_TX_METRO_AREA) |
Note: The keyword for MSAs is
metropolitan_statistical_area_micropolitan_statistical_area,
which is too long to display cleanly inside the table.
You can learn more in the Additional Geographies section of the censusdis documentation.
Getting with the Latest Data
By default, get_nativity_timeseries() returns data for 2005–2024. These years were chosen because:
- 2005 is the first year of ACS 1‑year estimates
- 2024 is the most recent year available at the time this package was published
The Census Bureau is expected to release the 2025 ACS 1‑year estimates in July 2026. When that happens, you can retrieve the new data immediately—without updating the package—by setting end_year=2025. For example:
df = get_nativity_timeseries(end_year=2025, us="*")
This works because the package downloads data dynamically from the Census API; it does not store any data internally.


Download files
Download the file for your platform. If you're not sure which to choose, learn more about installing packages.
Source Distribution
Built Distribution
Filter files by name, interpreter, ABI, and platform.
If you're not sure about the file name format, learn more about wheel file names.
Copy a direct link to the current filters
File details
Details for the file acs_nativity-0.1.1.tar.gz.
File metadata
- Download URL: acs_nativity-0.1.1.tar.gz
- Upload date:
- Size: 7.7 kB
- Tags: Source
- Uploaded using Trusted Publishing? No
- Uploaded via: uv/0.8.12
File hashes
| Algorithm | Hash digest | |
|---|---|---|
| SHA256 |
a776b430b8e12ba4351794e4f788f077415c36126e8a23a74fe9b55f2361ad64
|
|
| MD5 |
54bfa6752ddffb3d94ea18afc0356998
|
|
| BLAKE2b-256 |
155d6e7b23151544d92ec76dbde20268f2f30be4c68aab5441cbbfd55966e947
|
File details
Details for the file acs_nativity-0.1.1-py3-none-any.whl.
File metadata
- Download URL: acs_nativity-0.1.1-py3-none-any.whl
- Upload date:
- Size: 8.7 kB
- Tags: Python 3
- Uploaded using Trusted Publishing? No
- Uploaded via: uv/0.8.12
File hashes
| Algorithm | Hash digest | |
|---|---|---|
| SHA256 |
02f06df1eb51a15c196a7399dd06fbedc2d629ff1dce188fbf6d93009d832550
|
|
| MD5 |
ac078fe99645f6866845bb22f7202b65
|
|
| BLAKE2b-256 |
79c1db48a6b0c6ee726828ac7d47ebad0583aac3f6c8d8e6d34cb3c37ad70e72
|


