
actor-debugger (Python)
An in-browser Python debugger for the Apify platform. Set breakpoints, step through your Actor, walk the call stack, inspect variables and evaluate expressions in the paused frame — in a browser tab, straight from the run detail in Apify Console. No IDE, no tunnel, no SSH, nothing to install on your machine.
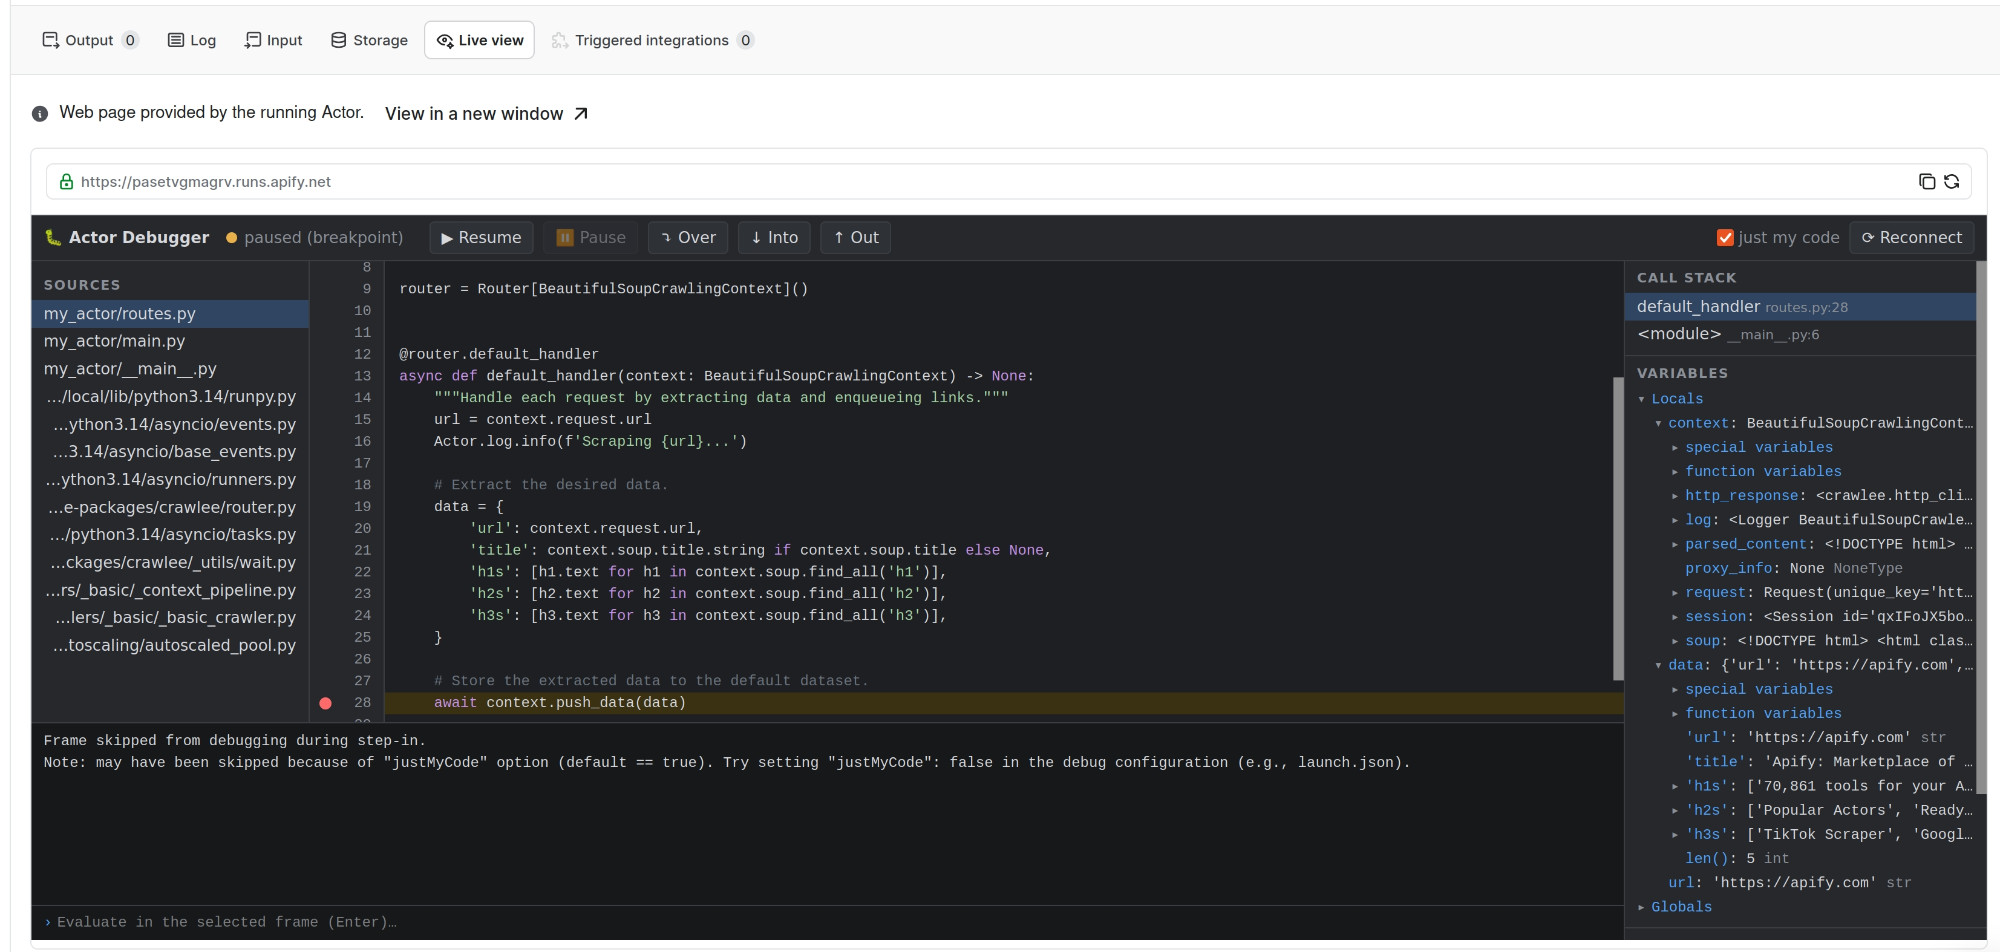
A Crawlee BeautifulSoupCrawler Actor paused on await context.push_data(data) in the Live view
tab of its run in Apify Console. Sources on the left, call stack and locals on the right (the scraped
data dict included), an evaluate prompt for the selected frame at the bottom, and Resume / Over /
Into / Out plus "just my code" in the toolbar. Everything you see runs in the browser.
Drop-in remote debugging for any Apify Python Actor with a two-line Dockerfile change. It launches your Actor under debugpy (the debugger that powers VS Code's Python debugging) and serves a full browser debugger UI over the run's container URL — so you open one link in your own browser and debug. No IDE, no tunnel, no local setup, no rebuild of your source, and no browser or IDE inside the Actor.
This is the Python sibling of the Node/TS actor-debugger
npm package, injected the same way:
# Get the package
RUN pip install actor-debugger

# Swap the entrypoint for the debug launcher (revert this line to disable debugging):
CMD ["python3", "-m", "actor_debugger", "--brk"]     # was e.g.: CMD ["python3", "-m", "src"]
That's the entire integration — no code changes, no new ports, no platform configuration. Build, run, and the run log prints one URL:
[actor-debugger] OPEN THIS in your local browser for a full debugger UI (no local setup):
[actor-debugger]   https://<run>.runs.apify.net/ui/
Open it: click line numbers to set breakpoints, step, inspect the call stack and variables,
evaluate expressions in the paused frame, break on exceptions. --brk pauses the Actor on its
first line until you attach — drop it to let the Actor run and attach mid-flight instead.
To try unreleased changes, install straight from the repository instead:
RUN pip install "actor-debugger @ git+https://github.com/apify/actor-debugger.git@master#subdirectory=python"
CLI forms
CMD ["python3", "-m", "actor_debugger"]              # auto-detect the Actor's entrypoint
CMD ["python3", "-m", "actor_debugger", "--brk"]     # pause on the first line until attached
CMD ["python3", "-m", "actor_debugger", "-m", "src"] # explicit module
CMD ["python3", "-m", "actor_debugger", "main.py"]   # explicit file
(actor-debugger also works as a console command; the python3 -m form is immune to PATH
surprises in slim images.)
Entrypoint detection: an explicit -m <module> / <file.py> argument always wins. Otherwise the
launcher scans the working directory for runnable packages (top-level directories with a
__main__.py) — by shape, not by name — which covers every current Apify Python template
(my_actor/), older ones (src/), and Crawlee-generated projects, whose package is named after
your project. The apify/actor-python base image ships a placeholder src/ package ("replace
this file with your actual application code") that exists in every derived image — it is
recognized by content and skipped. With several real runnable packages, src and my_actor are
preferred, otherwise the log lists the candidates and asks for an explicit -m. Flat layouts
fall back to src/main.py → main.py / __main__.py / app.py. The run log always prints
entrypoint: … so a wrong pick is immediately visible.
How it works
- It launches your Actor as
python -m debugpy --listen 127.0.0.1:5678 <entry>— the debugger runs on your code, in its own process, exactly as it normally runs. debugpy speaks the Debug Adapter Protocol (DAP), the same protocol VS Code uses. - It runs one HTTP server on
ACTOR_WEB_SERVER_PORTthat:- serves a browser debugger UI (~30 KB of static files bundled with the package) — the DAP client is JavaScript running in your browser;
- bridges a WebSocket at
/dapto debugpy's DAP-over-TCP socket, translating framing (one WebSocket message per DAP JSON message ↔Content-Length-framed TCP), injecting the adapter's loopback address intoattachrequests, and sending adisconnecton the browser's behalf when a tab closes abruptly — which is what makes page reloads re-attach cleanly; - serves
/source?path=...so the UI can display files that exist only on the container's disk (the same problem the Node version solves by inlining source maps).
- The run log prints the one URL above. Program stdout keeps flowing to the Actor run log as
usual; breakpoints live in the browser's
localStorage, so they survive reloads and re-attach automatically.
Because the container side is a dumb byte bridge, all protocol intelligence lives in the served
frontend — the Actor image gains only debugpy (~3 MB) plus the static files. The platform is
used exactly as-is: the standard container web-server port is the only channel. Prefer a raw
channel? wss://<run>.runs.apify.net/dap speaks DAP directly, one JSON message per WebSocket
text frame — any DAP client can drive it.
Security
The debug endpoint is unauthenticated — anyone who reaches the container URL can execute code
in your run (and read its env, including APIFY_TOKEN); /source additionally serves any file
readable in the container. Keep the debug CMD only in builds you are actively debugging, prefer
a restricted run/token, never ship it in a published Actor, and gate the endpoint (owner-only)
before any non-prototype use. This matches the security posture of the Node version; both need
the same hardening pass.
Notes
- Only runtime dependency is
debugpy; the HTTP server and the RFC 6455 WebSocket implementation are pure stdlib (Python ≥3.9). - A crashed or closed debugger tab never blocks a running Actor — the process only waits at
startup, and only with
--brk. - "Just my code" is applied on (re)connect; untick it in the UI header to step into library code.
1 maintainer

Metadata
1 maintainer
Release files for actor-debugger 0.1.3
For a detailed explanation of source distributions (sdists) and built distributions (wheels), please see the package formats documentation.
Source distribution (sdist)
| File | Size | Uploaded | Provenance | Actions |
|---|---|---|---|---|
| actor_debugger-0.1.3.tar.gz | 18.8 kB | With provenance | Details for actor_debugger-0.1.3.tar.gz |
Built distribution (wheel)
| File | Interpreter | ABI | Platform | Actions Reset |
|---|---|---|---|---|
| actor_debugger-0.1.3-py3-none-any.whl | Python 3 | none | any | Details for actor_debugger-0.1.3-py3-none-any.whl |
Total release size: 40.0 kB
Release files / actor_debugger-0.1.3.tar.gz
| Download URL | actor_debugger-0.1.3.tar.gz |
|---|---|
| Size | 18.8 kB |
| Tags | Source |
|
SHA-256 checksum How to use checksums |
8116e6c31ab0657788765009785ee29980ed91641e3073296e96c17a098b9cd7
|
|
BLAKE2b-256 checksum How to use checksums |
196989e85e0b35fa8131ba906dcd1f0c1998f0ad64237bef052bb90c131ba2cd
|
| Upload date | |
|
Uploaded using Trusted Publishing? What is trusted publishing? |
Yes |
| Uploaded via |
twine/7.0.0 CPython/3.13.14
|
Provenance
Provenance describes where a file came from. On PyPI, provenance is shared via attestations, which provide a verifiable record of the build or publishing details. View details, limitations and caveats.


PyPI Publish Attestation
PyPI verified that this artifact, at this checksum, originated from the publisher listed below.
Signed by GitHub Actions, verified by PyPI on Sep 22, 2026.
Transparency logRelease files / actor_debugger-0.1.3-py3-none-any.whl
| Download URL | actor_debugger-0.1.3-py3-none-any.whl |
|---|---|
| Size | 21.1 kB |
| Tags | Python 3 |
|
SHA-256 checksum How to use checksums |
b51a957978096480747aa315659e6353c9e4ccd3c705a1fd8f6e102b70f6ac0c
|
|
BLAKE2b-256 checksum How to use checksums |
18e70949a7ecc2954b3b754f4f98f54a91f722ccbda2f7332f4fa18bcf1fd3df
|
| Upload date | |
|
Uploaded using Trusted Publishing? What is trusted publishing? |
Yes |
| Uploaded via |
twine/7.0.0 CPython/3.13.14
|
Provenance
Provenance describes where a file came from. On PyPI, provenance is shared via attestations, which provide a verifiable record of the build or publishing details. View details, limitations and caveats.
PyPI Publish Attestation
PyPI verified that this artifact, at this checksum, originated from the publisher listed below.
Signed by GitHub Actions, verified by PyPI on Sep 22, 2026.
Transparency logSecurity for actor-debugger 0.1.3
Provenance
Provenance describes where a file came from. On PyPI, provenance is shared via attestations, which provide a verifiable record of the build or publishing details. View details, limitations and caveats.
Full provenance
Both files in this release have been uploaded with provenance metadata.
Attestation for actor_debugger-0.1.3.tar.gz
PyPI Publish Attestation
PyPI verified that this artifact, at this checksum, originated from the publisher listed below.
Signed by GitHub Actions, verified by PyPI on Sep 22, 2026.
Transparency logA note on package security
PyPI is a repository for distributing packages, not a service for auditing them. While third-party security researchers and our staff do their best to detect and remove malicious packages, PyPI cannot guarantee the quality, security or suitability of any given package.
To learn more about protecting yourself from malicious actors, visit our package security documentation.














