
Adaptive Voronoi Mapping
User-focused visualisation of very large labelled spatial datasets.
Given millions of geolocated points, each carrying a binary class label (0 or 1), plotting every point produces an unreadable, overplotted smear. This package instead builds an adaptive Voronoi map: it refines the domain finely where the two classes meet and coarsely where one class dominates, then summarises each region by its majority class. The result is a compact, legible picture of where each class prevails — a map the eye can read at a glance.
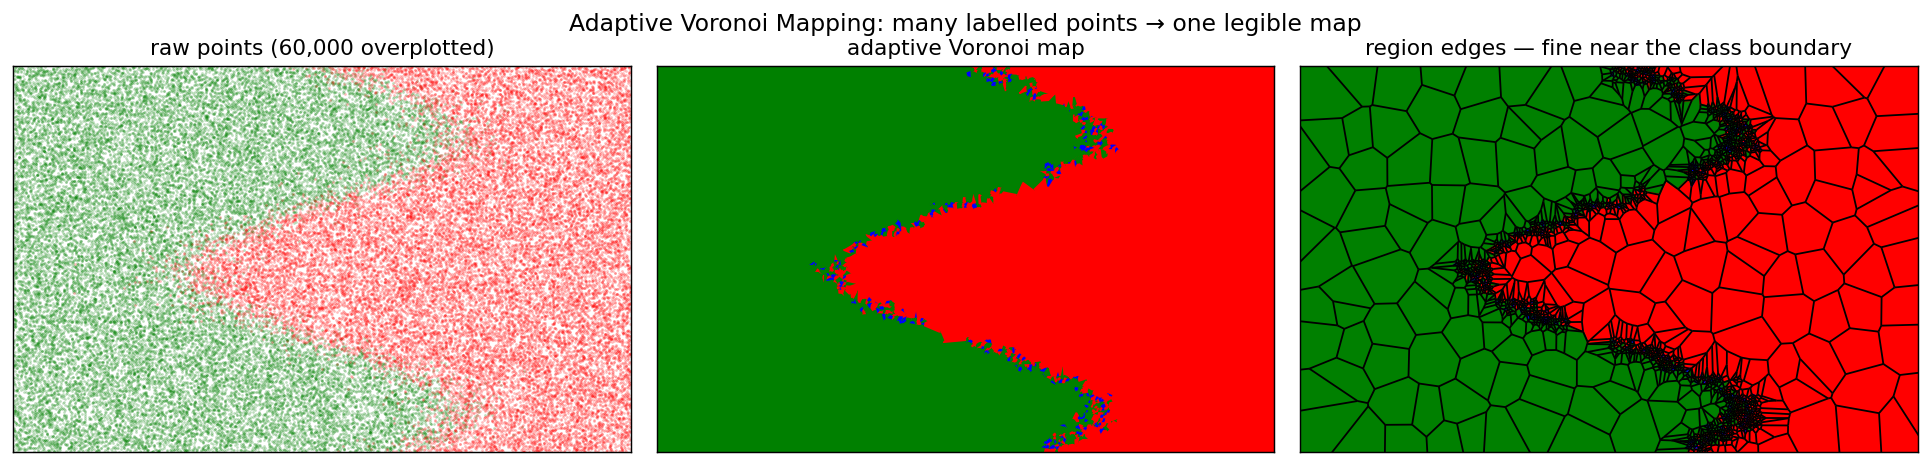
Left: 60,000 labelled points, overplotted into noise. Middle: the adaptive Voronoi map — one crisp boundary. Right: the region edges, automatically fine along the class boundary and coarse in the uniform interior.
Why Voronoi — and why it suits the human eye
This is the idea behind the master's thesis "Çok Büyük Konumsal Verinin Kullanıcı Odaklı Görselleştirilmesi" (user-focused visualisation of very large spatial data). "User-focused" means built for human perception: the goal is not a pixel-perfect scatter but a picture the visual system parses effortlessly.
Voronoi tessellations are a natural fit because the eye already reads them everywhere — a giraffe's coat, cracked soil, the veins of a leaf are all Voronoi-like partitions of space into locally-dominant cells:
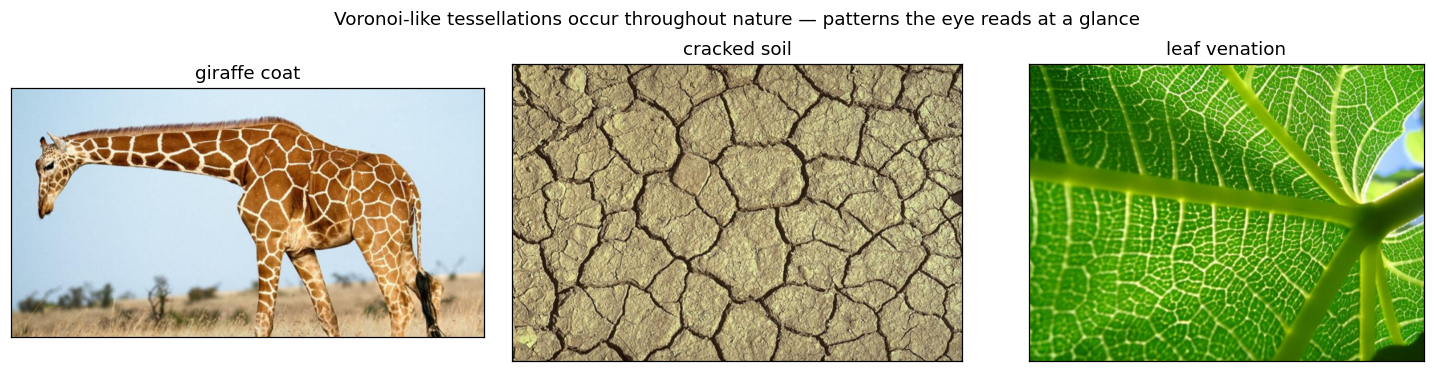
By collapsing a dense point cloud into majority-class Voronoi regions — small where detail matters (class boundaries), large where it does not — the map matches how people naturally segment a scene into regions, instead of asking them to integrate millions of overlapping dots.
How it works
- Adaptive quadtree partition (
quadtree.py). The domain is covered by a uniform grid of square cells; each cell is recursively split into four quadrants while it is too sparse (point density belowmin_density) or too mixed (class dominance belowmin_dominance), stopping atmax_depth. Cells therefore cluster around class boundaries and stay large in uniform areas. - Voronoi diagram (
mapping.py). One seed is dropped inside each leaf cell and a Voronoi diagram is built over the seeds (plus four far-away frame points that bound the outer regions). - Region colouring (
mapping.py). Every data point is assigned to its nearest seed via a ball tree; each region is coloured by the majority class of the points inside it — green for class 0, red for class 1, blue where empty. - Neighbour filter (optional). A region whose coloured neighbours are all the opposite class is flipped, removing isolated speckles.
- Rendering (
plotting.py) with matplotlib — optional region edges, overlaid raw points, and a background image.
An average_entropy metric (point-weighted mean binary entropy per region)
quantifies how class-pure the resulting map is; lower is better, and it lets
you compare parameter settings objectively.
Install
pip install adaptive-voronoi-mapping
Requires Python ≥ 3.9 (numpy, scipy, scikit-learn and matplotlib are pulled in automatically).
From a checkout, for development:
pip install -e .
Quick start
Reproduce the header figure end-to-end on a generated dataset (no data needed):
python examples/demo_synthetic.py # writes assets/hero.png
A real dataset ships with the repo (clone it to get the file — it lives
under examples/ and is deliberately left out of the pip wheel):
examples/worlddatas.txt, ~245k labelled world points that the world preset
is tuned for. A pip install-only user brings their own row col label file
instead.
# from a repo checkout: run the bundled real dataset with a ready-made preset
avmap examples/worlddatas.txt --preset world --save world.png

# or set parameters explicitly
avmap mydata.txt --height 180 --width 360 --cell-size 30 \
      --max-depth 6 --min-density 17 --min-dominance 0.4 --filter --entropy
Library:
from adaptive_voronoi import read_points, build_map, plot_map, PRESETS
import matplotlib.pyplot as plt

points = read_points("examples/worlddatas.txt")
vmap = build_map(points, **PRESETS["world"]["build"])
plot_map(vmap, points=points, **PRESETS["world"]["plot"])
plt.show()
Data format
One point per line — three whitespace-separated integers:
row col label
row and col are integer coordinates scaled by scale (100 in the thesis
datasets, i.e. hundredths of a degree); label is 0 or 1.
Presets
Three presets (turkey, world, airpollution) reproduce the thesis
experiments — each bundles the domain size and refinement parameters for one
dataset. Explicit CLI flags override any preset value.
Origin & credits
This is a clean reimplementation of the code behind the thesis above; the algorithm and behaviour are unchanged — only the code was reorganised for clarity and packaging. The three nature photographs are illustrative external images included only to motivate the Voronoi idea (they are not produced by this code and are not part of the dataset pipeline).
License
MIT — see LICENSE.
1 maintainer

Download files
Download the file for your platform. If you're not sure which to choose, learn more about installing packages.
Source Distribution
Built Distribution
Filter files by name, interpreter, ABI, and platform.
If you're not sure about the file name format, learn more about wheel file names.
Copy a direct link to the current filters
File details
Details for the file adaptive_voronoi_mapping-0.1.0.tar.gz.
File metadata
- Download URL: adaptive_voronoi_mapping-0.1.0.tar.gz
- Upload date:
- Size: 13.1 kB
- Tags: Source
- Uploaded using Trusted Publishing? Yes
- Uploaded via: twine/6.1.0 CPython/3.13.14
File hashes
| Algorithm | Hash digest | |
|---|---|---|
| SHA256 |
1a2bead9e5dbb1178e69b23d86a6433f47924289bcee3f14e12c22d5160da796
|
|
| MD5 |
f7ab1d1c5cb80aad9d5c716468c8a4cb
|
|
| BLAKE2b-256 |
803009efdd5f9e6c6b730102f827b7ae7410d16c5d256fb59937c96627d61d91
|
Provenance
The following attestation bundles were made for adaptive_voronoi_mapping-0.1.0.tar.gz:
Publisher:
release.yml on tekinertekin/adaptive-voronoi-mapping
-
Statement:
-
Statement type:
https://in-toto.io/Statement/v1 -
Predicate type:
https://docs.pypi.org/attestations/publish/v1 -
Subject name:
adaptive_voronoi_mapping-0.1.0.tar.gz -
Subject digest:
1a2bead9e5dbb1178e69b23d86a6433f47924289bcee3f14e12c22d5160da796 - Sigstore transparency entry: 2248991879
- Sigstore integration time:
-
Permalink:
tekinertekin/adaptive-voronoi-mapping@877054ff9062388be6f545942c71aace98427178 -
Branch / Tag:
refs/tags/v0.1.0 - Owner: https://github.com/tekinertekin
-
Access:
public
-
Token Issuer:
https://token.actions.githubusercontent.com -
Runner Environment:
github-hosted -
Publication workflow:
release.yml@877054ff9062388be6f545942c71aace98427178 -
Trigger Event:
push
-
Statement type:
File details
Details for the file adaptive_voronoi_mapping-0.1.0-py3-none-any.whl.
File metadata
- Download URL: adaptive_voronoi_mapping-0.1.0-py3-none-any.whl
- Upload date:
- Size: 13.3 kB
- Tags: Python 3
- Uploaded using Trusted Publishing? Yes
- Uploaded via: twine/6.1.0 CPython/3.13.14
File hashes
| Algorithm | Hash digest | |
|---|---|---|
| SHA256 |
f5089e1083c908e9a8663b7d0a4d2ac041a63b6bfe675b85948b0a7603f467a9
|
|
| MD5 |
54370b5b3106752bcc38df194139d035
|
|
| BLAKE2b-256 |
8d5f5b38528c1264ba987a6a3099f707b1508e500cfc7e256f92290f1bd03919
|
Provenance
The following attestation bundles were made for adaptive_voronoi_mapping-0.1.0-py3-none-any.whl:
Publisher:
release.yml on tekinertekin/adaptive-voronoi-mapping
-
Statement:
-
Statement type:
https://in-toto.io/Statement/v1 -
Predicate type:
https://docs.pypi.org/attestations/publish/v1 -
Subject name:
adaptive_voronoi_mapping-0.1.0-py3-none-any.whl -
Subject digest:
f5089e1083c908e9a8663b7d0a4d2ac041a63b6bfe675b85948b0a7603f467a9 - Sigstore transparency entry: 2248992451
- Sigstore integration time:
-
Permalink:
tekinertekin/adaptive-voronoi-mapping@877054ff9062388be6f545942c71aace98427178 -
Branch / Tag:
refs/tags/v0.1.0 - Owner: https://github.com/tekinertekin
-
Access:
public
-
Token Issuer:
https://token.actions.githubusercontent.com -
Runner Environment:
github-hosted -
Publication workflow:
release.yml@877054ff9062388be6f545942c71aace98427178 -
Trigger Event:
push
-
Statement type:







