
Library for Google ADK focused on observability, telemetry, session tracing, and operational cost analysis for AI agents.

Project description
AdkTelemetry

Observability & FinOps for Google ADK agents - in real time.
AdkTelemetry is the product name. On PyPI the distribution is adktelemetry (all lowercase): use pip install adktelemetry and import adktelemetry in code.
AdkTelemetry is a Python library for Google ADK that captures runner events, token usage, estimated USD cost, and error signals, then exposes them through a built-in dashboard and JSON APIs.
Dashboard URL (example with adk web on port 8080): http://localhost:8080/adktelemetry
Installation
pip install adktelemetry
Quick start (developer)
- Enable telemetry in your agent module (call once at import time, before runs):
from adktelemetry import agentelemetry

agentelemetry(
    modelkey="YOUR_GEMINI_API_KEY",  # required - use your app’s secret/config source
    adkmodel="gemini-2.5-flash",     # optional FinOps fallback when events lack model_version
)
- Register the dashboard with
adk webby adding aservices.pynext to your app (same agents directory root ADK loads). ADK imports it before the web server builds FastAPI:
from adktelemetry.patch_cli import ensure_adk_web_server_patch

ensure_adk_web_server_patch()
- Run
adk web, open/adktelemetry, and use the time range control to match the window you care about.
Configuration in code: the library does not read environment variables by itself. You normally pass modelkey (and optionally adkmodel) from your own configuration - for example os.environ["GEMINI_API_KEY"], a secrets manager, or Django settings.
What you get (how to read the data)
| Surface | Purpose |
|---|---|
| Dashboard | Human-readable charts and tables; event-driven updates over Server-Sent Events (GET /adktelemetry/api/v1/stream) whenever a new telemetry record is stored (with a short debounce for bursts). Idle: one long-poll-style wait plus an occasional comment line (~45s) so proxies do not drop the stream. |
GET /adktelemetry/api/v1/stream |
text/event-stream for the dashboard: event: ready on connect, then event: update after each coalesced batch of store writes. |
GET /adktelemetry/api/v1/snapshot |
Same aggregates the UI uses; optional since / until (Unix seconds) for a time window. The UI calls this after each update event (and once on load), not on a fixed timer. |
GET /adktelemetry/api/v1/session_detail |
Per-session brief from the in-memory buffer (user_id, session_id query params). |
GET /adktelemetry/api/v1/pricing_catalog |
Reference FinOps rates shown in the UI (USD per 10K tokens) plus a catalog reference date (month/year). |
GET /adktelemetry/api/v1/error_breakdown |
Error counts grouped by short label for the selected range (same query rules as snapshot). |
Interpreting a snapshot (filtered mode): totals rolls up only sessions that had at least one event in [since, until]. sessions and model_distribution are recomputed from stored events in that window. applied_range is { "since", "until" } when filtering, or null for the full in-memory snapshot. pricing_models is the count of model IDs in the active FinOps catalog (informational; opens the catalog modal from the header).
Events without a usable timestamp are omitted when filtering by range, so very old or malformed records may not appear in windowed views.
Dashboard guide (metrics & usability)
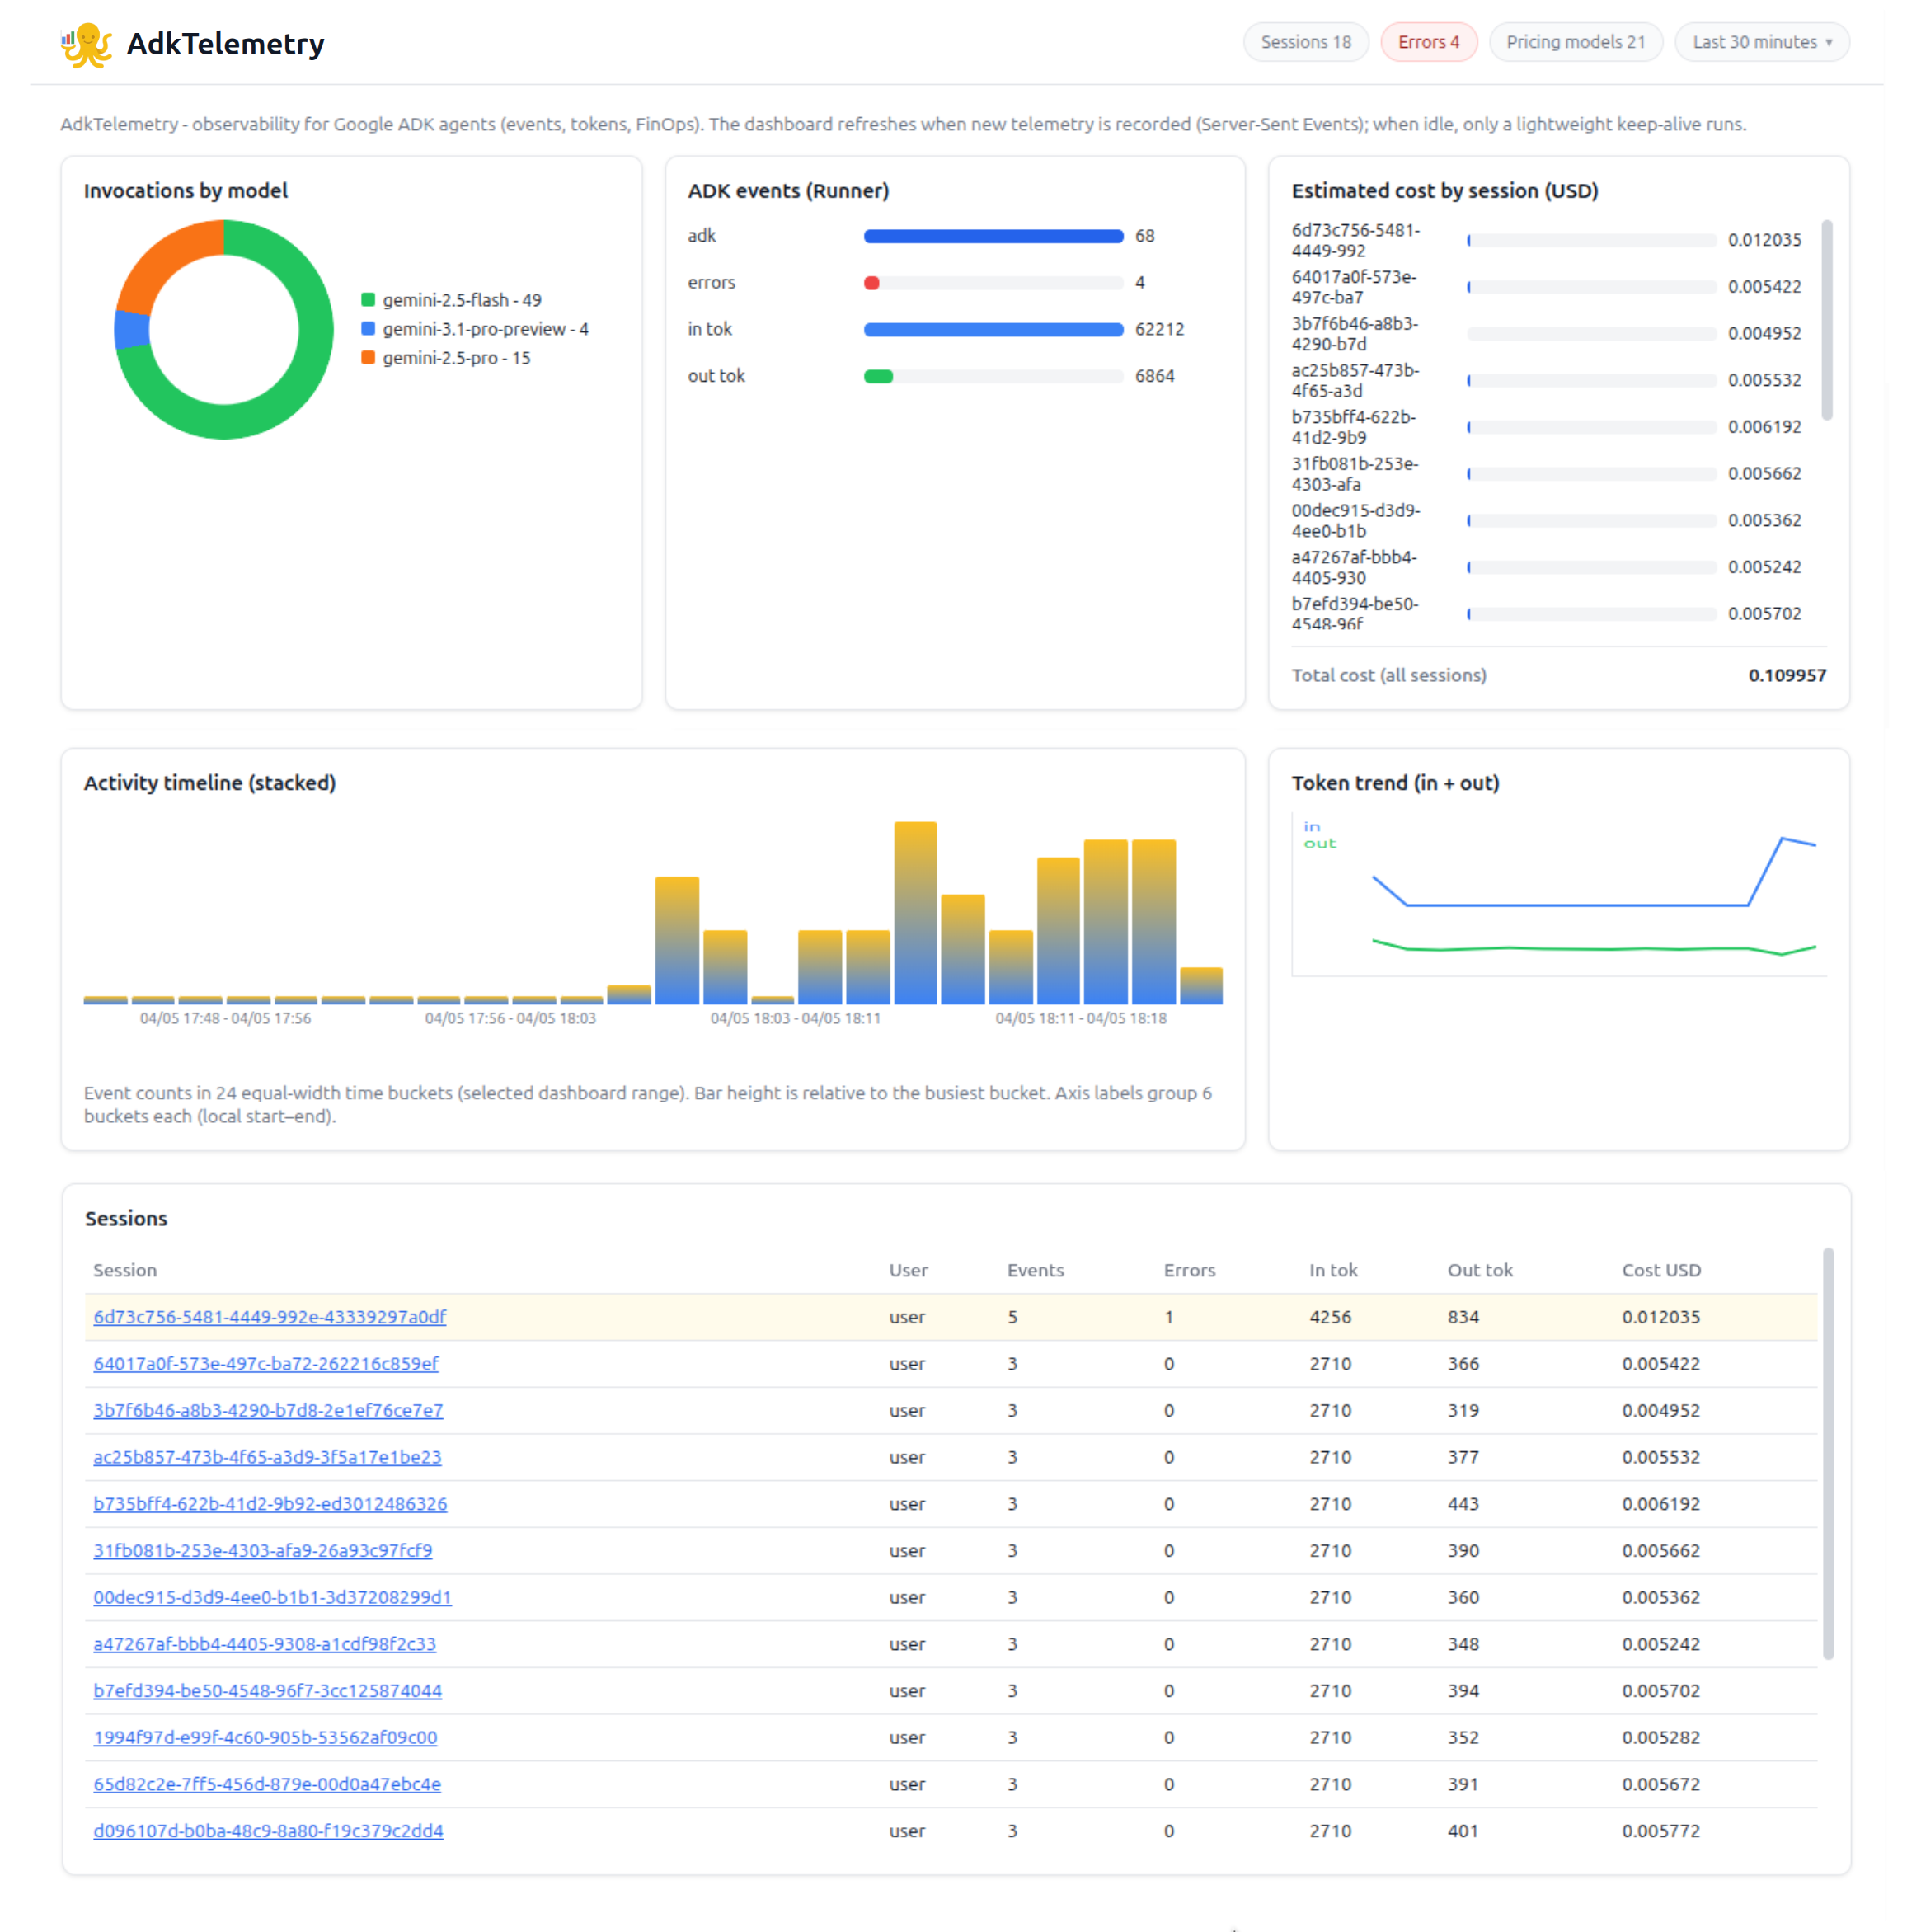
The layout is a single page: header (summary pills + time range), then a grid of cards, then Sessions Errors and Sessions tables. All numeric cards respect the selected time range except when you load the snapshot API with no since/until (full store).
Time range (header, right)
| Control | Behavior |
|---|---|
| 15 / 30 minutes, 1 hour, 12 hours | Sliding window ending at “now” on each refresh. |
| Custom | Start and end dates in the local timezone (start 00:00, end 23:59:59.999). Maximum span 31 days. |
Changing the range updates the snapshot query, recomputes aggregates, and keeps drill-down modals aligned with the same window.
Header pills (clickable)
| Pill | Shows | Click opens |
|---|---|---|
| Sessions | Count of sessions with activity in the current range (or all sessions in unfiltered snapshot mode). | Sessions overview modal: total sessions, input/output tokens, total estimated USD, last interaction timestamp (latest session activity in the window). |
| Errors | Sum of per-session error counts in the range. | Error breakdown modal: pie chart by short error label, legend with % and counts, and a top category callout with a representative message when available. |
| Pricing models | Number of models in the FinOps catalog used for estimates. | Gemini FinOps catalog modal: table of input/output USD per 10,000 tokens per model, unit disclaimer, link to official Google pricing, and the catalog reference month/year (see FinOps below). |
Invocations by model
- Donut + legend - share of invocation counts by resolved model key in the range.
- Counts come from each event’s
model_version, with FinOps resolution and fallback toadkmodelwhen the event has no model. - Legend lists up to 8 rows; the distribution object in JSON may contain more keys.
ADK events (Runner)
Four horizontal bars (not a single combined scale):
- adk - total runner event count in the range (
totals.events). - errors - total error count (
totals.errors), same basis as the Errors pill. - in tok / out tok - prompt and candidates token totals (
totals.total_input_tokens,totals.total_output_tokens).
Bar length is normalized within two groups: events vs errors share one max; input vs output tokens share another. Use this card to compare volume of ADK traffic, error load, and token volume side by side.
Estimated cost by session (USD)
- One row per session in the snapshot list: truncated session id, relative bar (max = largest session cost in the list), cost to six decimals.
- Scroll shows roughly seven rows; more sessions scroll inside the card.
- Footer - Total cost (all sessions) = sum of
total_cost_usdfor every session in the current range’s payload (not only visible rows). This matches FinOps recomputation from events in the window.
Activity timeline (stacked)
- 24 equal-width time buckets over the selected dashboard range (when filtering) or over min–max of buffered event timestamps (unfiltered full snapshot).
- Each bar’s height is relative to the busiest bucket (tooltip: event count + local time span for that bucket).
- Axis labels group 6 buckets each (local start–end text).
- If timeline metadata is missing, the UI falls back to a placeholder layout (illustrative heights); with valid
activity_timeline.since/until/counts, the chart is wall-clock faithful for the range.
Token trend (in + out)
- Uses up to the 14 most recent sessions in the snapshot (by
last_timestamp), not chronological chat order. - Blue = input tokens, green = output tokens per session.
- Lines are drawn with horizontal inset so paths do not run over the in / out legend text.
Sessions Errors
- Columns: Time, Session, Author, Code, Message.
- Rows combine native
LlmResponseerror fields and plain-text failures (e.g.Error: …) on model/system content - same signals that increment the Errors column in Sessions. - Up to 40 rows per refresh in the UI; the API may return more in
recent_errors(still subject to the global in-memory cap - see limitations).
Sessions
- Columns: Session (link), User, Events, Errors, In tok, Out tok, Cost USD - all recomputed for the selected range when filtering.
- Rows with Errors > 0 are highlighted.
- Up to 50 session rows per refresh.
- Click the session id to open Session detail (modal): session/user ids, first/last buffered event times, buffer stats (event count, authors order, token totals from buffer), optional errors brief, and a short disclaimer that the brief is deterministic from the ring buffer (no LLM), and old events may have rotated out.
REST API summary
GET /adktelemetry/api/v1/stream
Content-Type:text/event-stream(SSE).event: ready— sent once when the browser connects (dashboard does not depend on it for the first paint; it already runs an initialsnapshotfetch).event: update— emitted after the in-memory store receives new telemetry (Runner events and captured SSE errors), with a ~80ms debounce so a single model turn does not flood the client.- Comment lines (
: keepalive) — about every 45 seconds while idle so intermediaries treat the connection as alive.
Open one stream per dashboard tab. If the connection drops, the UI reconnects after ~3 seconds.
GET /adktelemetry/api/v1/snapshot
| Query | Description |
|---|---|
since |
Optional. Range start (Unix seconds). |
until |
Optional. Range end (Unix seconds). |
- If both are omitted → full in-memory aggregate;
applied_rangeisnull. - If either is set →
untildefaults to now,sincedefaults to 15 minutes beforeuntilif omitted. since<untilrequired; range length ≤ 31 days or 400.
GET /adktelemetry/api/v1/session_detail
| Query | Description |
|---|---|
session_id |
Required. |
user_id |
Required. |
Returns 404 if the session is unknown to the store.
GET /adktelemetry/api/v1/pricing_catalog
Returns models (rows with model_id, input_usd_per_10k, output_usd_per_10k), unit_label, catalog_updated (MM/YY reference), and pricing_doc_url. Use this if you need the same reference the UI shows.
GET /adktelemetry/api/v1/error_breakdown
Same since / until rules as snapshot. Body includes total, slices (label, count, percent), and optional top with a longer message sample for the dominant label.
FinOps (estimates)
- Session and total USD values are estimates from token counts and the library’s shipped FinOps catalog (list-style rates). They are not a substitute for your Google Cloud / Gemini billing exports.
- Tiered pricing, modalities, or discounts may differ; the UI and catalog modal note that official pricing may vary.
- The catalog reference date appears as month/year (e.g. in the page footer, the FinOps catalog modal, and the
catalog_updatedfield from/adktelemetry/api/v1/pricing_catalog). Always check that date when comparing estimates to real invoices - the catalog is refreshed on a schedule by support / operations, not by each application team. - For the latest public list prices, use the linked Gemini API pricing documentation.
Limitations (in-memory store)
- Per-session ring buffer of recent raw events (default 500). Long custom ranges can be incomplete if events aged out.
- Global error list is capped (200); the dashboard shows up to 40 error rows per refresh from the filtered/recent list.
- Not durable: process restart clears telemetry.
License
MIT License © 2026
Release history Release notifications | RSS feed


Download files
Download the file for your platform. If you're not sure which to choose, learn more about installing packages.
Source Distribution
Built Distribution
Filter files by name, interpreter, ABI, and platform.
If you're not sure about the file name format, learn more about wheel file names.
Copy a direct link to the current filters
File details
Details for the file adktelemetry-0.1.0.tar.gz.
File metadata
- Download URL: adktelemetry-0.1.0.tar.gz
- Upload date:
- Size: 49.5 kB
- Tags: Source
- Uploaded using Trusted Publishing? No
- Uploaded via: twine/6.2.0 CPython/3.13.7
File hashes
| Algorithm | Hash digest | |
|---|---|---|
| SHA256 |
d8dcae81db45bf7fbf1e39850e1f3e21bf6173fca80475d25060b053572e6ea6
|
|
| MD5 |
75390e419b9f5be6e7550d0bbdfc1f23
|
|
| BLAKE2b-256 |
79ed21436e5f80a8f3769cb7037db96d96ed4aea48e1f15a72e9a110b46f82c1
|
File details
Details for the file adktelemetry-0.1.0-py3-none-any.whl.
File metadata
- Download URL: adktelemetry-0.1.0-py3-none-any.whl
- Upload date:
- Size: 43.9 kB
- Tags: Python 3
- Uploaded using Trusted Publishing? No
- Uploaded via: twine/6.2.0 CPython/3.13.7
File hashes
| Algorithm | Hash digest | |
|---|---|---|
| SHA256 |
7efb5f5c0f643eed01af97aa19d273b38b129000b6264f1c26c086d5b490032e
|
|
| MD5 |
b4b333adf1cf75b6e2762a1342515f5f
|
|
| BLAKE2b-256 |
9ea4cfedc5267aa7d7d6048a20a8f8bd23363e291bf2b8909f3454e7dc85f2f3
|






