RubixHeatmap class for plotting complex, highly customizable heatmaps with metadata as HTML and PNG
Project description
Status
Compatibilities

Contact
AdRubix
Package allowing to create RubixHeatmap objects for plotting complex, highly customizable heatmaps with metadata.
The interest of such a visualization is to highlight clusters in data and to track any patterns vis-à-vis metadata.
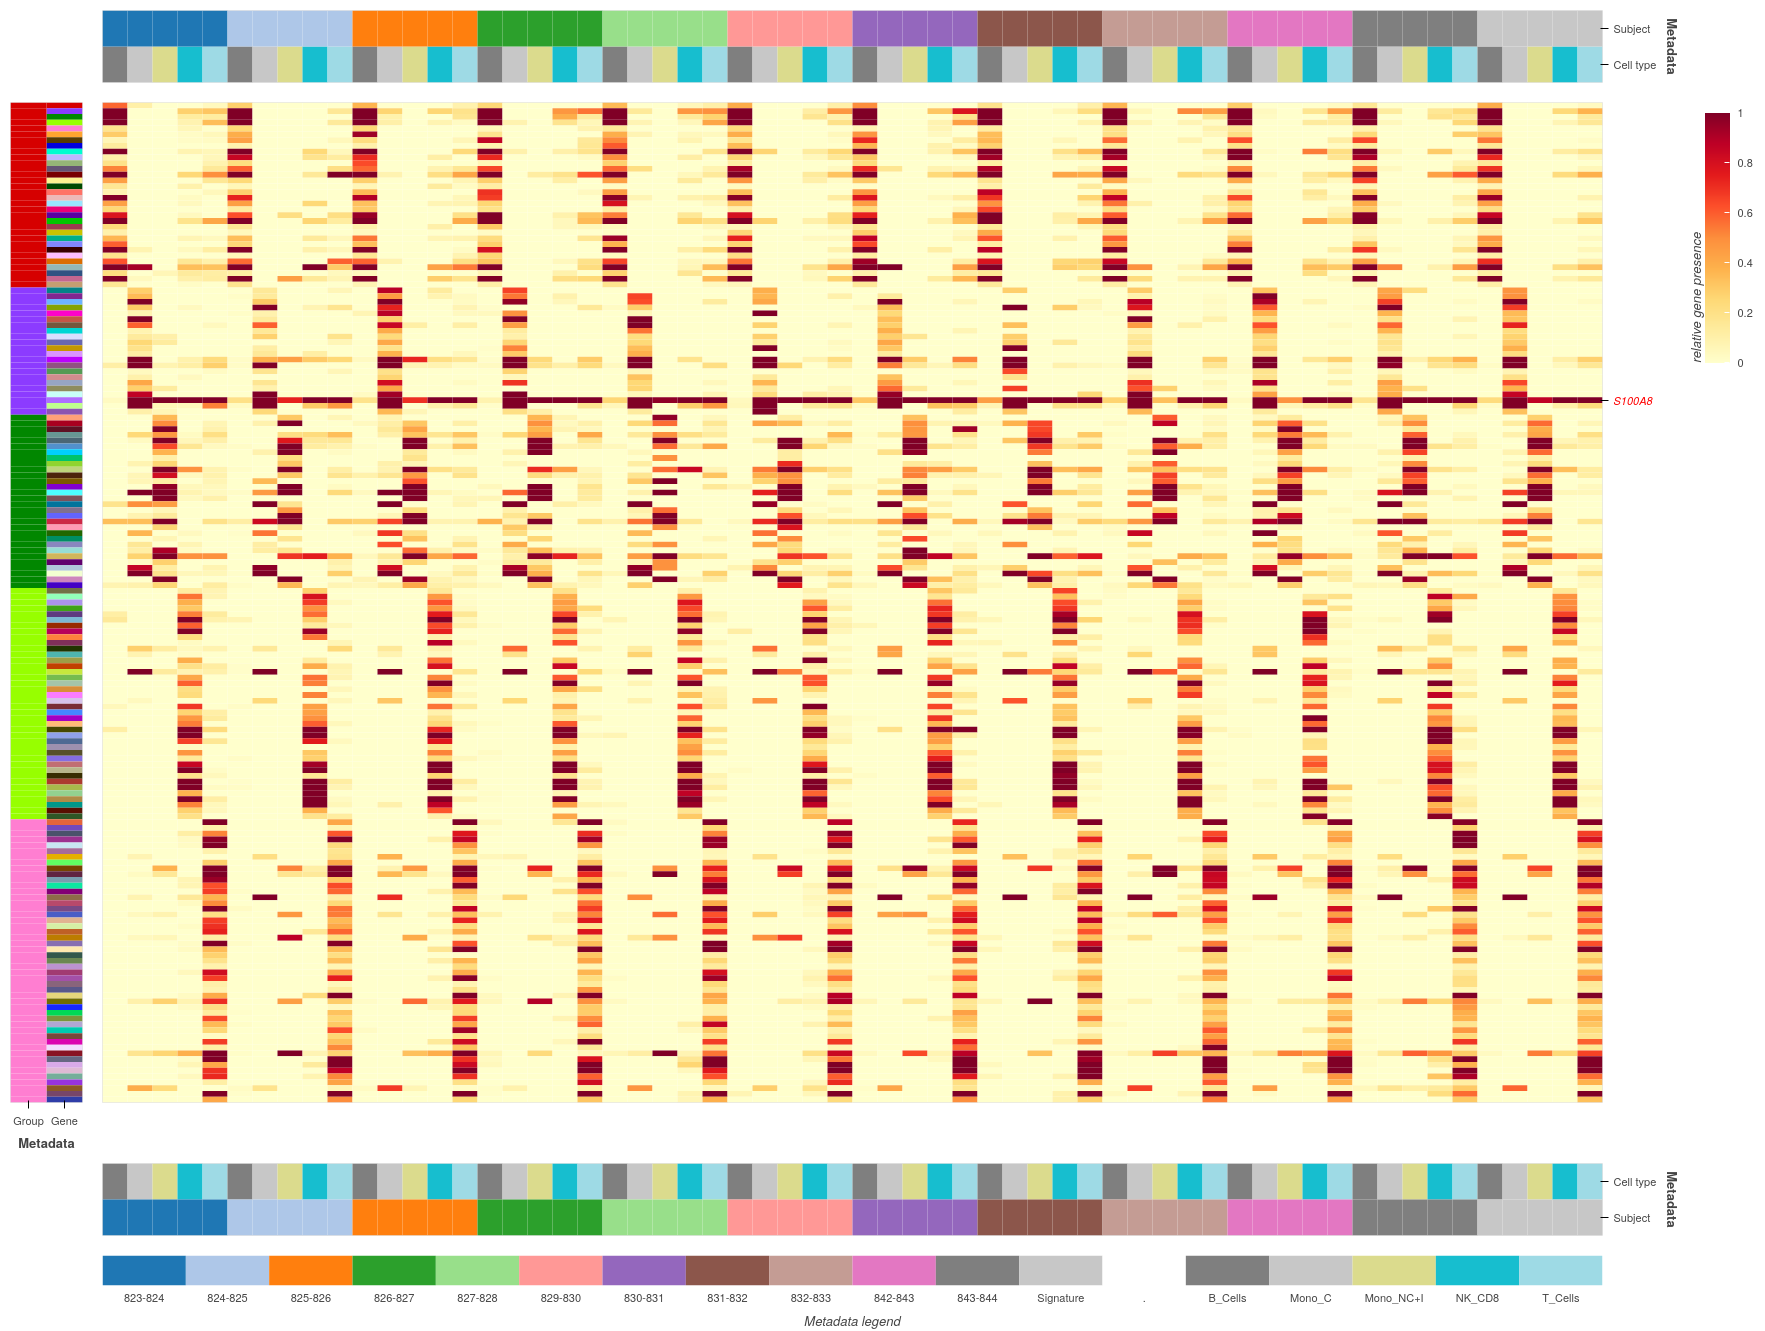
Example of a heatmap created using AdRubix:

Input
Three input files (CSV) or pandas DataFrames (in any combination) are expected:
-
Main data
Generally comes clusterized: for example, by applying AdNMTF to raw data.
- Example A (see figure above) : rows = genes, columns = cell groups for each patient
- Example B : rows = biomarkers at different timepoints, columns = patients
-
Metadata for rows
Index of these metadata should correspond to the index of main data (at least partially, in which case the plot will only keep the matching rows).
- Example A : column 1 = gene group, column 2 = gene
- Example B : column 1 = timepoint, column 2 = biomarker
-
Metadata for columns
Index of these metadata should correspond to the columns of main data (at least partially, in which case the plot will only keep the matching columns).
- Example A : column 1 = patient, column 2 = cell type
- Example B : column 1 = score (Y/N), column 2 = treatment, column 3 = cluster
The resulting plot layout is composed of the following elements, all rendered using holoviews.HeatMap()
and fine-tuned via Bokeh plot parameters :
####  [CA]  ####

[RA]  [MP]  [RL]

####  [CL]  ####
[MP]main plot (with colorbar on the right)[RA]row annotations (from metadata for rows)[CA]column annotations (from metadata for columns) : can be duplicated under the main plot for long DFs[RL]row legend (RA explained) : optional[CL]column legend (CA explained) : optional####white space filler
Output
plot() method of the class will save :
- HTML plot with an interactive toolbar enabling zooming into main heatmap and metadata
- PNG image corresponding to the HTML plot (without toolbar) : if
save_pngevaluates to True
With plot_save_path specified, HTML and PNG are saved according to it,
otherwise, HTML only is saved in current working directory to be able to show the plot.
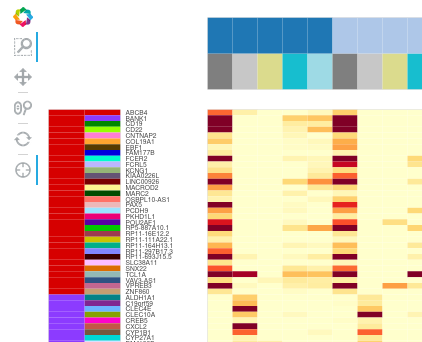
HTML toolbar

The image above gives an example of toolbar for AdRubix HTML plot. It comprises the following Bokeh tools, top to bottom:
- Box Zoom (activated by default) : drag & drop to select a rectangular area for zooming in
- Pan : drag to move a zoomed-in image around
- Wheel Zoom : zoom in or out with your mouse wheel
- Reset to the initial view (after any combination of zoom and pan)
- Crosshairs from mouse location (activated by default)
You can activate/deactivate any zoom, pan or crosshairs tool by clicking on it.
WARNING. When using row_labels_for_highlighting parameter, zoom can only work linked between
main data and column annotations. With row_labels_for_highlighting=None, zoom is always linked between main data
and both row and column annotations.
Requirements for saving PNG
To be able to save plots as PNG files, ideally you should have :
- Firefox web browser and geckodriver installed on your machine
- Folders with the executables of Firefox and geckodriver added to your system PATH environment variable
Main parameters
Default values are bolded, where applicable.
-
Data input and plot output
data(DF) ordata_file(CSV file name)metadata_rows(DF) ormetadata_rows_file(CSV file name)metadata_cols(DF) ormetadata_cols_file(CSV file name)data_pathrequired if any of[...]_fileparameters are used. Do not forget a slash at the end of the path. Also, if you work on a Windows machine, be sure to use double backslashes\\instead of single slashes.- [ optional ]
plot_save_path= path to HTML file to be saved, including its name. If None is provided, HTML is saved in current working directory under the name<your_python_script_name>.htmland automatically opened in a web browser. - [ optional ]
save_png= True/False or 1/0. PNG image will be saved in the same folder as HTML under the same name except for the extension .png
-
Data scaling and normalization + Dataprep
NB. It is still preferred that you do data scaling and/or normalization externally before using
RubixHeatmapin order to have more control and transparency over your data.NB. If you go for it, for one axis you must choose between
scale_alongandnormalize_along. You cannot use both simultaneously along the same axis.- [ optional ]
color_scaling_quantile= quantile for getting rid of outliers (in %), default 95, accepted 80...100. Applied both toscale_alongandnormalize_alongoptions.- When applied to
scale_along,color_scaling_quantile=95will cap top (> 95% quantile) values. - When applied to
normalize_along,color_scaling_quantile=95will cap both top (> 97.5% quantile) and bottom (<2.5% quantile) values before normalizing data (see below).
- When applied to
- [ optional ]
scale_along= "columns"/"rows" or 0/1 for scaling and capping data along the specified axis. Default : None = do nothing. - [ optional ]
normalize_along= "columns"/"rows" or 0/1 for scaling and capping + normalizing data along the specified axis :(x - median(x) by column or row) / MAD(x) by column or row, whereMADis median average deviation. Default : None = do nothing. - [ optional ]
data_rows_to_drop,data_cols_to_drop= lists of the names of rows/columns in main data not intended to be plotted. Nonexistent names will be skipped without raising an error.
- [ optional ]
-
Colorbar
- [ optional ]
colorbar_title(no title by default) - [ optional ]
colorbar_height,colorbar_location= "top"/"center"/"bottom" (always to the right of the main plot) - [ optional ]
show_colorbar= True/False
- [ optional ]
-
Metadata
- [ optional ]
show_metadata_rows= True/False - [ optional ]
show_metadata_rows_labels= True/False (font size is adapted to main dataframe length and to heatmap height, between 5pt and 10pt) - [ optional ]
show_metadata_cols= True/False - [ optional ]
duplicate_metadata_cols= True/False/None (if None, set automatically to True for DFs longer that 70 rows)
- [ optional ]
-
Legends
- [ optional ]
show_rows_legend= True/False - [ optional ]
show_cols_legend= True/False
- [ optional ]
-
Colormaps (must be known by holoviews)
- [ optional ]
colormap_main(default "coolwarm" / "YlOrRd" for non-negative data) - [ optional ]
colormap_metarows(default "Glasbey") - [ optional ]
colormap_metacols(default "Category20")
- [ optional ]
-
Plot dimensions (in terms of the main heatmap)
- [ optional ]
heatmap_width,heatmap_height: either sizes in pixels, or one size and the other "proportional". If neither is specified, plot dimensions will be proportional to the DF size (6 screen pixels per row or column).
- [ optional ]
-
Other
- [ optional ]
row_labels_for_highlighting= list of keywords for identifying row labels to be highlighted (in red and italic to the right of the heatmap). See WARNING in Toolbar section.
- [ optional ]
Example of usage
from adrubix import RubixHeatmap

hm = RubixHeatmap(
    data_path="/home/user/myproject/data/",
    data_file="main_data.csv",
    metadata_rows_file="meta_rows.csv",
    metadata_cols_file="meta_cols.csv",
    plot_save_path="/home/user/myproject/output/plot.html",
    save_png=True,
    scale_along="columns",
    colorbar_title="my colorbar",
    colorbar_location="top",
    show_metadata_rows_labels=True,
    show_rows_legend=False,
    colormap_main="fire",
    heatmap_width=1500,
    heatmap_height=1000,
    data_rows_to_drop=["useless_row_1", "useless_row_2"],
    row_labels_for_highlighting=["row_keyword_A", "row_keyword_B"]
)
hm.plot()
Project details
Release history Release notifications | RSS feed
Download files
Download the file for your platform. If you're not sure which to choose, learn more about installing packages.


