
AEI Microwave Link Exposure




aei-microwave-link-exposure — an AID Edge Inc. open-source engineering
library that calculates how much a terrestrial microwave point-to-point
link is exposed to weather, using published ITU-R engineering methods.
Includes Microwave Weather Explorer, a small map-based application
built entirely on top of the library.
Part of the AID Edge aei-* engineering library family, alongside
aei-geo-features.
Status & roadmap
v0.1.0 is the first installable public release of this library -- not a
pre-release, not an incomplete package. Semver's 0.x range is the standard
way to signal initial development, not a hedge about readiness. Scope
evolves through normal versioned releases, the same way
aei-geo-features
has grown, as real-world usage and engineering feedback inform future
development.
Show me
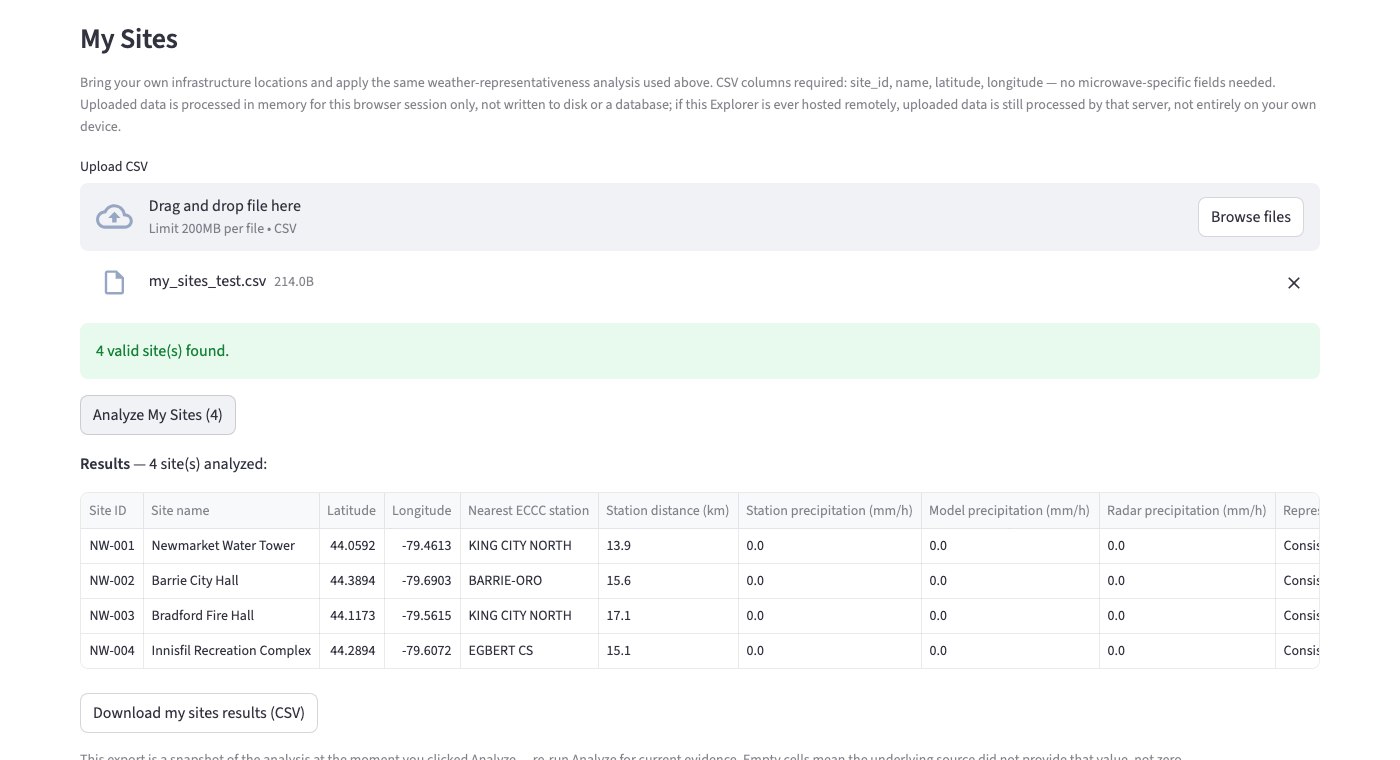
Upload your own site list, get back an Evidence Ledger you can export -- the primary workflow, and it works anywhere the underlying public weather/ECCC data has coverage. See Upload My Sites below.
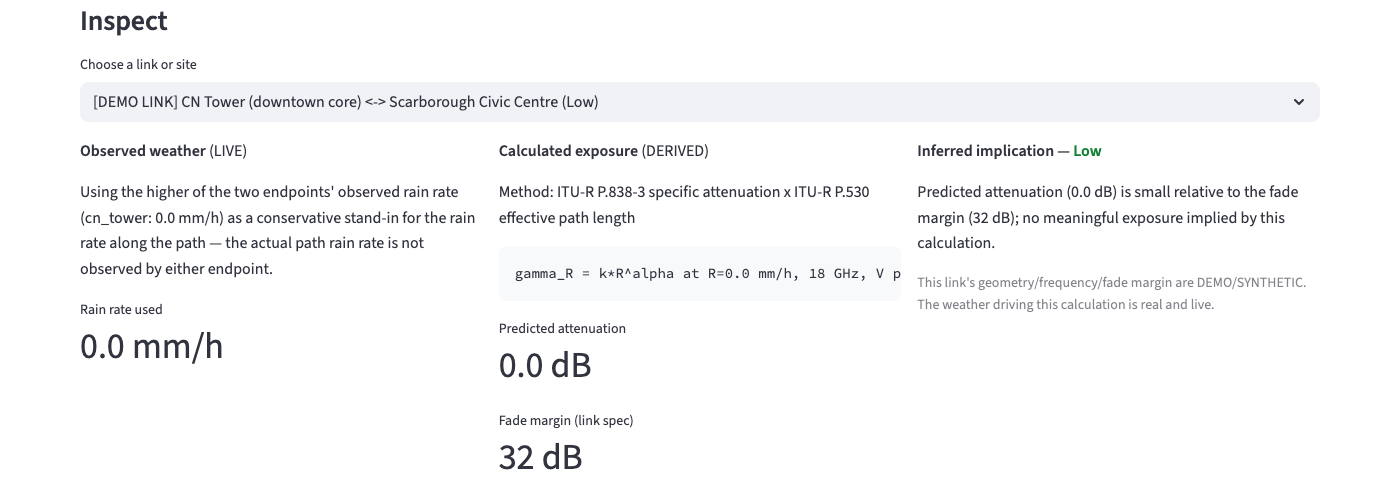
Every result is traceable: what was observed, what was calculated from it and how, and what that implies — never blended together.
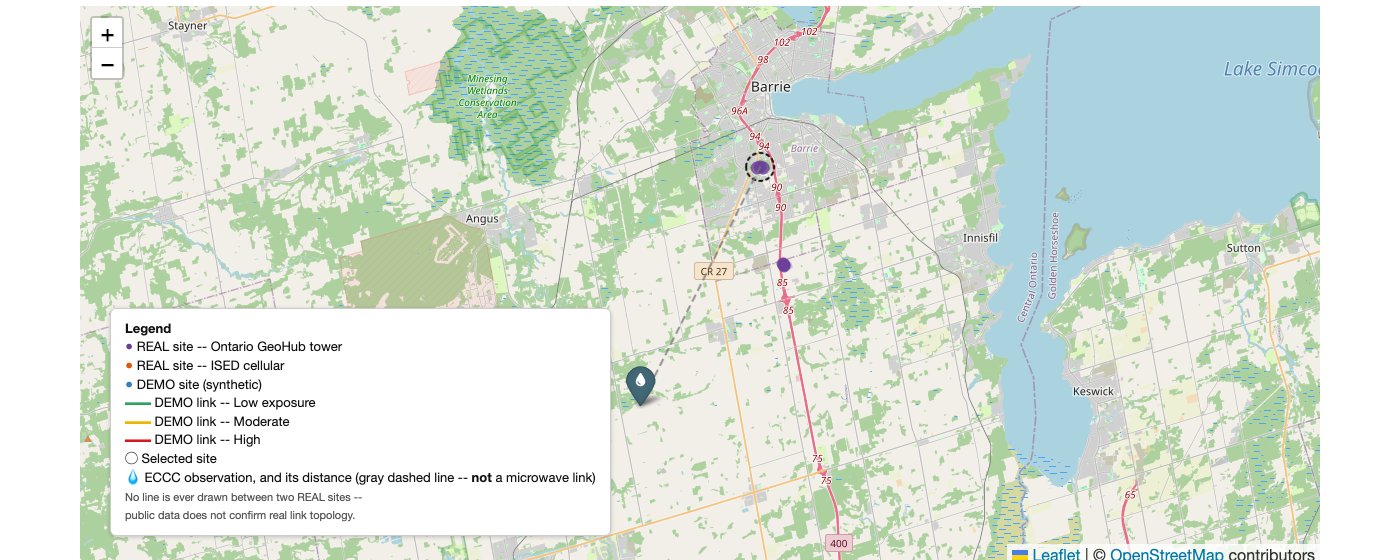
Select any site and the map shows exactly where its nearest weather evidence actually comes from, and how far away it is -- the same distance also drives the inspector panel below. See How the engineering works below.
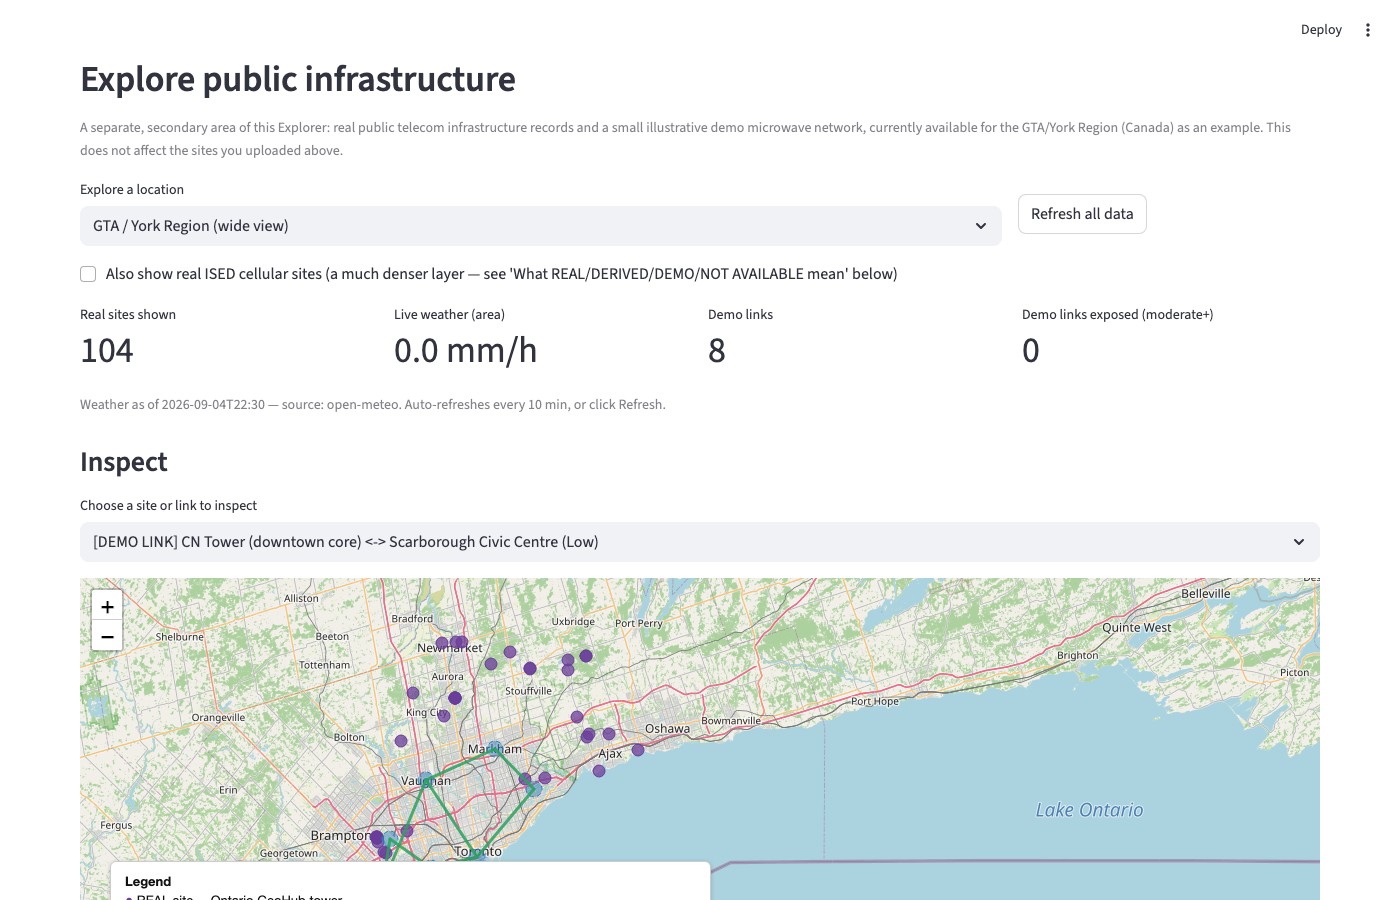
A separate, secondary area of the Explorer bundles one real public infrastructure dataset and a small illustrative demo microwave network (currently the GTA/York Region, Canada) as a worked example -- it does not limit what region you can upload your own sites for.
What is this?
Terrestrial microwave backhaul links (the fixed point-to-point radio hops that connect towers — not a cellular/RAN concept) lose signal strength in rain. This library calculates how much, from a rain rate and a link's geometry/frequency/band, using ITU-R P.838-3 (specific rain attenuation) and ITU-R P.530 (terrestrial path treatment) — published international standards, implemented transparently and independently.
Built for anyone who operates or maintains microwave backhaul or point-to-point wireless infrastructure and needs to weigh weather as a possible cause before dispatching a technician -- WISP operators, ISP and telecom field/NOC teams, transport and network engineers, and private network operators alike. It is not limited to any one type of operator or any one region.
Why this exists
Is it the weather, or your hardware? Evidence before the truck roll.
A received-signal-level (RSL) drop, a link flap, an SNMP alarm -- these tell you something changed. They do not, by themselves, tell you why.
RSL tells you something changed. It does not, by itself, tell you why.
Before a technician drives out, or before hardware gets blamed, it helps to know: was there independent, public weather evidence of meaningful precipitation near this site at the relevant time? This tool answers exactly that question, transparently, and stops there.
What this can and cannot tell you
- It shows evidence, not a verdict. For a site, it shows what independent public weather evidence exists nearby (a live observing station, a model reading, and radar where available) and whether that evidence agrees or disagrees with itself. It does not decide anything for you.
- Not a hardware diagnosis. It never determines hardware condition, never assigns a risk score, failure probability, or confidence percentage, and never tells you a specific unit failed or will fail.
- Not an outage predictor. No historical outage or performance data; no such claim is made anywhere in the library or the Explorer.
- Not a cellular coverage map, macro-cell planning tool, or RAN analytics product. It has nothing to say about mobile signal coverage or cellular network performance.
- Not a confirmed microwave topology database. Public communications infrastructure records (towers, cellular sites) are not equivalent to confirmed microwave links, and this project does not treat them as one. It never infers a link from tower proximity, antenna azimuth, frequency, height, or geographic alignment -- no matter how convincing the geometry looks. See Provenance below.
- Not an AI/ML product. No forecasting model, no learned weights, no proprietary scoring -- every number traces back to a stated formula or a cited source.
Upload example
The fastest way to see the workflow is with the working example file at
examples/my_sites_example.csv -- the
Explorer also offers it directly as a "Download example CSV" button next
to the upload control.
Minimal CSV schema -- only four columns are required, and no microwave-specific fields (frequency, fade margin, endpoint pairing, ...) are needed or accepted, because this is about site-location weather evidence, not link design:
site_id,name,latitude,longitude
NW-001,North Site,44.3500,-79.7000
NW-002,Barrie West,44.3800,-79.7600
Upload My Sites
Workflow: Upload CSV → Analyze → Inspect → Export.
- Upload a CSV of your own infrastructure sites (or the example above).
- The Explorer validates it immediately and tells you plainly how many
rows are usable and how many need attention -- invalid rows (bad
coordinates, duplicate or empty
site_id) are skipped individually and named, never silently dropped; a missing required column or an empty file rejects the whole upload with a clear message. - Click Analyze Sites. For each site, the Explorer looks up the nearest live ECCC observing station, a model reading at the site's own coordinates, and radar where available, then compares them.
- A compact summary (sites analyzed, how many found a nearby station, the breakdown of results) appears immediately, computed from that run's actual results -- nothing here is invented or hardcoded.
- Inspect any site on the map or in the panel below it. Export the result. See Evidence Ledger and Export below.
"Insufficient evidence" is an expected, honest result, not an error -- it means there wasn't enough independent weather evidence nearby to make a comparison for that site, and it is never silently substituted with a low-risk or zero value.
Privacy: uploaded data is processed in memory for your browser session only -- never written to disk or a database by this application. If this Explorer is ever hosted remotely, uploaded data is still processed by that server (coordinates are sent to Open-Meteo/ECCC to look up nearby evidence); it is not an entirely local/client-side computation.
Evidence Ledger
Every analyzed site becomes one row: the site, its representativeness result, the nearest ECCC station and its distance, the precipitation evidence from each source, and a plain-language explanation -- prioritized for scanning, with coordinates and identifiers kept but not dominant.
Provenance: an uploaded site is Provenance.USER_PROVIDED -- not
REAL (that label is reserved for cited public sources like Ontario
GeoHub/ISED) and not DEMO (a user's own infrastructure is
presumably real, just unverified here). Weather evidence for a
user-provided site is sourced exactly as transparently as for a public
site: the nearest ECCC station remains OBSERVED, the distance remains
CALCULATED, and the representativeness label remains INTERPRETED --
nothing about the analysis changes because the site came from a CSV
instead of a government dataset.
A cell an underlying source didn't provide is left empty, never substituted with a zero or a guess -- see Weather representativeness below for what each interpreted label means.
Export
Download Evidence CSV produces a snapshot of the current analysis -- stable, human-readable column names, no internal Python objects -- for engineering review or internal sharing. It reflects the moment you clicked Analyze, not live or ongoing monitoring, and it is not a claim that hardware failed or that an outage was prevented -- it is the evidence, exported.
How the engineering works
ITU-R P.838-3  +  ITU-R P.530  +  Haversine geometry
                        ↓
              aei_mw_exposure (core)
              zero runtime dependencies
                        ↓
        optional adapters (need `requests`)
   Open-Meteo  ·  Ontario GeoHub  ·  ISED  ·  ECCC
                        ↓
         Microwave Weather Explorer
           (Streamlit + Folium)
The core is reusable on its own — no Streamlit, no Folium, no network call required. Adapters are optional and swappable. The Explorer is a consumer of the core; it contains no calculation logic of its own.
The calculation, step by step
link geometry (two sites)  →  haversine distance
                                       +
weather source            →  rain rate at each endpoint
                                       ↓
                    higher of the two endpoints' rain rate
                          (a stated, conservative assumption)
                                       ↓
              ITU-R P.838-3: specific attenuation (dB/km)
                                       ×
              ITU-R P.530: effective path length (km)
                                       ↓
                    predicted attenuation (dB)
                                       ÷
                       link's stated fade margin
                                       ↓
                 exposure ratio  →  severity (low/moderate/high)
Runnable version of exactly this: examples/basic_usage.py. This full
exposure calculation currently runs on the bundled demo microwave network
(see below) because confirmed link geometry is required and is not
available from public sources for real infrastructure -- your own
uploaded sites get the weather-representativeness evidence above, not
this calculation, for the same reason.
Data sources
| Source | Type | Used for | Provenance |
|---|---|---|---|
| Ontario GeoHub — Tower dataset (MNRF) | Public government data | Real telecom tower locations + classification | REAL |
| ISED Spectrum Licences Site Data | Public government data | Real cellular/mobile site records (not microwave-band) | REAL |
| Open-Meteo | Public weather data (model) | Live rain rate, temperature, wind at any coordinate | REAL |
| ECCC SWOB-Realtime | Public government data (station observation) | Nearest live observing-station reading for representativeness | REAL |
ECCC Radar (RADAR_1KM_RRAI) |
Public government data (radar estimate) | Radar-estimated rain rate at a site's own coordinates | REAL |
Full detail, licensing, and each source's real limitations are documented
directly in src/aei_mw_exposure/infrastructure/ontario_geohub.py,
ised.py, and src/aei_mw_exposure/providers/eccc.py -- each module
states exactly what its source confirms and does not confirm.
Ontario GeoHub and ISED coverage is specific to Canada; Open-Meteo and ECCC's live station/radar coverage extend more broadly. Your own uploaded sites are analyzed wherever the underlying weather/ECCC data has coverage -- this project does not hard-code a region into that workflow.
Provenance
| Label | Meaning |
|---|---|
REAL |
Directly from a cited public record. Only fields the source actually published are shown. |
DERIVED |
Calculated by this library from REAL or DEMO inputs, using a stated method (e.g. haversine distance, the exposure calculation itself). |
DEMO |
Synthetic demonstration data. Realistic-looking, never presented as real. |
NOT_AVAILABLE |
Genuinely not available from any public source checked — a marker, not a guess. |
USER_PROVIDED |
Asserted by the person using this tool (e.g. an uploaded site list). Presumably real, but not independently verified — never labeled REAL or DEMO. |
Confirmed real-world point-to-point microwave topology is
NOT_AVAILABLE from the public sources this project uses. No line is
ever drawn between two real or user-provided sites, and no link is ever
inferred from proximity, azimuth, frequency, or geographic alignment.
This is the central, deliberate limitation of the project — not an
oversight.
Observed → Calculated → Inferred
Independent of provenance, every result -- exposure or weather representativeness -- keeps these three epistemic categories distinct:
OBSERVED                          CALCULATED                       INFERRED
weather provider rain rate   →    haversine distance          →    severity (low/moderate/high)
published infrastructure          ITU-R specific attenuation       or representativeness label
  metadata                        ITU-R effective path length      ("consistent", "moderate
timestamp, source                 predicted attenuation (dB)        disagreement", ...) --
                                   exposure ratio                    never a hardware verdict
Weather representativeness
Select a site to see the nearest ECCC precipitation observation and the physical distance between them, directly on the map -- a dashed ring on the selected site, a pin marker on the station, and a thin gray dashed line between them showing the distance. That line is not styled like a microwave link (which is always a solid, coloured line) on purpose -- it means exactly one thing: physical separation between the infrastructure and the weather-observation source, nothing more. The same evidence is also shown as text in the inspector panel below the map.
What problem does this solve? A weather value reported for a city -- or a coarse weather-model grid cell -- may not match conditions at a specific infrastructure site several kilometres away, especially during spatially variable precipitation. Before trusting a weather value at a site, it helps to know how much independent evidence actually supports it there.
Why can a city weather value differ from conditions at a site? Precipitation is not spatially uniform, particularly for convective rain. A model's grid cell and the nearest observing station both describe conditions near a point, not necessarily at it -- distance and source agreement are the two facts that tell you how much that matters here.
What data sources are used? A live ECCC observing station (nearest
within a search radius, via SWOB-Realtime), a model value at the site's
own coordinates (Open-Meteo, the same provider used elsewhere in this
project), and, when available, an ECCC radar-estimated rate at the site's
own coordinates (RADAR_1KM_RRAI, updated every 6 minutes).
What is observed? The station's own reading and the model's own reading, each unmodified, each with its own timestamp and source.
What is calculated? The distance from the site to the nearest station (haversine, reusing the same function used for link geometry elsewhere in this library), and the numeric difference between the station and model precipitation values, when both are available.
What is interpreted? A plain-language label -- Consistent / Moderate disagreement / High disagreement / Insufficient evidence -- driven by two small, named, stated thresholds (default 50 km, default 2 mm/h; both overridable). This is a documented convention, the same kind already used for exposure severity elsewhere in this library -- not a statistical confidence score, and never a hardware diagnosis.
What does this explicitly NOT claim?
- Not hyperlocal weather or microclimate prediction -- nothing here predicts anything; it compares evidence that already exists right now.
- Not AI weather, not a forecast, not a numeric confidence percentage.
- Not a claim that a station or model value is "wrong" -- disagreement between two correct, independent readings is the finding itself.
- A station that doesn't publish precipitation is shown as exactly that (not silently treated as zero rain).
- Radar is shown as a third piece of evidence but does not currently
factor into the interpreted label -- a stated scope limit, not an
oversight (see
representativeness.py).
Explore public infrastructure (secondary, example region)
A separate area of the Explorer bundles real Ontario public telecom infrastructure records and a small illustrative demo microwave network -- the only network with a full engineering exposure calculation, since it is the only one with confirmed link geometry. It is currently available for the GTA/York Region (Canada) as a worked example of what the underlying engineering can do when link topology is known; it does not limit which region your own uploaded sites can be analyzed for.
Limitations
- Confirmed real-world point-to-point microwave link topology is not available from the public sources this project uses (see Provenance). This is the project's central, deliberate honesty constraint, not an implementation gap.
- The rain rate used for a demo link is the higher of its two endpoints' observed rate — a conservative stand-in for path rain, not a measurement of it.
- The P.530 effective-path-length factor is a long-term statistical design approximation, reused here for an instantaneous rain rate.
- Severity and representativeness levels are a simple, overridable, documented convention, not a validated risk model or a confidence score.
- Real infrastructure coverage (Ontario GeoHub, ISED) is genuinely uneven by area and specific to Canada — a location with zero results there has a dataset gap, not zero infrastructure; your own uploaded sites are not limited by this.
- The ISED cellular layer's host has flagged that mirror deprecated and updates it twice a year; the Explorer degrades gracefully if it's down.
Requirements
| Component | Requirement |
|---|---|
| Python | >= 3.9 |
| Core library | none (stdlib only) |
| Weather / infrastructure adapters | requests |
| Explorer | streamlit, folium, streamlit-folium, requests |
| Tests | pytest |
Install
pip install -e .                              # core library only, zero dependencies
pip install -e ".[open-meteo]"                # + the free/keyless Open-Meteo weather provider
pip install -e ".[infrastructure]"            # + the Ontario GeoHub / ISED real-data adapters
pip install -e ".[explorer]"                  # + the Streamlit map Explorer
pip install -e ".[dev]"                       # + pytest
Quick start
from aei_mw_exposure import MicrowaveSite, MicrowaveLink, Provenance, WeatherObservation, calculate_exposure

site_a = MicrowaveSite(id="a", name="Toronto North", latitude=43.8, longitude=-79.4, provenance=Provenance.DEMO)
site_b = MicrowaveSite(id="b", name="Toronto East", latitude=43.7, longitude=-79.2, provenance=Provenance.DEMO)

link = MicrowaveLink(
    id="L1", site_a=site_a, site_b=site_b, frequency_ghz=18.0,
    polarization="V", fade_margin_db=32.0, provenance=Provenance.DEMO,
    # length_km is not passed in -- it's derived from the two sites' real coordinates
)

result = calculate_exposure(
    link=link,
    weather_by_site={
        site_a.id: WeatherObservation(latitude=43.8, longitude=-79.4, timestamp="2026-09-04T14:00", rain_rate_mm_h=22.0, source="test-fixture"),
        site_b.id: WeatherObservation(latitude=43.7, longitude=-79.2, timestamp="2026-09-04T14:00", rain_rate_mm_h=6.0, source="test-fixture"),
    },
)

print(result.severity)                                # "moderate" | "low" | "high"
print(result.exposure_ratio)                           # attenuation / fade margin
print(result.attenuation.predicted_attenuation_db)      # the physics estimate
print(result.attenuation.k, result.attenuation.alpha)   # ITU-R P.838-3 coefficients used
print(result.rain_rate_assumption)                       # states the worse-endpoint assumption explicitly
No Streamlit, no browser, no network call required. Fuller runnable
version: examples/basic_usage.py.
Loading real infrastructure
from aei_mw_exposure.infrastructure import ontario_geohub

sites, skipped, exceeded_limit = ontario_geohub.load_towers_in_bbox(
    bbox=(-79.56, 43.96, -79.36, 44.16)  # (min_lon, min_lat, max_lon, max_lat) -- Newmarket area
)
for site in sites:
    print(site.provenance, site.source, site.name, site.metadata)
Every site produced this way is Provenance.REAL. Nothing in
aei_mw_exposure.infrastructure ever produces a MicrowaveLink.
Run the Explorer
pip install -e ".[explorer,open-meteo,infrastructure]"
streamlit run app.py
Explorer workflow
- Upload your own sites (or the example CSV) and click Analyze -- see Upload My Sites.
- Review the Evidence Ledger summary and per-site results.
- Inspect any site: its identity, its weather evidence, and what that evidence does and doesn't mean.
- Export the Evidence CSV.
- Separately, explore the bundled public-infrastructure example region and its demo microwave network, including the one network with a full engineering exposure calculation -- see Explore public infrastructure.
No step here is aspirational — this is exactly what the app in this repository does today.
Project structure
aei-microwave-link-exposure/
├── src/aei_mw_exposure/
│   ├── geometry.py           haversine distance
│   ├── microwave.py           MicrowaveSite / MicrowaveLink domain model
│   ├── weather.py               WeatherObservation + WeatherProvider interface
│   ├── physics.py                 ITU-R P.838-3 / P.530
│   ├── exposure.py                 calculate_exposure() -- the one entry point
│   ├── provenance.py                 REAL / DERIVED / DEMO / NOT_AVAILABLE / USER_PROVIDED
│   ├── representativeness.py           assess_representativeness() -- station/model/radar comparison
│   ├── providers/                        optional weather adapters (open_meteo.py, eccc.py)
│   └── infrastructure/                     optional real-data adapters (ontario_geohub.py, ised.py)
├── demo/
│   ├── network.py             the synthetic demo microwave network
│   ├── locations.py            the Explorer's location picker
│   └── user_sites.py            CSV parsing for "Upload My Sites" (stdlib only)
├── docs/images/                screenshots used in this README
├── tests/                      110+ deterministic tests, no live network calls
├── examples/
│   ├── basic_usage.py          runnable library example
│   └── my_sites_example.csv     a working "Upload My Sites" CSV
├── app.py                      the Explorer -- a consumer of the library only
├── CONTRIBUTING.md
├── LICENSE
└── pyproject.toml
Contributing
| Contribution | Goes in |
|---|---|
| New weather provider | src/aei_mw_exposure/providers/ |
| New infrastructure source | src/aei_mw_exposure/infrastructure/ |
| Engineering calculation / physics | src/aei_mw_exposure/ |
| "Upload My Sites" CSV parsing | demo/user_sites.py |
| Explorer UI | app.py |
| Tests | tests/ |
Full ground rules (dependency boundaries, what a new infrastructure source must and must not claim, style) are in CONTRIBUTING.md.
Future work (not implemented)
Documented, not built: nationwide infrastructure coverage, a real ISED Fixed Service (true microwave-band) integration if a live query interface becomes available, OpenStreetMap as a supplementary source, and a licensee-shared real link dataset if one is ever made available. None of these are implied to exist today.
License
MIT — see LICENSE. Real infrastructure data retains its own government licensing (Open Government Licence – Ontario / Canada); see Data sources above for attribution.
1 maintainer

Download files
Download the file for your platform. If you're not sure which to choose, learn more about installing packages.
Source Distribution
Built Distribution
Filter files by name, interpreter, ABI, and platform.
If you're not sure about the file name format, learn more about wheel file names.
Copy a direct link to the current filters
File details
Details for the file aei_microwave_link_exposure-0.1.2.tar.gz.
File metadata
- Download URL: aei_microwave_link_exposure-0.1.2.tar.gz
- Upload date:
- Size: 55.8 kB
- Tags: Source
- Uploaded using Trusted Publishing? Yes
- Uploaded via:
twine/7.0.0 CPython/3.13.14
File hashes
| Algorithm | Hash digest | |
|---|---|---|
| SHA256 |
f2b87f517fd00db2e7aff64fb2e0ec8ad76abbe6ce7d86d39e122c6f8d7ab6fc
|
|
| MD5 |
6eb109ab16f82328b7472bca47e950e6
|
|
| BLAKE2b-256 |
46b3164374026002d11542704eef0fd7c5de4902062c2c69a0f770befbe30871
|
Provenance
The following attestation bundles were made for aei_microwave_link_exposure-0.1.2.tar.gz:
Publisher:
publish.yml on AIDEdgeInc-Lab/aei-microwave-link-exposure
-
Statement:
-
Statement type:
https://in-toto.io/Statement/v1 -
Predicate type:
https://docs.pypi.org/attestations/publish/v1 -
Subject name:
aei_microwave_link_exposure-0.1.2.tar.gz -
Subject digest:
f2b87f517fd00db2e7aff64fb2e0ec8ad76abbe6ce7d86d39e122c6f8d7ab6fc - Sigstore transparency entry: 2719698528
- Sigstore integration time:
-
Permalink:
AIDEdgeInc-Lab/aei-microwave-link-exposure@b32de21985e42c423e81a14e555ad3a80771c59e -
Branch / Tag:
refs/tags/v0.1.2 - Owner: https://github.com/AIDEdgeInc-Lab
-
Access:
public
-
Token Issuer:
https://token.actions.githubusercontent.com -
Runner Environment:
github-hosted -
Publication workflow:
publish.yml@b32de21985e42c423e81a14e555ad3a80771c59e -
Trigger Event:
release
-
Statement type:
File details
Details for the file aei_microwave_link_exposure-0.1.2-py3-none-any.whl.
File metadata
- Download URL: aei_microwave_link_exposure-0.1.2-py3-none-any.whl
- Upload date:
- Size: 41.2 kB
- Tags: Python 3
- Uploaded using Trusted Publishing? Yes
- Uploaded via:
twine/7.0.0 CPython/3.13.14
File hashes
| Algorithm | Hash digest | |
|---|---|---|
| SHA256 |
59bf794ffa46dc06721da44758d7b6e806005e80035cfdda1ad2c1f543fc1342
|
|
| MD5 |
a14b33b1735ebcef73abdff9d4591e00
|
|
| BLAKE2b-256 |
af4477411fd4ef228ebbf8fc66f87edfc3f27b948533a7a1d379f55e5bfd73c4
|
Provenance
The following attestation bundles were made for aei_microwave_link_exposure-0.1.2-py3-none-any.whl:
Publisher:
publish.yml on AIDEdgeInc-Lab/aei-microwave-link-exposure
-
Statement:
-
Statement type:
https://in-toto.io/Statement/v1 -
Predicate type:
https://docs.pypi.org/attestations/publish/v1 -
Subject name:
aei_microwave_link_exposure-0.1.2-py3-none-any.whl -
Subject digest:
59bf794ffa46dc06721da44758d7b6e806005e80035cfdda1ad2c1f543fc1342 - Sigstore transparency entry: 2719698899
- Sigstore integration time:
-
Permalink:
AIDEdgeInc-Lab/aei-microwave-link-exposure@b32de21985e42c423e81a14e555ad3a80771c59e -
Branch / Tag:
refs/tags/v0.1.2 - Owner: https://github.com/AIDEdgeInc-Lab
-
Access:
public
-
Token Issuer:
https://token.actions.githubusercontent.com -
Runner Environment:
github-hosted -
Publication workflow:
publish.yml@b32de21985e42c423e81a14e555ad3a80771c59e -
Trigger Event:
release
-
Statement type:














