
A python package to produce charts following UK Government Analysis Function guidance
Verified details
These details have been verified by PyPIProject links
GitHub Statistics
Maintainers

Project description
afcharts-py 
Overview
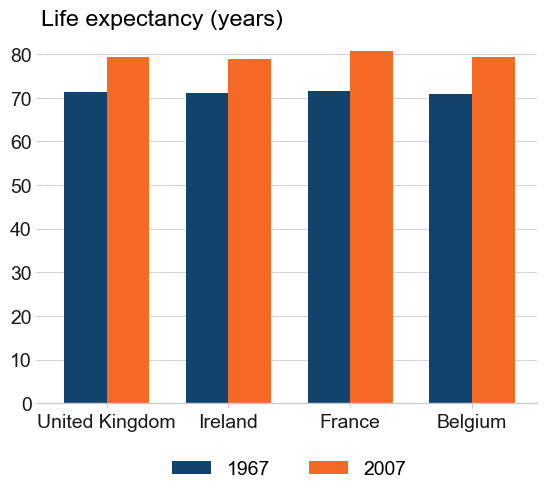
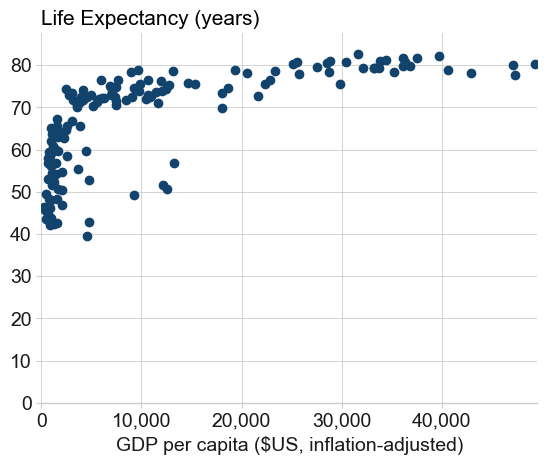
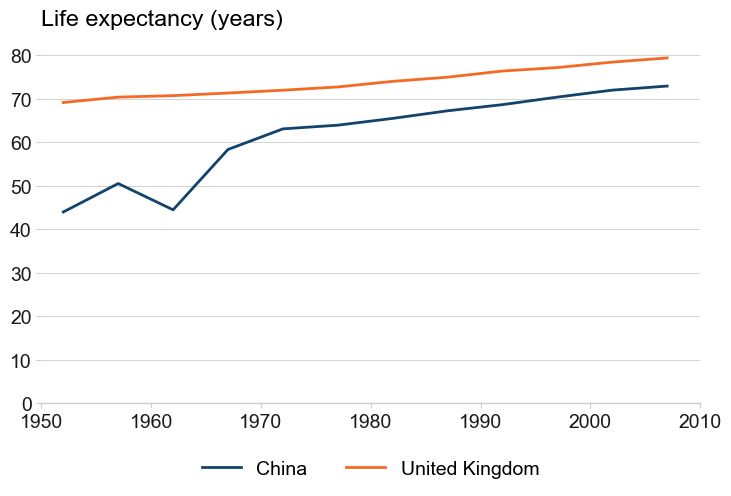
The afcharts python package helps make accessible Matplotlib and Plotly charts following Government Analysis Function Data Visualisation guidance:
- Automatic chart formatting with pre-built style sheets for Matplotlib and Plotly
- Chart colours from the Analysis Function accessible colour palettes
- Example code for common chart types in the cookbook
Looking for the R version? Check out the afcharts R package.
Installation
afcharts is available at the Python Package Index (PyPI):
pip install afcharts
or see the alternative installation instructions.
Usage
Format any Matplotlib or Plotly chart in the Analysis Function style using the built-in style sheets.
See the Getting Started guide for more options and the cookbook for extensive examples.
Matplotlib
import matplotlib.pyplot as plt

# Apply the afcharts style to all Matplotlib plots
plt.style.use('afcharts.afcharts')
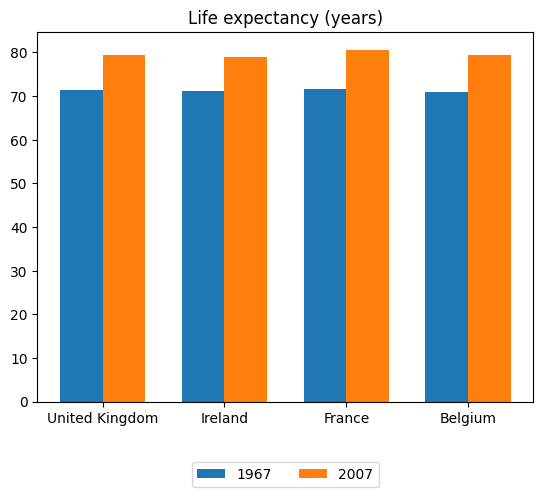
Example: A Matplotlib bar chart with afcharts (left) and without (right)
Plotly
from afcharts.pio_template import pio

# Apply the afcharts style to all Plotly plots
pio.templates.default = "afcharts"
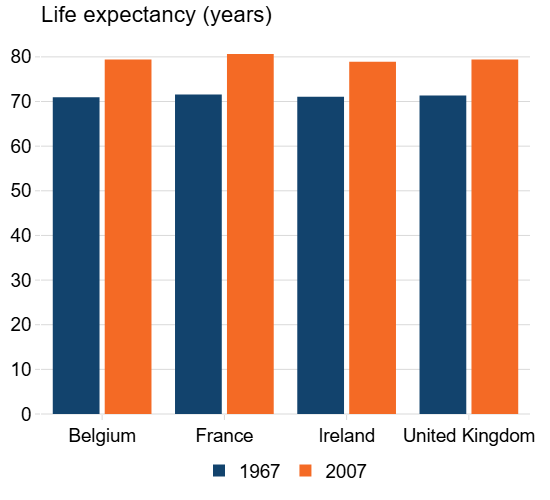
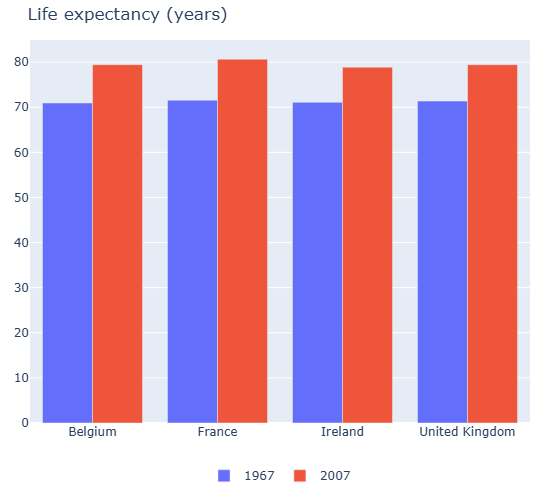
Example: A Plotly bar chart with afcharts (left) and without (right)
Colours
Easily return a list of colours from any of the Analysis Function accessible colour palettes with the get_af_colours() function:
from afcharts.af_colours import get_af_colours

# Get the duo colour palette hex codes
duo = get_af_colours("duo")
Getting help
If you encounter a bug, please file a minimal reproducible example on Github Issues. For questions and other discussion, please start a discussion.
Contributing
Interested in contributing? Check out the contributing guidelines.
Acknowledgments
The afcharts python package is based on the afcharts R package and the py-af-colours package.
License
Unless stated otherwise, the codebase is released under the MIT License. This covers both the codebase and any sample code in the documentation.
The documentation is © Crown copyright and available under the terms of the Open Government 3.0 licence.
Project details
Verified details
These details have been verified by PyPIProject links
GitHub Statistics
Maintainers
Release history Release notifications | RSS feed


Download files
Download the file for your platform. If you're not sure which to choose, learn more about installing packages.
Source Distribution
Built Distribution
Filter files by name, interpreter, ABI, and platform.
If you're not sure about the file name format, learn more about wheel file names.
Copy a direct link to the current filters
File details
Details for the file afcharts-1.0.0b0.tar.gz.
File metadata
- Download URL: afcharts-1.0.0b0.tar.gz
- Upload date:
- Size: 11.1 kB
- Tags: Source
- Uploaded using Trusted Publishing? Yes
- Uploaded via: twine/6.1.0 CPython/3.13.7
File hashes
| Algorithm | Hash digest | |
|---|---|---|
| SHA256 |
f5007cd9d093266c87fcc2f2ede6747d146c40428defa9ea4304b845579513f7
|
|
| MD5 |
c8fb78be50b6ecb657f6e44bbb89cafa
|
|
| BLAKE2b-256 |
92e0e51586298828c18e654833fc013b3970c1b3523c4759a6d45fe9c9485141
|
Provenance
The following attestation bundles were made for afcharts-1.0.0b0.tar.gz:
Publisher:
publish.yml on best-practice-and-impact/afcharts-py
-
Statement:
-
Statement type:
https://in-toto.io/Statement/v1 -
Predicate type:
https://docs.pypi.org/attestations/publish/v1 -
Subject name:
afcharts-1.0.0b0.tar.gz -
Subject digest:
f5007cd9d093266c87fcc2f2ede6747d146c40428defa9ea4304b845579513f7 - Sigstore transparency entry: 870291518
- Sigstore integration time:
-
Permalink:
best-practice-and-impact/afcharts-py@ffdaacd72b5fccf445b985c252b20d3b8a8e0f21 -
Branch / Tag:
refs/tags/v1.0.0-beta - Owner: https://github.com/best-practice-and-impact
-
Access:
public
-
Token Issuer:
https://token.actions.githubusercontent.com -
Runner Environment:
github-hosted -
Publication workflow:
publish.yml@ffdaacd72b5fccf445b985c252b20d3b8a8e0f21 -
Trigger Event:
release
-
Statement type:
File details
Details for the file afcharts-1.0.0b0-py3-none-any.whl.
File metadata
- Download URL: afcharts-1.0.0b0-py3-none-any.whl
- Upload date:
- Size: 9.2 kB
- Tags: Python 3
- Uploaded using Trusted Publishing? Yes
- Uploaded via: twine/6.1.0 CPython/3.13.7
File hashes
| Algorithm | Hash digest | |
|---|---|---|
| SHA256 |
a1a83877a159e8f10e1779656322563a354fa32fc02d2f2aafb357048dd7b116
|
|
| MD5 |
659e3b3072800fa3fbffcc140356d837
|
|
| BLAKE2b-256 |
a41ed21190f7101d884e5b0607a0d6146bb6fb2e59d1d65df84a3327d28d655f
|
Provenance
The following attestation bundles were made for afcharts-1.0.0b0-py3-none-any.whl:
Publisher:
publish.yml on best-practice-and-impact/afcharts-py
-
Statement:
-
Statement type:
https://in-toto.io/Statement/v1 -
Predicate type:
https://docs.pypi.org/attestations/publish/v1 -
Subject name:
afcharts-1.0.0b0-py3-none-any.whl -
Subject digest:
a1a83877a159e8f10e1779656322563a354fa32fc02d2f2aafb357048dd7b116 - Sigstore transparency entry: 870291520
- Sigstore integration time:
-
Permalink:
best-practice-and-impact/afcharts-py@ffdaacd72b5fccf445b985c252b20d3b8a8e0f21 -
Branch / Tag:
refs/tags/v1.0.0-beta - Owner: https://github.com/best-practice-and-impact
-
Access:
public
-
Token Issuer:
https://token.actions.githubusercontent.com -
Runner Environment:
github-hosted -
Publication workflow:
publish.yml@ffdaacd72b5fccf445b985c252b20d3b8a8e0f21 -
Trigger Event:
release
-
Statement type:






