Turn Langfuse/LangSmith agent traces into human-readable Agent Activity Reports (Markdown + HTML).
Verified details
These details have been verified by PyPIProject links
GitHub Statistics
Maintainers

Project description

agent-panorama

Turn raw LLM agent traces into a human-readable Agent Activity Report that a non-engineer can actually read. Point it at a Langfuse (or LangSmith) trace export and get clean Markdown + a self-contained HTML report that explains, in business language, what your agents did, what they decided, and anything that looks off.
Two layers over the same conversations answer the two questions every manager asks:
- The summarization layer — "what happened?" Tool calls, retries, outcomes, tokens, and cost, phrased in plain English.
- The value layer — "was it worth it?" An LLM judge scores each conversation against your definition of value (your domain, your user goal, your success criteria) and reports the value delivered, the value lost, and what to fix.
The fleet view — one plain-English activity feed across every agent, with per-run details, outcomes, and cost.
Why
Traces are great for engineers and terrible for everyone else. agent-panorama
translates tool calls, retries, token usage, and errors into plain English. It
also pulls the real user request and final answer out of LangGraph/LangChain
messages payloads, so the report reads like a story, not a JSON dump:
get_weather({"city": "Paris"})→ "Looked up the weather"- 3 failed model calls → "High retry count: 3 failed attempts before completing."
human_handoff(...)→ run outcome human-escalated
Tokens are the primary metric. USD cost is opt-in (since v0.2): supply a
model_prices table in your config and the report adds dollar estimates
alongside tokens (no prices ⇒ cost stays hidden).
Install
pip install agent-panorama
# or, for local development:
uv pip install -e ".[dev]"
Requires Python 3.10+. Dependencies are intentionally minimal: click,
jinja2, pyyaml, python-dotenv.
CLI usage
agent-panorama generate --input traces.json --output ./report --format html
Options:
| Option | Description |
|---|---|
--input |
Path, glob, or directory of JSON exports. Repeatable; globs/dirs are expanded (required). |
--output |
Output directory (default ./report). |
--format |
md, html, json, or both (= md+html; default both). |
--input-type |
langfuse or langsmith (default langfuse). |
--config |
Optional YAML config (tool naming, thresholds, model_prices). |
--detail |
Step narrative detail: minimal, standard (default), or richer. |
--session |
Keep only runs matching this session id. |
--since / --until |
Keep only runs whose start time is within this ISO date/datetime window (UTC). |
--summarize |
Phrase each minimal result via a cheap LLM (opt-in, off by default). See below. |
--summarize-model |
LLM id for --summarize (default google_genai:gemini-2.5-flash-lite). |
Try it on the bundled example, or aggregate a whole fleet:
agent-panorama generate --input examples/langfuse_traces.json --output ./report

# many traces → one fleet report + a feed.json for the dashboard
agent-panorama generate --input 'traces/*.json' --input more/ \
  --since 2026-05-01 --until 2026-05-31 --format json --output ./report
Fleet view (v0.2)
Multiple --input flags, glob patterns, and directories are all expanded and
aggregated into one report. The report then carries a cross-agent activity
feed and per-agent rollups (runs, actions, success/escalation/retry rates,
tokens, and cost when model_prices is set). --format json writes a
report.json with a stable contract (generated_at, time_range, totals,
feed, rollups, decision_log) consumed by the frontend dashboard.
USD cost (opt-in)
Add a model_prices table to your config to get dollar estimates next to tokens
(prices are USD per 1M tokens; keys match model names by substring, longest
match wins):
model_prices:
  gpt-4o-mini: { input: 0.15, output: 0.60 }
  gpt-4o:      { input: 2.50, output: 10.00 }
  claude-3-5-sonnet: { input: 3.00, output: 15.00 }
With no model_prices block, cost is omitted entirely and tokens remain the
only metric.
The report.json contract
--format json writes a report.json with a stable shape (also the input the
dashboard consumes). Every timestamp is ISO-8601 UTC or
null; every *cost_usd is a number or null (null when no model_prices
matched). outcome is one of success, human-escalated, failure, unknown.
{
  "generated_at": "2026-05-31T09:42:00+00:00",
  "time_range": { "start": "…", "end": "…" },
  "totals":     { "runs": 4, "steps": 7, "tokens": 3990, "cost_usd": 0.0134,
                  "value": null },           // value summary when the value layer is on
  "feed": [                                  // one entry per run, newest first
    {
      "run_id": "…", "agent_name": "research-assistant",
      "agent_key": "research-assistant",     // slug, for stable UI grouping/colour
      "action": "Searched the web and summarized 3 papers.",
      "outcome": "success", "timestamp": "…",
      "retry_count": 0, "anomaly_count": 0,
      "tokens": 1234, "cost_usd": 0.006,
      "summary": "…", "facts": [["Steps", "5"], ["Retries", "0"]],
      "anomalies": [],
      "value": null                          // ValueJudgment when judged (see value layer)
    }
  ],
  "rollups": [                               // one per agent
    {
      "agent_name": "research-assistant", "agent_key": "research-assistant",
      "runs": 1, "actions": 5,
      "success_rate": 1.0, "escalation_rate": 0.0,
      "failure_rate": 0.0, "retry_rate": 0.0,
      "total_tokens": 1234, "total_cost_usd": 0.006,
      "judged": 0, "avg_value_score": null,  // value layer metrics (null when off)
      "valuable_rate": null, "cost_per_valuable_usd": null
    }
  ],
  "decision_log": [                          // consequential actions across agents
    { "timestamp": "…", "agent_name": "…", "action": "…",
      "parameters": "…", "outcome": "succeeded" }
  ]
}
Library usage
from agent_panorama import generate_report

report = generate_report(
    "traces.json",
    output_dir="./report",
    formats=["md", "html"],
    input_type="langfuse",
    config="config.yaml",  # optional
)

print(report.total_runs, report.total_tokens)
generate_report returns the in-memory Report, so you can also inspect runs,
the decision log, and anomalies programmatically without touching disk (use
build_report_from_file if you want the report without writing files).
Fleet API (v0.2)
generate_report (and the lower-level build_report_from_inputs) accept a glob,
a directory, or a list of paths via inputs=, plus session / since / until
filters. The returned Report exposes the cross-agent feed and per-agent
rollups; serialize_report gives you the report.json dict directly.
from agent_panorama import (
    generate_report, build_report_from_inputs, load_runs,
    load_config, serialize_report,
)

report = generate_report(
    inputs=["traces/*.json", "more/"],   # globs, dirs, or a single path
    formats=["json"],                    # writes report.json
    since="2026-05-01", until="2026-05-31",
    config="config.yaml",                # model_prices here ⇒ cost is populated
)

for item in report.feed:                 # newest-first activity feed
    print(item.agent_name, item.action, item.outcome.value, item.tokens, item.cost_usd)

for r in report.rollups:                 # per-agent success/escalation/retry rates
    print(r.agent_name, r.runs, r.success_rate, r.escalation_rate, r.retry_rate)

# No files? Build in memory and serialize the JSON contract yourself:
runs = load_runs("traces/*.json", session="abc123")
mem = build_report_from_inputs("traces/*.json", "langfuse", load_config("config.yaml"))
payload = serialize_report(mem, load_config("config.yaml"))  # -> dict
What's in a report
- Summary — time range, total runs, total steps, total tokens (and total cost
when
model_pricesis set). - Fleet activity feed (v0.2) — one scannable, newest-first line per run across every agent: who did what, in plain English, with outcome and timing.
- Per-agent rollups (v0.2) — one row per agent: runs, actions, and success / escalation / retry rates, plus tokens and cost.
- Per-agent section — what it was asked to do, what it did step by step (graph
nodes / tool calls in plain English, at the chosen
--detaillevel), final outcome, and a confidence signal (retries / fallback). - Decision log — a sortable table of every consequential action: timestamp, agent, action, parameters summarized in plain English, outcome.
- Anomalies — high retry counts, slow runs, high activity, errors, fallbacks.
Configuration
All configuration is optional. See config.example.yaml
for the full set. Highlights:
tool_descriptions:
  get_weather: "Looked up the weather"

consequential_tools: [send_email, human_handoff]
escalation_tools: [human_handoff, handoff_to_agent]

anomaly_thresholds:
  max_retries: 2
  max_latency_seconds: 30
  max_tool_calls: 15
Plain-language result summaries (optional LLM)
By default the report uses no LLM — it just reformats trace data. But in
--detail minimal, a long final answer (e.g. a big Markdown table) is condensed
with a simple heuristic, which keeps the agent's own wording ("Here are all the
cutting stations in the plant"). If you'd rather get a crisp past-tense action
line ("Showed all the cutting stations in the plant."), enable the opt-in
--summarize flag, which rewrites just the result via a cheap model.
It is intentionally tiny: a ~40-token fixed system prompt, at most ~250 input tokens (the result is hard-capped at 1,000 characters), and a ~25-token reply — roughly 300 tokens total per run. On a free-tier model this costs nothing; on the cheapest paid model it's a fraction of a cent.
Setup
-
Install a provider extra (pick the one matching your model):
pip install "agent-panorama[gemini]"     # Google Gemini (recommended, free tier)
pip install "agent-panorama[openai]"     # OpenAI
pip install "agent-panorama[anthropic]"  # Anthropic
-
Get your own API key from the provider and either
exportit or put it in a.envfile in the working directory (auto-loaded; real env vars win):export GOOGLE_API_KEY=... # Gemini # or OPENAI_API_KEY / ANTHROPIC_API_KEY # …or a .env file: GOOGLE_API_KEY=...
-
Run with
--summarize:agent-panorama generate --input traces.json --output ./report \ --detail minimal --summarize # pick a different model: agent-panorama generate --input traces.json --output ./report \ --detail minimal --summarize --summarize-model openai:gpt-5-nano
If the provider package or key is missing, summarization is skipped gracefully (you just get the heuristic line) — it never breaks report generation.
Every call is logged to <output>/llm_calls.log — the exact system prompt,
the input sent (with its character count), and the output (or error) for each
run — so you can audit precisely what went to the model.
Recommended models (cheapest first)
For this tiny one-shot call any of these is more than capable, so free-tier access and price dominate. Only Gemini Flash / Flash-Lite have a genuine no-credit-card free tier; OpenAI/Anthropic require a positive balance.
Model (--summarize-model) |
Price /1M (in → out) | Free tier | Provider extra | API key env var |
|---|---|---|---|---|
google_genai:gemini-2.5-flash-lite (default) |
$0.10 → $0.40 | ✅ free, no card (~1,500 req/day) | gemini |
GOOGLE_API_KEY |
google_genai:gemini-2.5-flash |
$0.30 → $2.50 | ✅ free tier (lower quota) | gemini |
GOOGLE_API_KEY |
openai:gpt-5-nano |
$0.05 → $0.40 | ⚠️ no free tier (prepaid) | openai |
OPENAI_API_KEY |
openai:gpt-4.1-nano |
$0.10 → $0.40 | ⚠️ no free tier | openai |
OPENAI_API_KEY |
openai:gpt-4o-mini |
$0.15 → $0.60 | ⚠️ no free tier | openai |
OPENAI_API_KEY |
anthropic:claude-haiku-4-5 |
$1.00 → $5.00 | ⚠️ trial credits only | anthropic |
ANTHROPIC_API_KEY |
Pick google_genai:gemini-2.5-flash-lite (the default) to run this for free.
gpt-5-nano has the lowest paid input price if you already use OpenAI.
Prices verified May 2026 against providers' official pricing pages; check them for current rates.
Supported inputs
- Langfuse trace exports — a single trace dict, the single-trace
{"trace": {...}, "observations": [...]}shape, a list of traces, or the{"data": [...]}list-API shape. Tool calls are read fromTOOLobservations (falling back to tool spans), and fromtoolCalls/ OpenAI-styletool_callsdeclared on generations. - LangSmith run exports — a flat list (or
{"runs": [...]}) of run nodes; each root run is flattened into one agent run.
Token usage is read from the trace (inputUsage/outputUsage or
usage/usage_metadata). Dollar cost is opt-in via a model_prices config
table (see USD cost).
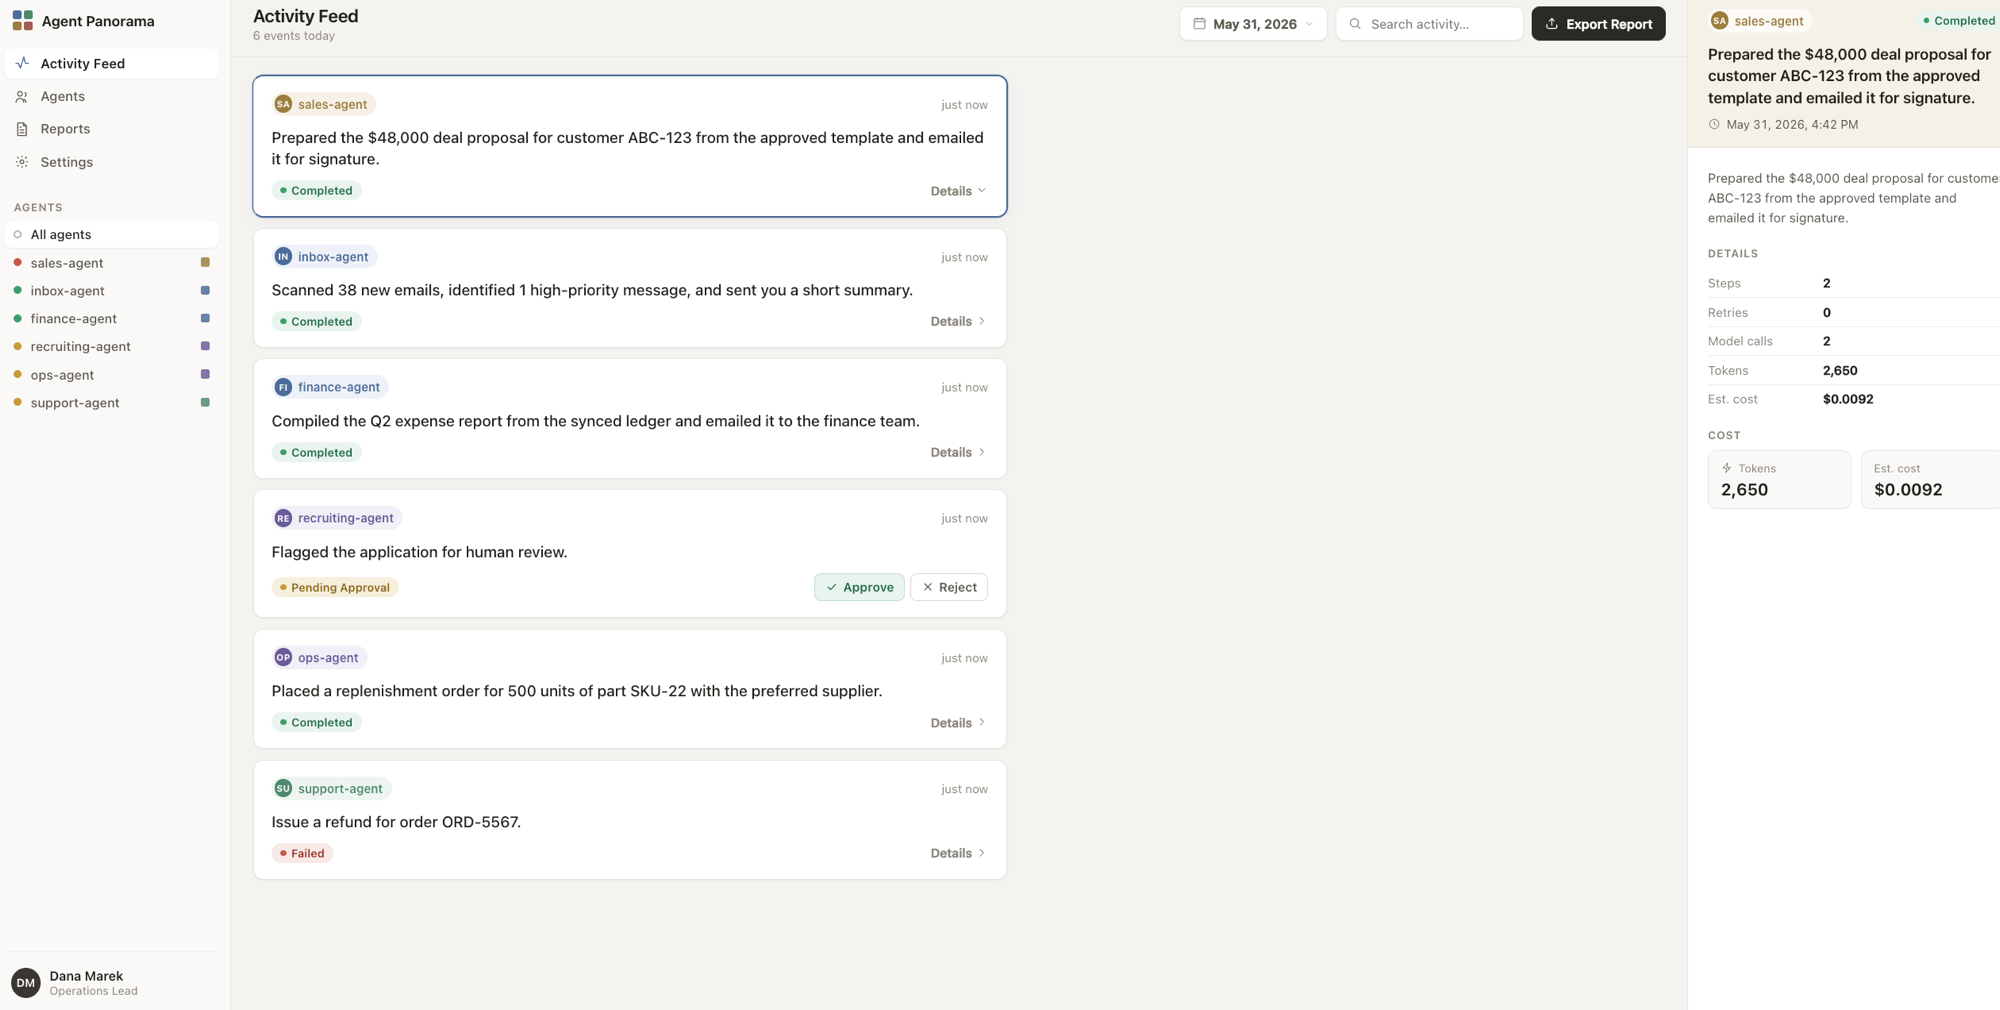
Frontend dashboard
A manager-facing Agent Panorama dashboard lives in frontend/
(Vite + React + TypeScript, outside the Python package). It renders the
report.json produced by --format json, falling back to bundled demo data
when no JSON is present.
See frontend/README.md for setup; in short:
agent-panorama generate --input 'traces/*.json' --format json --output ./report
cp report/report.json frontend/public/feed.json
cd frontend && npm install && npm run dev
Live mode (v0.3) — continuous oversight
Watch your agents live instead of from after-the-fact exports. One line in any LangChain / LangGraph app streams every completed run to a local dashboard:
from agent_panorama.live import PanoramaCallbackHandler

agent.invoke(inputs, config={"callbacks": [PanoramaCallbackHandler()]})
Then run the dashboard server (one-time install of the live extra):
pip install 'agent-panorama[live]'
agent-panorama serve --open        # dashboard at http://localhost:8321
Each run appears in the activity feed within seconds of finishing — outcome,
tool calls, tokens, anomalies, and per-agent rollups all update live (the
dashboard polls /api/report every 3 s).
Designed to be safe in the instrumented app:
- The handler ships with the base package and posts runs over the standard library — your agent app never needs the server dependencies.
- Delivery never raises and never blocks beyond a 2 s timeout: if the dashboard is down, the app logs one warning and keeps working.
- The server keeps runs in memory (
--max-runscaps retention) and applies the same analysis as batch reports, so outcomes/anomalies matchgenerate.
Useful flags: --port, --host, --config your.yaml (same YAML as
generate — tool descriptions, escalation tools, model prices), --max-runs.
Point the handler elsewhere with PanoramaCallbackHandler(endpoint=...) or the
AGENT_PANORAMA_ENDPOINT env var.
Sessions: many turns, one feed entry
A chat agent answering 4 questions is still doing one thing for one user —
so the feed aggregates by (session, actor). Pass them in the invoke config
(LangGraph's thread_id works automatically):
agent.invoke(inputs, config={
    "callbacks": [PanoramaCallbackHandler()],
    "metadata": {"session_id": "lesson-42", "user_id": "student-7"},
})
All turns of that pair collapse into a single feed entry with an
Interactions: 4 · 3 ok · 1 failed breakdown, the worst turn's outcome as the
status, and summed tokens/cost. An LLM layer then phrases the whole session in
one line — e.g. "Helped the student understand moon phases." — using the
same cheap model as --summarize (install a provider extra such as
agent-panorama[gemini] and set its API key; without one, a deterministic
summary line is shown instead). Override the model with
serve --summarize-model .... Batch reports (generate) aggregate the same
way — Langfuse's native sessionId/userId are picked up automatically.
Runs without a session id stay one-entry-per-run.
Try it without LangChain: start agent-panorama serve --open, then run
python examples/live_demo.py to stream three synthetic runs into the
dashboard. More demos live in examples/, organized by
complexity (one_step/, two_step/, multi_step/) — including a real
LangChain example in examples/one_step/langchain_agent.py.
The value layer (v0.4) — was it worth it?
The activity feed tells you what your agents did. The value layer tells you
whether it mattered — judged against your definition of value, not a
generic rubric. An LLM judge reads each conversation (batch exports and live
mode alike) and produces a ValueJudgment: scores 0–10, the outcome in your
domain language, the concrete moments value was delivered or lost, actionable
fixes, and a pass/fail verdict per success criterion.
Enable it by adding a value: block to your YAML config (no new install — it
uses the same provider extra and API key as --summarize):
value:
  judge_model: google_genai:gemini-2.5-flash   # default; any init_chat_model id
  max_judgments: 50            # hard cap per report — the cost guard
  include_single_runs: true    # false = judge only multi-turn sessions
  default:                     # your definition of value (the generic fallback)
    domain: customer support
    user_goal: resolve the user's issue without human escalation
    success_criteria:
      - issue resolved in the conversation
    custom_dimensions:
      self_service: Did the user finish without needing a human?
  contexts:                    # per-agent overrides, keyed by agent_key
    study-tutor:
      domain: education
      user_goal: the student understands the concept
A fleet rarely has one goal, so contexts are per agent: each agent's entry
merges field-wise over default. With model_prices also configured, every
agent gets the number managers actually want — cost per valuable
conversation (total spend ÷ conversations scoring ≥ 6).
In the dashboard this appears as a second Value view (it shows up in the sidebar only when something was judged): fleet averages, a per-agent value table, and conversations sorted lowest-value first — because the manager's job is finding lost value. Judged feed cards carry a score pill, and the detail panel shows the full verdict.
Cost notes: each judgment is one capped LLM call (transcript hard-capped at
~8k chars); max_judgments bounds batch reports, and live mode caches one
judgment per conversation, re-judging only when a new turn arrives. Every call
is audited to llm_calls.log. Without a provider/key, judging degrades
silently — the report still generates, just unjudged.
Roadmap
agent-panorama starts as a report generator and is growing into an oversight
layer for fleets of agents — a single pane of glass for everything your agents
did, decided, and got wrong. More than logs, across more than one agent.
✅ v0.1 — Read one run clearly (today)
- Langfuse + LangSmith trace ingestion
- Plain-language per-agent summaries, decision log, anomalies
- Markdown + self-contained HTML output; CLI and library API
✅ v0.2 — See the whole fleet (the panorama view)
-
A unified cross-agent activity feed — one scannable timeline of what every agent did, in plain English:
Agent Activity — May 28, 14:30–15:00

research-assistant    → searched the web, summarized 3 papers            ✓ success
scheduling-assistant  → checked the calendar, handed the task to a human ⤴ escalated
weather-assistant     → looked up the weather (retried once), emailed it ✓ success
billing-agent         → issued 2 refunds, flagged 1 for review           ⚠ anomaly
-
Aggregate many traces into one report (by session, time window, or file glob)
-
Per-agent rollups: runs, actions, success / escalation / retry rates
-
Cross-agent decision log spanning every agent in the window
✅ v0.3 — Continuous oversight: the live dashboard
- One-line LangChain/LangGraph integration (
PanoramaCallbackHandler) agent-panorama serve— a local server with the dashboard bundled in- Runs stream in as they finish; feed, rollups, and totals update live
✅ v0.4 — The value layer: was it worth it?
- LLM-as-judge scores every conversation against your value definition (domain, user goal, success criteria, custom dimensions — per agent)
- Value delivered / value lost / recommended fixes, cited from the transcript
- A second dashboard view: avg value score, valuable rate, and cost per valuable conversation
📈 v0.5 — Trends & regressions
- Track rates over time, not just a point-in-time snapshot
- Flag regressions (escalations or retries spiking vs. a baseline)
- Period-over-period comparison ("this week vs. last")
🔌 v0.6 — More sources & deeper detail
- OpenTelemetry / OpenInference and raw OpenAI-style logs
- Optionally fetch full input/output from the Langfuse API to enrich decision-log parameters
- Pluggable parser interface for custom trace formats
🎯 The vision — Full continuous oversight
- In-flight runs on the live dashboard (watch a run while it's still working)
- Scheduled/continuous reports instead of one-off runs
- Accountability views a non-engineer can sign off on (what happened, what needs a human)
- Alerting on anomalies across the fleet
Have a use case or a trace format you want supported? Open an issue.
Development
uv pip install -e ".[dev]"
python tests/run_all_tests.py     # run the full suite
ruff check . && ruff format --check .
Contributing
Contributions are very welcome — and kept deliberately easy. No CLA, no strict process, no style police. If you use agents and want better reports, jump in.
Good first things to do:
- Add a parser for a trace format you use (see the registry in
parsers/__init__.py— writeparse(payload) -> list[AgentRun]and register it; nothing downstream changes). - Improve a plain-language summary, fix a parsing edge case, or polish the report.
- Open an issue with a (scrubbed) trace that doesn't render well — that alone helps a lot.
The whole flow:
- Fork & branch.
- Make your change. Run
ruff check . && ruff format .andpython tests/run_all_tests.py(a green suite is all that's expected — add a test if it makes sense, but don't sweat it). - Open a PR. Rough is fine — we'll iterate together.
Questions, ideas, half-finished patches: all welcome. Star the repo, open an issue, or just say hi. 🙌
License
MIT — see LICENSE.
Project details
Verified details
These details have been verified by PyPIProject links
GitHub Statistics
Maintainers
Release history Release notifications | RSS feed


Download files
Download the file for your platform. If you're not sure which to choose, learn more about installing packages.
Source Distribution
Built Distribution
Filter files by name, interpreter, ABI, and platform.
If you're not sure about the file name format, learn more about wheel file names.
Copy a direct link to the current filters
File details
Details for the file agent_panorama-0.4.0.tar.gz.
File metadata
- Download URL: agent_panorama-0.4.0.tar.gz
- Upload date:
- Size: 14.4 MB
- Tags: Source
- Uploaded using Trusted Publishing? Yes
- Uploaded via: uv/0.11.19 {"installer":{"name":"uv","version":"0.11.19","subcommand":["publish"]},"python":null,"implementation":{"name":null,"version":null},"distro":{"name":"Ubuntu","version":"24.04","id":"noble","libc":null},"system":{"name":null,"release":null},"cpu":null,"openssl_version":null,"setuptools_version":null,"rustc_version":null,"ci":true}
File hashes
| Algorithm | Hash digest | |
|---|---|---|
| SHA256 |
2b8fecc5769652247097b4eaeb3acd343012477416bd3456cae31b9eb008bcc9
|
|
| MD5 |
4619430cbe66ef53b5101c90558873da
|
|
| BLAKE2b-256 |
45ef4045716a74f1206d972cc1e0ff74c2fb1063af4be1525950be652e6a5cf6
|
File details
Details for the file agent_panorama-0.4.0-py3-none-any.whl.
File metadata
- Download URL: agent_panorama-0.4.0-py3-none-any.whl
- Upload date:
- Size: 132.9 kB
- Tags: Python 3
- Uploaded using Trusted Publishing? Yes
- Uploaded via: uv/0.11.19 {"installer":{"name":"uv","version":"0.11.19","subcommand":["publish"]},"python":null,"implementation":{"name":null,"version":null},"distro":{"name":"Ubuntu","version":"24.04","id":"noble","libc":null},"system":{"name":null,"release":null},"cpu":null,"openssl_version":null,"setuptools_version":null,"rustc_version":null,"ci":true}
File hashes
| Algorithm | Hash digest | |
|---|---|---|
| SHA256 |
143b4fcafb0cd566d85b12073e523bb04fe4ddac2f797ab6b3c1e64660a65953
|
|
| MD5 |
0b2ca1daec8621d4616b7dfa3a094d95
|
|
| BLAKE2b-256 |
5f719e1e8c752a5aef463f40d96b2b48872401e260c4f7ee8dbf41f108df380b
|


