
TrajViz
Parse and analyze LLM agent trajectories: as a Python library, as JSON, or in a dashboard.
agent-trajviz reads the trajectories coding agents record, normalizes them
into one step model, and computes tokens, timing, tool use, health checks,
failure and anti-pattern detections, step labels and run-to-run comparisons.
Every chart and table is a view: plain JSON data with a published schema,
which your own code, the optional Plotly figures and HTML report, and the
Gradio dashboards all draw from. The core needs only the standard library.
Supports trajectories from Claude Code, Cursor, OpenCode, CodeArts, ICode, Codex CLI, Pi, and DeepSeek Harness out of the box, and formats of your own through a plugin hook.
import agent_trajviz as tv

run = tv.load("trajectory.json")            # the format is detected from the content
print(run.format_label, run.metrics["tokens"]["total"])
print(run.view("tool_usage").data)          # any chart or table, as JSON data
tv.export_json(run, "out/")                 # every view, plus trajectory.json to reload
Architecture
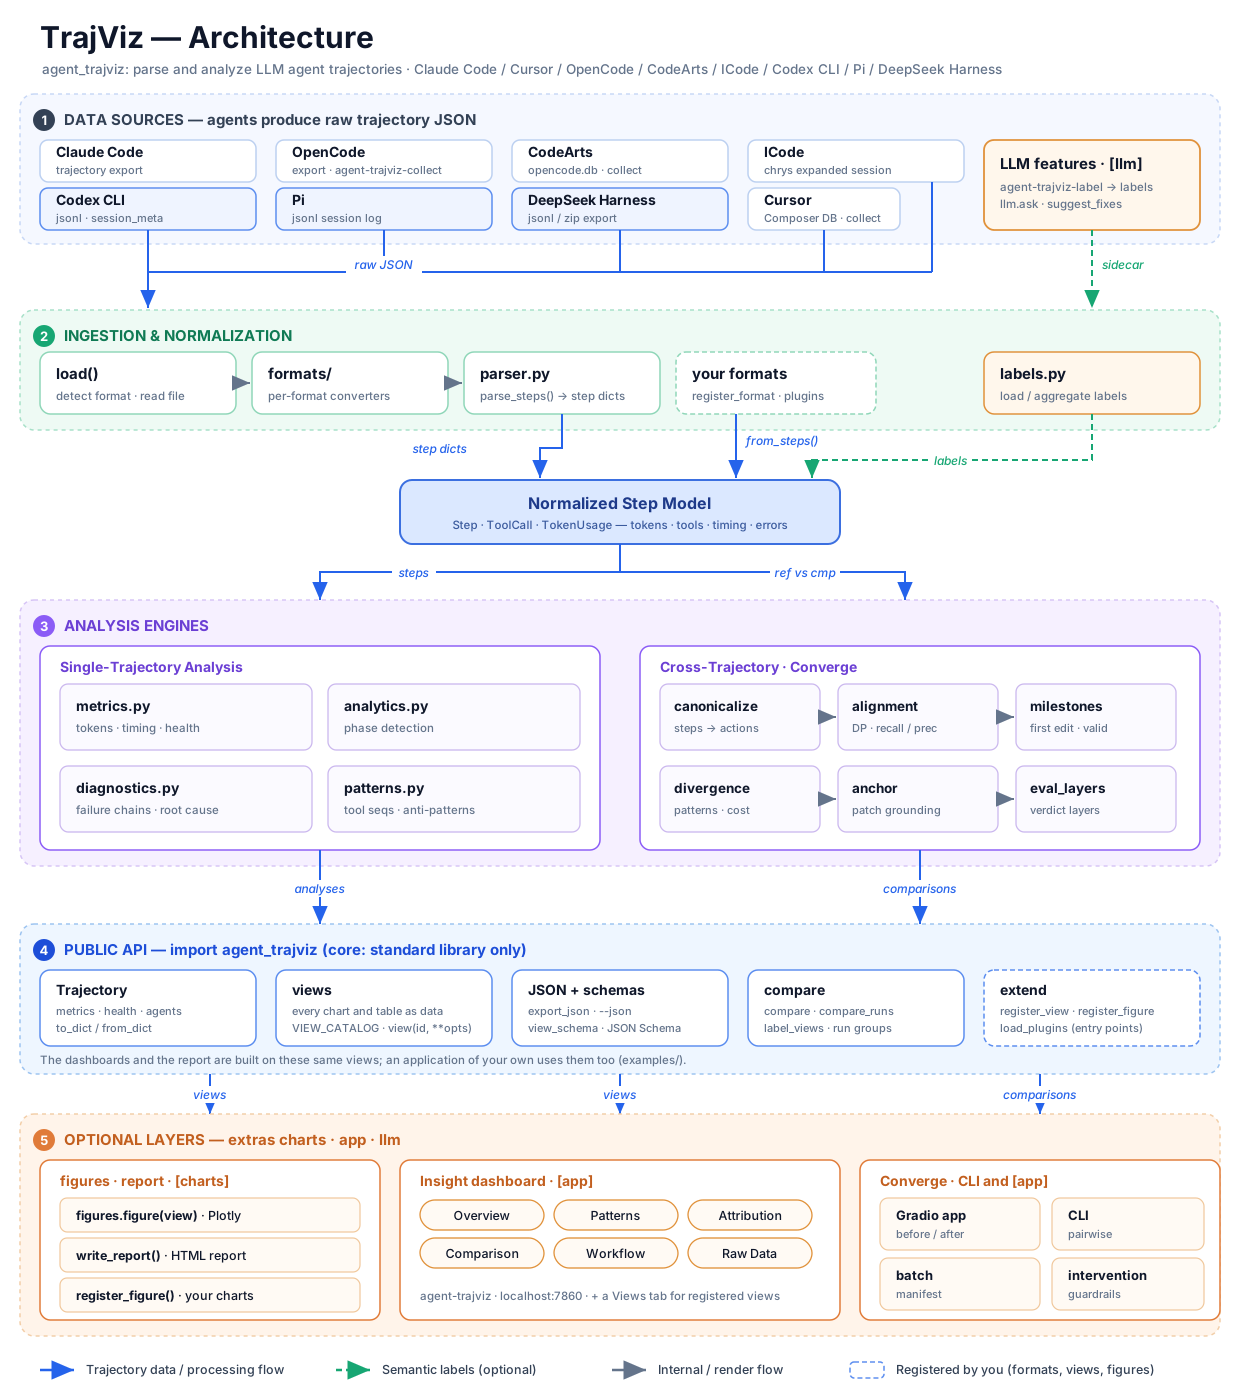
TrajViz ingests raw agent-trajectory JSON, normalizes it into a shared step model, runs single- and cross-trajectory analysis over that model, and exposes the results through its public API as views. The optional layers (figures, the HTML report, the dashboards) are built on the same views.
Install
Requires Python 3.11+.
pip install "agent-trajviz[app]"     # dashboards, HTML report, LLM features
pip install agent-trajviz            # library + collection tools: no third-party dependencies
| Extra | Adds | Enables |
|---|---|---|
charts |
plotly, pygments | figures and the static HTML report (agent-trajviz --report) |
llm |
requests | the AI analysis sidebar, the Issues judge, agent-trajviz-label |
app |
gradio + charts + llm |
the Insight and Converge dashboards |
all |
everything above |
A command whose extra is missing says which one to install instead of failing with a traceback.
From a checkout
git clone https://github.com/rshu/TrajViz.git
cd TrajViz
uv sync --extra app          # or: pip install -e ".[app]"
uv sync --extra dev          # contributors: everything plus the test and lint tools
Run
Launch the dashboard:
# uv
uv run agent-trajviz
# or
uv run python -m agent_trajviz.insight

# pip / activated venv
python -m agent_trajviz.insight
# or
agent-trajviz
Default: http://localhost:7860. Upload a trajectory JSON via the file picker at the top of the UI. After load, Export HTML downloads a standalone Overview + charts + Patterns snapshot (charts stay interactive via Plotly's CDN).
Headless report, no dashboard:
python -m agent_trajviz.insight --report path/to/trajectory.json -o report.html
# fully offline: embed plotly.js instead of loading it from the CDN (adds several MB)
python -m agent_trajviz.insight --report path/to/trajectory.json -o report.html --inline-plotly
With -o pointing at a directory, the file name comes from the trajectory's
name; a report built from a different trajectory that happens to share that
name is never overwritten (a numbered sibling is written instead).
The AI Trajectory Analysis sidebar starts closed; open it from the
labeled control on the right edge. It runs an automatic analysis
when a trajectory loads, then answers follow-up questions. It uses the same
dashboard statistics (health verdicts, bottlenecks, failures, fruitless
streaks) and replies in English by default (set ANALYZE_LANGUAGE, e.g.
Simplified Chinese or German, to change it — the Issues fix judge follows the same setting). It does not
re-upload the raw file. Configure the model in .env:
cp .env.example .env
# set ANALYZE_BASE_URL / ANALYZE_API_KEY / ANALYZE_MODEL
# (LABEL_* from the step labeler is used if ANALYZE_* is omitted)
| Variable | Meaning |
|---|---|
ANALYZE_BASE_URL |
API base URL (OpenAI-compatible, or Anthropic messages) |
ANALYZE_API_KEY |
API key |
ANALYZE_MODEL |
Model name, e.g. gpt-4o-mini, glm-4.6 |
Optional: ANALYZE_PROVIDER (openai | anthropic, default openai),
ANALYZE_TEMPERATURE (default 0.2), ANALYZE_MAX_TOKENS (default 2048),
ANALYZE_TIMEOUT (default 120), ANALYZE_LANGUAGE (default English).
.env is gitignored, and only ANALYZE_* / LABEL_* keys are read from it.
Custom port or host (prefix any of these with uv run when using uv):
# Different port
agent-trajviz --port 8080

# Access from other machines on the network, behind a login
TRAJVIZ_AUTH=alice:change-me agent-trajviz --host 0.0.0.0
# Then open http://YOUR_IP:7860

# Create a public share link, behind a login
TRAJVIZ_AUTH=alice:change-me agent-trajviz --share

# Accept uploads larger than the default 500 MB
agent-trajviz --max-file-size 2gb
The dashboard binds to 127.0.0.1 by default. Anyone who can reach an
exposed one (--host 0.0.0.0, --share) can upload files and use the LLM
key configured on your machine, so set TRAJVIZ_AUTH=user:password before
exposing it; TrajViz warns at startup when you do not. The login is read
from the environment so it never appears in your shell history or the
process list. An exposed dashboard also hides the inputs that name paths on
your machine (the Attribution tab's reference-data root).
Converge dashboard
The trajectory-comparison dashboard takes the same server options and listens on port 7861 by default, so it can run beside Insight:
python -m agent_trajviz.converge --data-root path/to/trajectories
Paths inside an uploaded batch manifest resolve against --data-root
(default: the current directory), and a manifest naming a file outside it is
refused.
Use it as a library
The library parses trajectories and analyzes them; everything it computes is
plain data. The core needs no third-party packages (pip install agent-trajviz):
import agent_trajviz as tv

run = tv.load("trajectory.json")            # any supported format, detected from the content
run = tv.load("trajectory.json", format="codex")   # or required (LoadError "mismatch" otherwise)
print(run.format_label, len(run.steps))      # e.g. "Codex CLI", 66
print(run.metrics["tokens"]["total"], run.metrics["tool_success_rate"])

# Every chart and table the dashboard shows is a view: id, title, kind, description, JSON data.
for view_id, info in tv.VIEW_CATALOG.items():  # 35 views: summary, health, issues, agents,
    print(view_id, info["kind"], info["title"])  # token_usage, tool_usage, workflow, ...
tools = run.view("tool_usage").data           # calls per tool, split by agent
agent = run.view("context_pressure").data["agents"][-1]["key"]
ctx = run.view("context_pressure", agent=agent, window_limit=200_000)  # views can take options
tv.export_json(run, "out/")                   # <id>.json per view + index.json + trajectory.json
again = tv.load("out/trajectory.json")        # an export reloads to the same views
data = run.to_dict(include_raw=True)          # or keep it yourself: tv.Trajectory.from_dict(data)

report = tv.compare(run, "other_run.json", anchor_patch="gold.patch")  # two runs of a task
tv.export_json(tv.comparison_views(report), "out/compare/")
group = tv.compare_runs(["a.json", "b.json", "c.json"])   # N runs: scorecard, behaviour, timelines
labels = tv.label_views("trajectory_labeled.json")       # step labels from agent-trajviz-label
Every view's data has a JSON Schema (draft 2020-12) in the package:
tv.view_schema("tool_usage") returns one, tv.view_schemas() all of them, and
agent-trajviz --schemas DIR writes them out for consumers in other languages.
A view written by export_json() validates against its schema with any JSON
Schema validator.
tv.load raises tv.LoadError (with .code and .path) for a file it cannot
read; every error the package raises on purpose is a tv.TrajVizError. Steps
are plain dicts described by the tv.Step, tv.ToolCall and tv.TokenUsage
typed records, and the package ships type information (py.typed). From the
shell, agent-trajviz --json trajectory.json -o out/ writes every view
(--list-views prints the catalog, --view ID picks some).
Optional layers build on the views:
| Module | Extra | What it adds |
|---|---|---|
agent_trajviz.figures |
charts |
figure(view): the dashboard's Plotly figure for any chart view |
agent_trajviz.dashboard |
app |
the Insight and Converge dashboards (launch_insight(), insight_app()), and view_component(view) for your own Gradio app |
agent_trajviz.llm |
llm |
ask(run, question) and suggest_fixes(run): the AI analysis, on the endpoint you configure, redacted |
agent_trajviz.attribution |
— | diagnose(run): DECAF failure attribution when a DECAF checkout is available |
examples/ has the dashboard rebuilt on this API alone and a
small app of your own; both are tested end to end.
Extending. For an agent TrajViz does not read, parse the file yourself
and hand over the steps: only role is required, and whatever a step lacks
is filled the way it is for a format that does not record it, so every view
works. Register the parser and tv.load() and the agent-trajviz command read
such files directly. Views and figures of your own join the catalog the same
way, so views(), export_json(), --json and the dashboards include them:
run = tv.Trajectory.from_steps([
    {"role": "user", "text_preview": "Fix the failing test"},
    {"role": "assistant", "tokens": {"input": 1200, "output": 80},
     "tool_calls": [{"tool_name": "bash", "input": {"command": "pytest"}, "error": "exit 1"}]},
], format="myagent")

tv.register_format(tv.Format(
    key="myagent", label="My Agent",
    detect=lambda doc: isinstance(doc, dict) and "myagent_version" in doc,  # the parsed JSON (JSONL: records)
    parse=lambda doc: [{"role": t["role"], "text_preview": t["text"]} for t in doc["turns"]],
))
tv.register_view("call_count", lambda run: {"calls": sum(len(s["tool_calls"]) for s in run.steps)},
                 title="Tool calls", kind="summary")
# charts extra: agent_trajviz.figures.register_figure("my_chart", lambda data, dark: go.Figure(...))
A package registers them for everyone who installs it with an entry point
in the agent_trajviz.plugins group that names a function taking no
arguments; tv.load_plugins() runs those hooks, and agent-trajviz runs
them on start. The dashboard reads files with tv.load() and draws from the
same views, so a registered format opens there too, and registered views
appear in a Views tab.
Scale. Analysis is linear in the number of steps and a test holds it so. A 15,000-step, 70 MB export loads in about 1.6 s and produces every view in about 3.6 s; the whole file is read into memory, so peak memory is about ten times its size (~0.7 GB there). The dashboard draws at most the first 2,000 steps of a run; the library analyzes all of them.
Only the names exported from agent_trajviz and the modules above are
public. The insight and converge subpackages are internal and may change
between minor versions.
Common Issues
Server cannot start
If the dashboard fails to start or shows connection errors, your environment may be using a proxy configuration that interferes with localhost connections. Add 127.0.0.1,localhost to the no_proxy environment variable:
# Linux/Mac
export no_proxy="127.0.0.1,localhost,$no_proxy"

# Windows (PowerShell)
$env:no_proxy = "127.0.0.1,localhost,$env:no_proxy"

# Windows (CMD)
set no_proxy=127.0.0.1,localhost;%no_proxy%
Port already in use
If port 7860 is already in use, specify a different port:
python -m agent_trajviz.insight --port 8080
Supported trajectory formats
TrajViz normalizes the following formats. Auto-detect is the default —
upload a .json / .jsonl / .zip file and load it. Pick a specific format only to
override detection or to load a Claude Code export that lacks the usual
format marker. An explicit pick is a requirement, not a hint: a file that is
detected as a different format is rejected with a "Format mismatch" message
(so leave the dropdown on Auto-detect unless detection fails):
| Format | Detection | Notes |
|---|---|---|
| Claude Code | format: ccsession-trajectory |
Full support: tokens, cache, tool calls, thinking (expected shape below). |
| Cursor | export_metadata.source_format: cursor_composer |
Consolidated from local agent-transcripts JSONL + Composer state.vscdb. Tool inputs always; tool outputs, step clocks (startedAtMs/completedAtMs), and context-window occupancy when the DB row is present. Per-step token bars are ≈4-chars/token estimates of logged text and tools — Cursor does not persist billed per-request tokens. |
| OpenCode | info + messages shape |
Includes sub-agent sessions |
| CodeArts | export_metadata.source_format: codearts_opencode_sqlite with schema version 2 |
Preserved token breakdown and consolidated parent/sub-agent sessions |
| ICode | _chrys_export.format: chrys-expanded-session-v1 (or meta + state.messages) |
Normalized from a Chrys expanded-session JSON; glob / grep / sh / explore_agent mapped into the shared step model. Nested _chrys_sub_agent_sessions are flattened. |
| Codex CLI | .jsonl rollout starting with a session_meta event |
Normalized into the shared step model (Auto-detect recognizes .jsonl uploads); tool intent (Read / Grep / Glob / Write / Bash) inferred from classic exec_command calls and modern exec / apply_patch records |
| Pi | .jsonl session starting with a session event |
Normalized from ~/.pi/agent/sessions/ exports; bash / read / write / edit / grep mapped into the shared step model |
| DeepSeek Harness | .jsonl session starting with a session header that has createdAt (epoch ms) and slash-typed body events (user/message, tool/call, …) |
Normalized from a DSH export folder or zip (session.jsonl + subagents/<id>/session.jsonl); bash / read / write / glob / todo_write / subagent_fork mapped into the shared step model. Child logs drop the inherited parent prefix (seedLength). |
Failure attribution (DECAF)
The Attribution tab explains why a failed run failed: it diagnoses which of seven workflow capabilities broke — Requirement Understanding, Task Planning, Code Localization, Code Editing, Code Verification, Self-Repair Loop, Tool Use — and grounds each fault in tiered evidence (deductive set-arithmetic / associational trajectory fact / model-inferred LLM judge). It shows a primary-cause banner, a per-capability scorecard, and a collapsible evidence chain (observation → inference → conclusion, with verbatim trajectory quotes and a tamper-evidence audit verdict) for each fault.
The attribution is computed by DECAF (awe), imported as a library through
agent_trajviz/insight/attribution.py. The feature needs a DECAF checkout: point
AWE_DECAF_PATH at it (default: a sibling ../DECAF directory). Without DECAF,
TrajViz runs fully standalone and the Attribution tab degrades to an informative
notice. It is gold-grounded — it needs the task's reference patch and test
outcome — so it works on trajectories from reference data laid out as
<reference_root>/data/{requirements,patch,trajectory}/ plus
eval_<agent>.json, with trajectories at
.../trajectory/<agent>/<instance_id>.json. Set the reference root with the
TRAJVIZ_REFERENCE_ROOT environment variable (default: a sibling directory with
that layout, if exactly one exists). When a trajectory is loaded from such a
path, its (agent, instance_id) are auto-detected and the tab populates on load;
for an uploaded file, set them in the tab's override fields. The uploaded file
must be byte-identical to the reference copy of that run — a re-formatted or
re-saved export, or your own fresh run of the same instance, is refused, because
the gold-grounded verdict is only valid for the exact canonical trajectory bytes.
Without a reference patch the tab degrades honestly (trajectory-only signals)
rather than guessing.
The deductive/associational slice (five capabilities) runs fully offline with
no API key; the two judge capabilities and the arbiter are read back from
cached verdicts when present. DECAF caches verdicts per judge model, and a
cached verdict is used only if its recorded provenance (trajectory, task,
prompt and evidence schema) matches the current inputs. By default the tab reads
the model whose cached verdicts carry DECAF's current evidence schema; set
AWE_JUDGE_MODEL to choose one explicitly. DECAF is stdlib-only and located at
runtime via AWE_DECAF_PATH (default: a sibling ../DECAF checkout).
agent_trajviz/insight/attribution.py documents the integration.
Collecting trajectories
TrajViz only reads trajectory files — producing them is the agent's responsibility. This section shows how to obtain a valid trajectory JSON for each supported agent.
Claude Code
TrajViz reads Claude Code sessions as ccsession-trajectory JSON: a top-level
"format": "ccsession-trajectory" marker and a trajectory array with one entry
per message (role, uuid, message_id, content blocks, usage,
timestamp, model, stop_reason), plus an optional sub_agents list. The
loader detects the marker and normalizes the step model automatically.
Claude Code's own session logs
(~/.claude/projects/<url-encoded-cwd>/<session-id>.jsonl) are not in this shape
and must be converted first. tests/fixtures/reference/data/trajectory/claude_code/
holds two complete examples of the expected file.
Cursor
Cursor stores each Agent chat as JSONL under
~/.cursor/projects/<workspace>/agent-transcripts/<chat-id>/ plus Composer
metadata in state.vscdb. TrajViz does not read those stores live — export
with the consolidator:
- Copy the chat id from the chat header menu (Copy ID, not Copy Request ID). It is also the transcript folder name.
- Export that chat (parent + subagents, joined with Composer metadata):
agent-trajviz-collect cursor <chat-id> cursor_trajectory.json
The consolidator finds Cursor'sstate.vscdbon its own, trying in order:CURSOR_STATE_VSCDB,CURSOR_USER_DATA_DIR, then%APPDATA%\Cursor\User\globalStorage\state.vscdb(Windows),~/.config/Cursor/User/globalStorage/state.vscdb(Linux),~/Library/Application Support/Cursor/User/globalStorage/state.vscdb(macOS) and/mnt/c/Users/<user>/AppData/Roaming/Cursor/...(WSL). Pass--dbto point at a specific file.CURSOR_PROJECTS_DIRoverrides~/.cursor/projects. - List known chats:
agent-trajviz-collect cursor --list
- Upload
cursor_trajectory.jsonin the Insight dashboard. The loader detectsexport_metadata.source_format: cursor_composer. Context occupancy (promptTokenBreakdownandtokens.context_window) is a window snapshot. Per-step duration comes from Composer tool/thinking clocks. Per-step token bars use a ≈4 chars/token estimate of logged text and tools, not billed API usage.
OpenCode
OpenCode stores sessions in its local store (~/.local/share/opencode/; on
Windows %USERPROFILE%\.local\share\opencode\) and
exposes an export command that writes trajectory JSON to stdout.
-
Run an OpenCode session as normal.
-
List recent sessions and pick the one you want — run this from the same working directory where the session was created;
opencode session listis scoped to the current directory's project ID:cd /path/to/your/project opencode session list --format json -n 10
-
Export the chosen session to JSON. Two paths depending on whether the session spawned sub-agents:
Typical case — no special sub-agents. Use OpenCode's built-in exporter (banner output goes to stderr, so redirection produces a clean file):
opencode export <session-id> > op_trajectory.json
Customized case — session has special sub-agents. Sub-agent invocations live under their own session IDs, so
opencode exporton the parent only gives you the parent's messages. Useagent-trajviz-collect opencodeto recursively pull the parent and every child session into one JSON:agent-trajviz-collect opencode <session-id> op_trajectory.json
The consolidator follows tool-call metadata to discover child session IDs and emits a flat
{"sessions": [...]}structure that the loader threads into a single trajectory. It looks foropencode.dbunder~/.local/share/opencode/(and on Windows also%LOCALAPPDATA%\opencode\and%APPDATA%\opencode\). Override withOPENCODE_DATABASEif needed:$env:OPENCODE_DATABASE = "$env:USERPROFILE\.local\share\opencode\opencode.db" agent-trajviz-collect opencode <session-id> op_trajectory.json
-
Upload
op_trajectory.jsonin the Insight dashboard. The loader detects theinfo+messagesshape automatically; sub-agent sessions are threaded in.
CodeArts
Current CodeArts AgentKernel builds persist sessions in an opencode.db
SQLite store. Export a root session together with all child/sub-agent
sessions using the read-only consolidator:
agent-trajviz-collect codearts path/to/opencode.db \
  --session-id <session-id> --output ca_trajectory.json
The consolidator follows both session.parent_id and tool-result session
metadata, preserves stored token dictionaries and precise part timing, and
emits the info + messages envelope with an export_metadata block whose
source_format is codearts_opencode_sqlite — the marker the dashboard
detects. Pass --no-children only when a root-only export is intentional. A
bare session ID can also be used when CODEARTS_DATABASE or
OPENCODE_DATABASE points at the database.
Upload the export JSON and select CodeArts. Already-consolidated export files can of course be uploaded directly.
The consolidator can also merge an old folder-based session
(chat_baseInfo.json + every messages_<n>.json shard) into a single
archival JSON. That legacy output preserves the original message records for
reproducibility but is not loadable by the dashboard, which only supports
the current export format.
ICode
ICode (Chrys) expanded-session exports are a JSON object with meta,
state.messages, and _chrys_export.format: chrys-expanded-session-v1.
Sub-agent runs are nested under _chrys_sub_agent_sessions in the same file.
- Export the session from ICode / chrys-manager as expanded session JSON (not the compressed transcript).
- Upload the
.jsonfile. Auto-detect recognizes the Chrys envelope.glob/grep/sh/explore_agentmap into the shared tool vocabulary, and nested sub-agent sessions are threaded into the step model.
Codex CLI
Codex CLI records every session automatically as a JSONL rollout under
~/.codex/sessions/ (date-bucketed rollout-<timestamp>-<session-id>.jsonl
files) — no exporter needed.
- Run a Codex session as normal.
- Locate the rollout file for the session — the most recent
rollout-*.jsonlunder~/.codex/sessions/. - Upload the
.jsonlfile. Auto-detect (the default) recognizes the leadingsession_metaevent and threads the rollout into the shared step model. Per-step tool intent (Read / Grep / Glob / Write / Bash) is inferred from classicexec_commandcalls and modernexec/apply_patchrecords.
Pi
Pi records every session automatically as JSONL under
~/.pi/agent/sessions/<url-encoded-cwd>/. No exporter is needed.
- Run a Pi session as normal.
- Locate the session file — the most recent
*.jsonlunder~/.pi/agent/sessions/(directories are named from the working folder). - Upload the
.jsonlfile. Auto-detect (the default) recognizes the leadingsessionevent and threads messages, thinking, tool calls (bash/read/write/ …), and token usage into the shared step model.
DeepSeek Harness
DeepSeek Harness (DSH) records each session as JSONL. The GUI export is a
folder (or zip) named dsh-session-<session-id>/ containing the parent
session.jsonl and, when the run spawned sub-agents, subagents/<id>/session.jsonl.
- Run a DSH session as normal.
- Export / download the session log from the DSH GUI (zip), or copy the session directory.
- Upload the zip (GUI exports put
session.jsonlandsubagents/at the zip root). That is the path that works on a hosted dashboard — the server never sees the uploader's~/Downloads. Auto-detect recognizes the leadingsessionheader (createdAt, slash-typed events) and does not treat it as a Pi log. Child sessions are merged from zip members, or from a siblingsubagents/tree when you load a session directory (orsession.jsonlnext to that tree) on the same machine. Uploading a lonesession.jsonlon a hosted dashboard cannot pick up children — the server has no access to the uploader's filesystem. Operators can setTRAJVIZ_DSH_EXPORT_ROOTto a directory on the host that contains the export (ordsh-session-<id>/). Inherited parent turns at the front of each child log are skipped.
Command-line tools
Installed with the package (each takes --help):
| Command | Purpose |
|---|---|
agent-trajviz |
The Insight dashboard; --report TRAJECTORY writes the standalone HTML report instead. See Run above. |
agent-trajviz-converge |
Compare two runs of a task (REF CMP), a batch manifest (--batch), or two batches before and after an intervention (--before/--after); JSON or --output summary. The comparison dashboard is python -m agent_trajviz.converge. |
agent-trajviz-collect cursor |
Read-only export of a Cursor Agent chat: JSONL transcripts + Composer state.vscdb, including subagent sessions. See the Cursor collection section above. |
agent-trajviz-collect codearts |
Read-only export from a CodeArts opencode.db with recursive child sessions, or lossless archival merge of legacy messages_<n>.json shards. See the CodeArts collection section above. |
agent-trajviz-collect opencode |
Recursively merge an OpenCode parent session and child sub-agent sessions into a single JSON. See the OpenCode collection section above. |
agent-trajviz-label |
LLM step classifier. Emits one label record for every parsed step: assistant steps via the LLM, user steps as deterministic user/user_prompt, with index/raw_index preserved for exact source mapping; --assistant-only keeps just the assistant records. |
agent_trajviz/labeling/taxonomy.md |
Authoritative list of phase and action tags the labeler emits. Bundled with the package and loaded by default; --taxonomy overrides it. |
Labeling a trajectory
agent-trajviz-label makes live LLM calls via requests (the llm extra).
The labeler needs three config values — provide them via a .env file (in
the repo root or CWD) or as CLI flags. A sample
.env.example ships with the repo; copy it and fill in
your own key:
cp .env.example .env
# then edit .env and set LABEL_BASE_URL / LABEL_API_KEY / LABEL_MODEL
Required variables and their CLI-flag equivalents:
| Variable | CLI flag | Meaning |
|---|---|---|
LABEL_BASE_URL |
--base-url |
API base URL (OpenAI-compatible) |
LABEL_API_KEY |
--api-key |
API key |
LABEL_MODEL |
--model |
Model name, e.g. gpt-4o-mini, glm-4.6 |
Optional: LABEL_PROVIDER (openai | anthropic, default openai),
LABEL_TEMPERATURE (default 0.3), LABEL_MAX_TOKENS (default 1024).
Example invocations:
# One record per step (default output: cc_trajectory_labeled.json)
agent-trajviz-label cc_trajectory.json

# Assistant steps only
agent-trajviz-label cc_trajectory.json --assistant-only --output cc_trajectory_assistant_labels.json

# Overriding config on the command line
agent-trajviz-label cc_trajectory.json \
    --output cc_trajectory_labeled.json \
    --base-url https://api.openai.com/v1 \
    --api-key sk-... \
    --model gpt-4o-mini
Prefer LABEL_API_KEY over --api-key: a key on the command line is
visible to other users in the process list and stays in your shell history.
Upload the trajectory and its labels sidecar in the dashboard's two upload slots to unlock phase-aware analytics and label-phase charts.
Development
uv sync --extra dev                          # locked environment with every extra
uv run pytest                                # test suite
uv run ruff check agent_trajviz tests examples   # lint
uv run --with mypy mypy --strict agent_trajviz/__init__.py agent_trajviz/api.py \
    agent_trajviz/errors.py agent_trajviz/model.py agent_trajviz/views.py \
    agent_trajviz/plugins.py                 # the typed public API
uv run --with pdoc pdoc --docformat restructuredtext -o site agent_trajviz \
    agent_trajviz.figures agent_trajviz.dashboard agent_trajviz.llm agent_trajviz.attribution
                                             # the API reference, as HTML in site/
uv build                                     # sdist + wheel into dist/
uv lock --upgrade                            # refresh the locked test environment
Dependency lower bounds in pyproject.toml are the oldest releases the suite
passes with; CI installs them (uv pip install --resolution lowest-direct ".[dev]") on the oldest and newest supported Python. CI runs the suite on
Linux (Python 3.11 to 3.14) and macOS, and the public API from the installed
wheel on Windows (.github/scripts/smoke_core.py). Releases are published
to PyPI from a v* tag by .github/workflows/release.yml.
CONTRIBUTING.md has the ground rules (fixtures, the pinned API, view schemas) and the release steps.
CI builds the same API reference from the docstrings on every push and keeps
it as the api-reference artifact; a test holds every public name to having a
docstring.
Tests that need the optional DECAF checkout skip when it is absent. Changes are recorded in CHANGELOG.md; see SECURITY.md for reporting vulnerabilities.
License
MIT — see LICENSE.
1 maintainer

Metadata
1 maintainer
Release files for agent-trajviz 0.1.0
For a detailed explanation of source distributions (sdists) and built distributions (wheels), please see the package formats documentation.
Source distribution (sdist)
| File | Size | Uploaded | |
|---|---|---|---|
| agent_trajviz-0.1.0.tar.gz | 437.4 kB | Details |
Built distribution (wheel)
| File | Interpreter | ABI | Platform | Reset |
|---|---|---|---|---|
| agent_trajviz-0.1.0-py3-none-any.whl | Python 3 | none | any | Details |
Total release size: 945.1 kB
Release files / agent_trajviz-0.1.0.tar.gz
| Download URL | agent_trajviz-0.1.0.tar.gz |
|---|---|
| Size | 437.4 kB |
| Tags | Source |
|
SHA-256 checksum How to use checksums |
73edd020b8d6835a125a48f342e29dc96d655a254d36d88bd13605e89ce09480
|
|
BLAKE2b-256 checksum How to use checksums |
5cb8beda5cc8f677cbc774038f34afe692cd977f5f9fadb43f8958464da545cf
|
| Upload date | |
|
Uploaded using Trusted Publishing? What is trusted publishing? |
Yes |
| Uploaded via |
twine/7.0.0 CPython/3.13.14
|
Provenance
Provenance describes where a file came from. On PyPI, provenance is shared via attestations, which provide a verifiable record of the build or publishing details. View details, limitations and caveats.


PyPI Publish Attestation
PyPI verified that this artifact, at this checksum, originated from the publisher listed below.
Signed by GitHub Actions, verified by PyPI on Oct 12, 2026.
Transparency logRelease files / agent_trajviz-0.1.0-py3-none-any.whl
| Download URL | agent_trajviz-0.1.0-py3-none-any.whl |
|---|---|
| Size | 507.7 kB |
| Tags | Python 3 |
|
SHA-256 checksum How to use checksums |
6c9526b225a1833a2b1307d8a38c87c0ca21cf088080654017c11eb12c1a04d8
|
|
BLAKE2b-256 checksum How to use checksums |
af008813772774a9396ad8c121958f578204f2f4c0368e78c755c33d92a175e0
|
| Upload date | |
|
Uploaded using Trusted Publishing? What is trusted publishing? |
Yes |
| Uploaded via |
twine/7.0.0 CPython/3.13.14
|
Provenance
Provenance describes where a file came from. On PyPI, provenance is shared via attestations, which provide a verifiable record of the build or publishing details. View details, limitations and caveats.
PyPI Publish Attestation
PyPI verified that this artifact, at this checksum, originated from the publisher listed below.
Signed by GitHub Actions, verified by PyPI on Oct 12, 2026.
Transparency log












