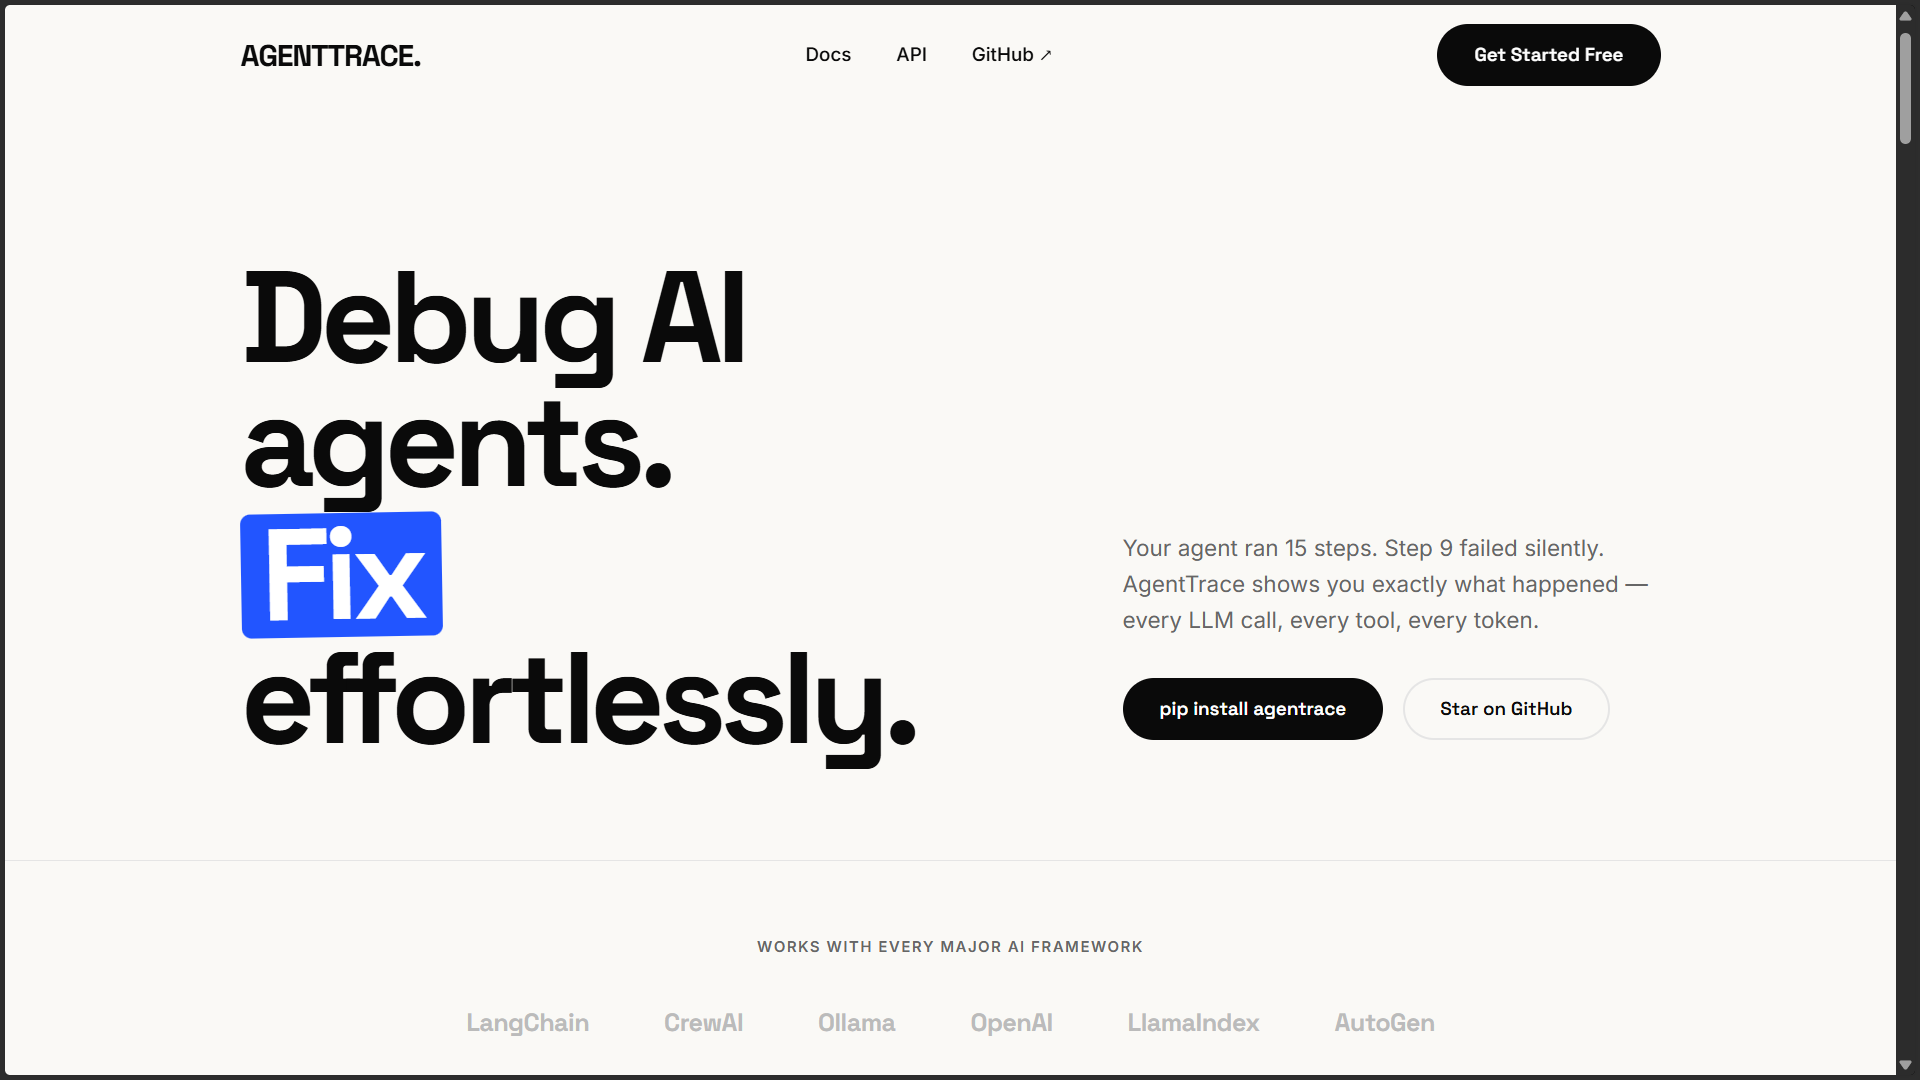
Visual debugger for AI agents. See every step, every decision, every failure.

Project description


The Problem
You built an AI agent. It runs 15 steps. Something breaks at step 9.
You have no idea why.
The LLM got a bad prompt? A tool returned garbage? A file permission failed silently? You add print() everywhere. You re-run it. You grep through 300 lines of logs. Forty minutes later, you find the bug.
This is the debugging dark age for AI agents. No step-by-step visibility. No tool call inspector. No way to see what the LLM was actually thinking at each decision point.
AgentTrace fixes this.
Quick Start
Two packages. One shared purpose.
pip install agentrace              ← instruments your Python agent
npx @ravaniroshan/agentrace        ← opens the visual trace viewer
Step 1 — Instrument your agent (add 3 decorators, nothing else changes):
from agentrace import trace, trace_llm, trace_tool
import ollama

@trace(name="research_agent")
def run_agent(task: str):
    response = call_llm([{"role": "user", "content": task}])
    results  = web_search(response.message.content)
    write_file("output.md", results)

@trace_llm
def call_llm(messages: list):
    return ollama.chat(model="qwen2.5:7b", messages=messages)

@trace_tool
def web_search(query: str) -> str:
    ...
Step 2 — Run your agent normally:
[AgentTrace] Run complete → COMPLETED
[AgentTrace] 8 steps  |  2840 tokens  |  4.2s
[AgentTrace] View trace → http://localhost:7823/trace/a3f9c1b2
Step 3 — Open the viewer:
npx @ravaniroshan/agentrace
You see this:
● ──── ● ──── ● ──── ● ──── ● ──── ● ──── ● ──── ✕
1      2      3      4      5      6      7      8
                                               ERROR ↑

  STEP 8   write_file   [FAILED]   12ms
  ─────────────────────────────────────────────────
  INPUT
    path:    "output.md"
    content: "# Research Summary..."

  ERROR
    PermissionError: cannot write to output.md
    File is open in another process

  ← Step 7: LLM decided to write the summary
  → Step 9:  never reached
Bug found. Fixed in 30 seconds.
Dashboard
npx @ravaniroshan/agentrace
Open http://localhost:7823 to see:
- All agent runs — live as they happen
- Costs, success rate, avg duration at a glance
- Automatic root cause analysis on every failure
- Time filters: last 24h / 7 days / all time
Failure Intelligence
When an agent run fails, AgentTrace automatically identifies the root cause:
- Which step made the run unrecoverable
- Why that step's output caused the downstream failure
- The last recovery point before the failure chain began
- Recurring failure patterns across multiple runs
No configuration. No API keys. Fires automatically on every failed run.
How It Works
Your Agent Code
    │
    │  @trace / @trace_llm / @trace_tool  (3 decorators)
    ▼
TraceCollector              captures every event in-memory, per-thread
    │
    ▼
~/.agentrace/traces/        one JSON file per run — never leaves your machine
    │
    ▼
Express server              localhost:7823  (Node.js · npx agentrace)
    │
    ▼
Visual UI                   timeline + step inspector + token counts
Everything is local. No cloud. No accounts. No API keys. No data leaves your machine.
Both the Python library and the npm CLI read from the same folder — ~/.agentrace/traces/. Run your agent from Python, view traces from any terminal with npx. Zero config between them.
CLI Commands
npx @ravaniroshan/agentrace              # start UI viewer (default)
npx @ravaniroshan/agentrace ui           # start UI viewer
npx @ravaniroshan/agentrace traces       # list all traces in terminal
npx @ravaniroshan/agentrace clear        # delete all traces
npx @ravaniroshan/agentrace --version    # show version
npx @ravaniroshan/agentrace --help       # show help
Global install (optional — skip npx every time):
npm install -g @ravaniroshan/agentrace
agentrace ui
agentrace traces
What agentrace traces looks like:
  AgentTrace — Recorded Runs

  ID          Name                  Status      Steps   Duration    Tokens
  ────────────────────────────────────────────────────────────────────────
  a3f9c1b2    research_agent        completed   8       4.20s       2840
  9c4b1e3f    failing_agent         failed      6       2.41s       1345
              ✕ FileNotFoundError: File not found: config.txt

  2 runs total  ·  npx @ravaniroshan/agentrace ui to view in browser
What Gets Captured
For every @trace_llm call
| Field | Description |
|---|---|
| Full message history | Every message sent to the model |
| Model name | Which model + version was called |
| Response content | What the model replied |
| Tokens in / out | Prompt + completion token counts |
| Cost (USD) | Per-step cost based on model pricing |
| Latency | Execution time in ms |
| Error | Full traceback if the call failed |
For every @trace_tool call
| Field | Description |
|---|---|
| Function arguments | Exact values passed in |
| Return value | What the tool returned |
| Latency | Execution time in ms |
| Error | Full traceback including line number |
API Reference
@trace
Marks the agent entry point. Starts a new trace for the entire run.
@trace                               # uses function name
@trace(name="my_agent")             # explicit run name
@trace(name="agent", metadata={})   # attach custom metadata
@trace(auto_open=False)             # don't auto-start UI server
Supports def and async def.
@trace_llm
Wraps an LLM call. Captures prompt, response, tokens, model, latency, cost.
@trace_llm                           # auto-detects model from arguments
@trace_llm(model="gpt-4o")          # explicit model label
Auto-detects token counts from Ollama, OpenAI, and Anthropic response formats.
@trace_tool
Wraps a tool call. Captures input arguments, return value, and any exception.
@trace_tool                              # uses function name
@trace_tool(name="filesystem.write")     # explicit name in the UI
EventCapture — manual instrumentation
For wrapping third-party code or dynamic dispatch:
from agentrace import EventCapture

with EventCapture("tool_call", "database.query", input={"sql": query}) as cap:
    result = db.execute(query)
    cap.output   = result.fetchall()
    cap.metadata = {"rows": len(result)}
TraceStorage — programmatic access
from agentrace import TraceStorage

traces = TraceStorage.list_all()           # all trace summaries
trace  = TraceStorage.load("a3f9c1b2")    # full trace with all steps
TraceStorage.delete("a3f9c1b2")           # remove one trace
TraceStorage.search(q="research", status="failed")  # filter traces
Framework Support
AgentTrace is framework-agnostic. Wrap the functions. That's it.
# ✅ Raw Python agents
# ✅ LangChain
# ✅ LlamaIndex
# ✅ CrewAI
# ✅ AutoGen
# ✅ Smolagents
# ✅ Async agents (asyncio / anyio)
# ✅ Any custom agent loop
LangChain — zero decorators via auto-patch
import agentrace
agentrace.patch_langchain()    # instruments all LangChain LLM + tool calls

@trace(name="my_chain")
def run():
    chain.invoke({"question": "..."})   # automatically traced
CrewAI
@trace(name="crewai_research")
def run_crew(topic: str):
    crew = Crew(agents=[researcher, writer], tasks=[...])
    return crew.kickoff(inputs={"topic": topic})

@trace_tool(name="search.web")
def search_tool(query: str) -> str:
    return SerperDevTool().run(query)
Ollama
@trace_llm
def call_llm(messages):
    return ollama.chat(model="qwen2.5-coder:7b", messages=messages)
Async Support
All decorators work on async def with zero changes:
@trace(name="async_agent")
async def run_agent(task: str):
    response = await call_llm(...)
    result   = await fetch_data(...)

@trace_llm
async def call_llm(messages):
    return await async_client.chat(model="qwen2.5:7b", messages=messages)
Trace Storage
All traces are plain JSON at ~/.agentrace/traces/<trace_id>.json.
~/.agentrace/
└── traces/
    ├── a3f9c1b2.json   # completed — 8 steps, 2840 tokens
    ├── 9c4b1e3f.json   # failed — error at step 6
    └── ...
Both the Python library and the npm CLI read and write to this same location. No sync needed.
Installation
Python library (required — for agent instrumentation)
pip install agentrace              # core library only
pip install "agentrace[server]"   # includes FastAPI UI server (alternative to npx)
Requires: Python 3.10+
npm CLI (recommended — for the visual UI viewer)
# No install — always runs latest:
npx @ravaniroshan/agentrace

# Or install once globally:
npm install -g @ravaniroshan/agentrace
Requires: Node.js 18+
Why Not Just Use...
| AgentTrace | LangSmith | Helicone | Print statements | |
|---|---|---|---|---|
| Step-by-step visibility | ✅ | ✅ | ❌ | ❌ |
| Works with any framework | ✅ | ❌ | ✅ | ✅ |
| 100% local | ✅ | ❌ | ❌ | ✅ |
| Free forever | ✅ | Partial | Partial | ✅ |
| Visual UI | ✅ | ✅ | ✅ | ❌ |
| Token tracking | ✅ | ✅ | ✅ | ❌ |
| Cost tracking | ✅ | ✅ | ✅ | ❌ |
| Zero config | ✅ | ❌ | ❌ | ✅ |
AgentTrace is the only tool built specifically to debug agentic loops — the multi-step, tool-using, decision-making flows that break in ways traditional logging cannot explain.
Roadmap
v0.1 (current)
- Core decorators —
@trace,@trace_llm,@trace_tool - JSON trace persistence —
~/.agentrace/traces/ - Visual timeline UI with step inspector
- Token tracking — Ollama, OpenAI, Anthropic
- Cost tracking — per step + per run
- Error highlighting with full traceback
- npm CLI —
ui,traces,clear - Async support —
defandasync def - LangChain auto-instrumentation via
patch_langchain() - Trace search + filter — by name, status, model, date
- Published on npm as
@ravaniroshan/agentrace - Published on PyPI as
agentrace
v0.2 (next)
- Side-by-side run comparison
- Token waterfall chart — visualize budget per step
- CrewAI auto-instrumentation
- LlamaIndex auto-instrumentation
- Regression mode — flag behavior changes between runs
v0.3 (planned)
- CI/CD integration — fail build on behavior regression
- VS Code extension — see traces inline while coding
- Export trace as shareable HTML report
- Multi-run cost dashboard
v1.0 (horizon)
- AgentTrace Cloud — share traces across your team
- Team dashboards + run history
- Slack / Discord alerts on agent failure
Contributing
Built because debugging agents was making us insane.
git clone https://github.com/ravaniroshan/agentrace
cd agentrace

# Python library
pip install -e ".[server]"
python examples/basic_agent.py     # generates sample traces

# npm CLI
cd agentrace-npm
npm install
node bin/agentrace.js traces       # verify traces from above
node bin/agentrace.js ui           # open UI at localhost:7823
Before opening a PR:
- Open an issue first for non-trivial changes
- Add an example for new features
- Keep
collector.pyanddecorators.pydependency-free (stdlib only) - Keep
bin/agentrace.jsworking without any build step
Repository Structure
agentrace/
├── agentrace/               ← Python library (pip install agentrace)
│   ├── collector.py         ← core event capture, thread-safe
│   ├── decorators.py        ← @trace @trace_llm @trace_tool
│   ├── storage.py           ← JSON persistence, ~/.agentrace/traces/
│   ├── server.py            ← FastAPI server (Python alternative)
│   ├── cli.py               ← Python CLI entry point
│   └── ui/index.html        ← web viewer UI
├── agentrace-npm/           ← npm package (npx @ravaniroshan/agentrace)
│   ├── bin/agentrace.js     ← CLI entrypoint
│   ├── src/
│   │   ├── server.js        ← Express server
│   │   ├── commands/        ← ui, traces, clear
│   │   └── ui/index.html    ← web viewer UI
│   └── package.json
├── agentrace-site/          ← docs site (Astro + Starlight)
│   └── src/content/docs/    ← all documentation pages
├── examples/
│   └── basic_agent.py       ← demo agent (success + failure)
└── README.md
License
MIT — use it, fork it, ship it.
If this saved you an hour of debugging — star the repo.
That's the only metric that matters right now.
Made with frustration and Python + Node.js · GitHub · npm · PyPI · Docs
Release history Release notifications | RSS feed

Download files
Download the file for your platform. If you're not sure which to choose, learn more about installing packages.
Source Distribution
Built Distribution
Filter files by name, interpreter, ABI, and platform.
If you're not sure about the file name format, learn more about wheel file names.
Copy a direct link to the current filters
File details
Details for the file agentclaw-0.2.1.tar.gz.
File metadata
- Download URL: agentclaw-0.2.1.tar.gz
- Upload date:
- Size: 26.4 kB
- Tags: Source
- Uploaded using Trusted Publishing? No
- Uploaded via: twine/6.2.0 CPython/3.13.3
File hashes
| Algorithm | Hash digest | |
|---|---|---|
| SHA256 |
68bcd00b807bde43d253fbf154743d7c646b3b2733f2c8fd86acdc00525b53ad
|
|
| MD5 |
af8dd2abacb7cd497d6d31d870acca89
|
|
| BLAKE2b-256 |
dd911d1bdcaf7e7f39fbfb8fb5b1426d544a932f7a511811c3848fb918b7c5c4
|
File details
Details for the file agentclaw-0.2.1-py3-none-any.whl.
File metadata
- Download URL: agentclaw-0.2.1-py3-none-any.whl
- Upload date:
- Size: 27.5 kB
- Tags: Python 3
- Uploaded using Trusted Publishing? No
- Uploaded via: twine/6.2.0 CPython/3.13.3
File hashes
| Algorithm | Hash digest | |
|---|---|---|
| SHA256 |
4a917267f5ddd7cb11e2c3b89b6e223f6eaee83d81c65cc35ba0cd84ed707db5
|
|
| MD5 |
2612087c4f20266041b46b0f84a794fc
|
|
| BLAKE2b-256 |
ab0ee710d993f883cc4e16f9c9ab8b15d47c2288c53b73e0e2589b7a45f229d2
|


