
AgentMesh





AgentMesh is free, open-source, self-hosted observability for AI agents: traces, sessions, costs, automatic debugging insights, datasets and LLM-as-judge evaluations, and alerts — for agents built with any framework, in Python or TypeScript.
Agent runs are hard to debug once prompts, tools, retrieval, retries, sub-agents, and humans start influencing each other. AgentMesh records every run as an inspectable trace so you can answer what happened, which step broke first, is it looping, how much it cost, and where the time went.
Bring your own stack. Point any OpenTelemetry exporter at AgentMesh (OpenAI Agents SDK, Pydantic AI, LangGraph, CrewAI, Vercel AI SDK, ...), add one decorator to plain Python or TypeScript, or auto-instrument the OpenAI and Anthropic clients. Store traces in SQLite or PostgreSQL. No account, no cloud, MIT licensed.
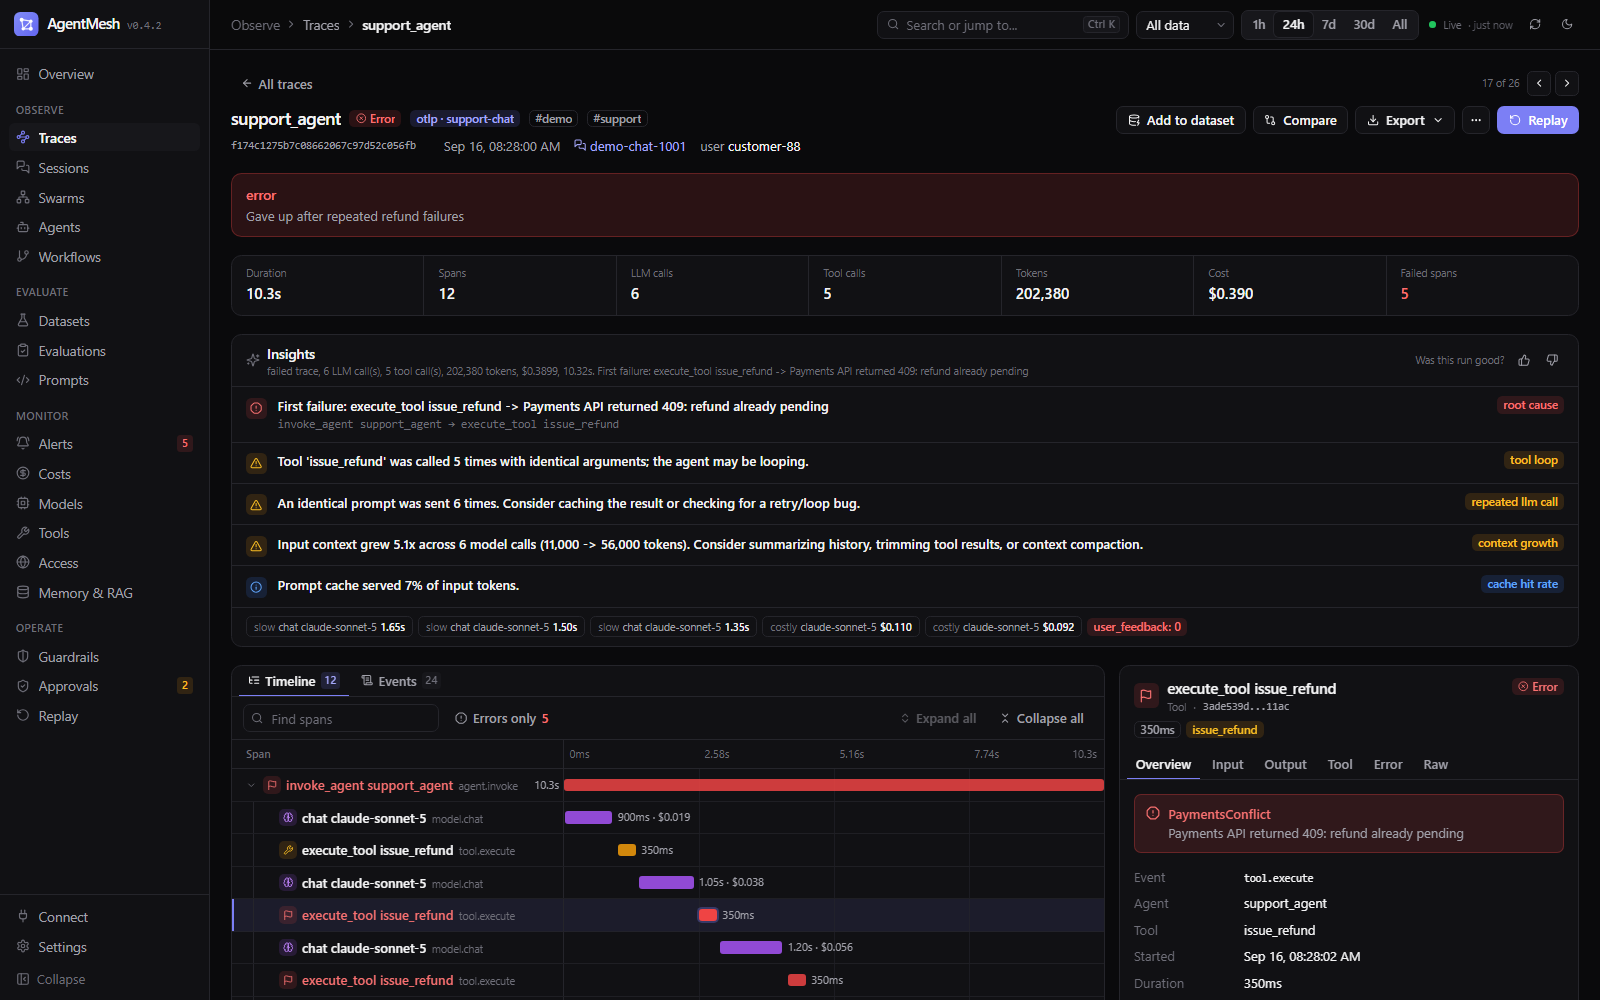
A failed support-agent run, traced over OpenTelemetry: AgentMesh points at the first failing tool call, the refund tool being retried in a loop, and the context growing 5× across model calls.
What you get
- Works with any framework — an OTLP/HTTP receiver (
/v1/traces, JSON or protobuf) that understands the OpenTelemetry GenAI semantic conventions, OpenInference, OpenLLMetry, and Vercel AI SDK attributes. Integrations → - Python SDK —
@agentmesh.observe,agentmesh.trace(session_id=..., user_id=...),agentmesh.score(...); sync, async, and generators. SDK → - TypeScript SDK —
npm install agentmesh-sdk:observe(),trace(),score(),instrumentOpenAI(),instrumentAnthropic(), andrunExperiment()for Node.js agents. TypeScript → - Auto-instrumentation —
instrument_openai()andinstrument_anthropic(): Chat Completions, Responses, Embeddings, Messages, streaming, tool calls, cache and reasoning tokens. - Automatic insights — first failure with its causal path, tool-call loops, repeated identical prompts, runaway context growth, prompt-cache hit rate, self-time and cost hotspots.
- Sessions and users — multi-turn conversations grouped by
gen_ai.conversation.id, with every turn's input, output, and feedback. - Scores and feedback — thumbs up/down in the dashboard,
POST /api/scores, SDK scores, and OTelgen_ai.evaluation.resultevents. - Datasets and experiments — turn traces into test cases with one click, run a new prompt or model over them, and compare item by item: what regressed, what improved, what it cost. Gate releases in CI with
agentmesh experiments run --fail-under. Evals → - LLM-as-judge —
LLMJudge("correctness", judge=...)with any model, plus exact-match, contains, regex, JSON, and similarity evaluators; score production traces withevaluate_traces(). - Alerts — Slack, Discord, or signed webhook notifications for failure spikes, spend, expensive traces, p95 latency, and agents stuck in tool loops. Alerts →
- Accurate cost tracking — per-million-token pricing with cache-read/cache-write rates, current Claude, GPT, and Gemini prices built in,
agentmesh pricing syncfor everything else. - MCP server —
agentmesh mcplets Claude Code, Cursor, or any MCP client list, inspect, diagnose, and score your traces, compare experiments, and check alerts. MCP → - SQLite or PostgreSQL — SQLite for a zero-setup local install;
AGENTMESH_DB_URL=postgresql://...for a shared team server, with every feature on both. - Replay and time travel — deterministic replay and checkpoint forking for workflows built with the AgentMesh runtime.
- Privacy and retention — secret redaction,
AGENTMESH_CAPTURE_CONTENT=false, content truncation,agentmesh traces prune --older-than 30d. - Optional runtime — AgentMesh also includes an async multi-agent runtime (workflows, tools with approval gates, budgets, RAG, memory) if you want orchestration and observability in one package.
How it fits together
flowchart LR
    subgraph sources["Your agents"]
        A["OpenTelemetry frameworks<br/>OpenAI Agents SDK, Pydantic AI,<br/>LangGraph, CrewAI, Vercel AI SDK"]
        B["Python and TypeScript SDKs<br/>observe(), trace()"]
        C["OpenAI and Anthropic clients<br/>instrument_openai()"]
        D["AgentMesh runtime<br/>Workflow and Agent"]
    end
    A -- "OTLP /v1/traces" --> M["Ingest and GenAI<br/>semantic mapping"]
    B -- "SDK" --> M
    C -- "SDK" --> M
    M --> S[("SQLite or PostgreSQL<br/>traces, sessions, scores,<br/>datasets, experiments")]
    D --> S
    S --> I["Insights: root cause, loops,<br/>context growth, cost hotspots"]
    S --> E["Experiments and<br/>LLM-as-judge evaluators"]
    S --> AL["Alert rules"]
    AL -- "Slack, Discord, webhook" --> N["Notifications"]
    I --> UI["Dashboard"]
    E --> UI
    I --> MCP["MCP server<br/>Claude Code, Cursor"]
    I --> CLI["CLI and REST API"]
Observe an existing agent in 60 seconds
pip install "agentmesh-ai[otlp]"
agentmesh dashboard            # http://127.0.0.1:8787 — OTLP endpoint at /v1/traces
Until v0.4.0 is published to PyPI, install from a clone instead:
pip install -e ".[otlp]"(see Quickstart from source). From v0.4.0 the PyPI wheel includes the full React dashboard.
Option A — any OpenTelemetry-instrumented framework:
export OTEL_EXPORTER_OTLP_ENDPOINT="http://127.0.0.1:8787"
python my_agent.py
Option B — plain Python with the SDK:
import agentmesh

agentmesh.init(service_name="support-bot")     # writes to the local AgentMesh database
agentmesh.instrument_anthropic()               # and/or agentmesh.instrument_openai()

@agentmesh.observe(kind="tool")
def lookup_order(order_id: str) -> dict: ...

@agentmesh.observe(kind="agent")
def support_agent(question: str) -> str: ...

with agentmesh.trace("support-turn", session_id="chat-42", user_id="u-7"):
    answer = support_agent("Where is my order?")
    agentmesh.score("resolved", True)
Try it offline: python examples/sdk_quickstart.py, then open the Sessions and Traces pages.
Option C — TypeScript / Node.js:
import OpenAI from "openai";
import { init, instrumentOpenAI, observe, trace } from "agentmesh-sdk";   // npm install agentmesh-sdk

init({ serviceName: "support-bot" });                 // sends to http://127.0.0.1:8787
const openai = instrumentOpenAI(new OpenAI());
const lookupOrder = observe(async (id: string) => ({ id, status: "shipped" }), { kind: "tool", name: "lookup_order" });

await trace("support-turn", { sessionId: "chat-42" }, async () => lookupOrder("A-1001"));
Option D — ask your coding agent:
claude mcp add agentmesh -- agentmesh mcp --db /absolute/path/.agentmesh/agentmesh.db
# "Diagnose the most recent failed trace"
Test changes before you ship them
Save good (and bad) production answers as a dataset, run the new version over it, and compare:
from agentmesh import Contains, LLMJudge

result = agentmesh.run_experiment(
    "support-regressions",                      # built from traces with "Add to dataset"
    task=support_agent_v2,
    evaluators=[Contains(), LLMJudge("correctness", judge=call_my_llm)],
    name="prompt-v2",
)
print(result.format_summary())
# In CI: fail the build if quality drops or any item regresses against the last release
agentmesh experiments run --dataset support-regressions --task app.py:support_agent_v2 \
  --evaluator contains --fail-under contains=0.9 --baseline exp_1234 --fail-on-regression
And get told when production misbehaves:
agentmesh alerts add --name "tool loops" --kind loop_detected --threshold 4 --webhook https://hooks.slack.com/services/...
agentmesh alerts add --name "checkout failures" --kind failure_rate --threshold 0.2 --window 15m --workflow checkout
Try both offline: python examples/datasets_experiments.py, then open Datasets & Evals and Alerts.
Quickstart from source
Windows PowerShell
git clone https://github.com/raghuece455/AgentMesh.git
cd AgentMesh
py -3.13 -m venv .venv
.\.venv\Scripts\Activate.ps1
python -m pip install -e ".[otlp]"
python -m agentmesh.cli demo seed --reset
python -m agentmesh.cli dashboard --host 127.0.0.1 --port 8790
macOS/Linux
git clone https://github.com/raghuece455/AgentMesh.git
cd AgentMesh
python3 -m venv .venv
source .venv/bin/activate
python -m pip install -e ".[otlp]"
python -m agentmesh.cli demo seed --reset
python -m agentmesh.cli dashboard --host 127.0.0.1 --port 8790
Open http://127.0.0.1:8790 — you'll see the full dashboard with seeded demo traces.
In a second terminal, run real examples against the live dashboard:
AGENTMESH_DB_URL=.agentmesh/agentmesh.db python examples/sdk_quickstart.py   # SDK tracing, no API keys
python examples/hello_agent.py
python examples/researcher_writer_reviewer.py
python examples/tool_calling_agent.py
python examples/rag_document_qa.py
python examples/failed_run_debugging.py
See Setup.md for the full setup guide including provider configuration, Docker, and PostgreSQL.
Docker (one command)
docker compose up --build
Open http://127.0.0.1:8787. Demo data is seeded on start (set AGENTMESH_DEMO_SEED=false to keep your own traces). The port is published on localhost only; before exposing it, set AGENTMESH_AUTH_MODE=api_key and AGENTMESH_API_KEY in .env — see docs/docker.md.
Built-in Runtime Example
If you are starting a new project, the AgentMesh runtime gives you orchestration with tracing, budgets, approvals, and replay built in:
import asyncio

from agentmesh import Agent, MockModelProvider, Workflow, WorkflowMode


async def main() -> None:
    provider = MockModelProvider(["Draft plan", "Final answer"])
    workflow = Workflow("hello-team", mode=WorkflowMode.SEQUENTIAL)
    workflow.add_agent(Agent("planner", "Planner", "Create a short plan.", provider))
    workflow.add_agent(Agent("writer", "Writer", "Write the final answer.", provider))
    workflow.add_step("planner", "Plan a launch checklist")
    workflow.add_step("writer", "Turn the plan into a concise response")

    result = await workflow.run({"goal": "ship a demo"})
    print(result.trace_id)
    print(result.output)


asyncio.run(main())
Replace MockModelProvider with OpenAICompatibleProvider, AnthropicProvider, OllamaProvider, or any other provider — traces look identical regardless of which model you use.
Dashboard
The local dashboard is built around production debugging workflows:
| Page | What you get |
|---|---|
| Overview | Runs, success/failure rate, latency, tokens, cost, provider health, budget usage, recent failures |
| Trace Explorer | Searchable traces, nested span tree, waterfall timeline, automatic insights, scores and thumbs up/down feedback, span detail, raw JSON, export, replay |
| Sessions | Multi-turn conversations: every turn's input, output, status, cost, and feedback in order |
| Datasets & Evals | Datasets built from traces or by hand, experiment runs with per-evaluator scores, and item-by-item comparison of two runs |
| Alerts | Alert rules with live state, one-click test notifications, and alert history |
| Connect | Your OTLP endpoint and copy-paste setup for OpenTelemetry, the Python and TypeScript SDKs, OpenAI Agents SDK, Pydantic AI, and MCP |
| Workflows | Node graph with agent/task/model/tool/memory/approval nodes, status, retries, cost, latency |
| Agents | Role, model/provider, cost/token trends, tool calls, memory operations, errors |
| Models | Provider health, calls, token split, cost, latency, p95, error rate, rate limits |
| Costs | Spend today/week/month, budget used/remaining, failed-run waste, cache savings |
| Tools | Tool call inspector with permissions, approval status, side effects, sandbox logs |
| Memory & RAG | Memory operations, versioned records, retrieved chunks, similarity scores, source metadata |
| Replay Studio | Deterministic replay of a whole trace or from a selected span; simulated and live modes from the CLI/API |
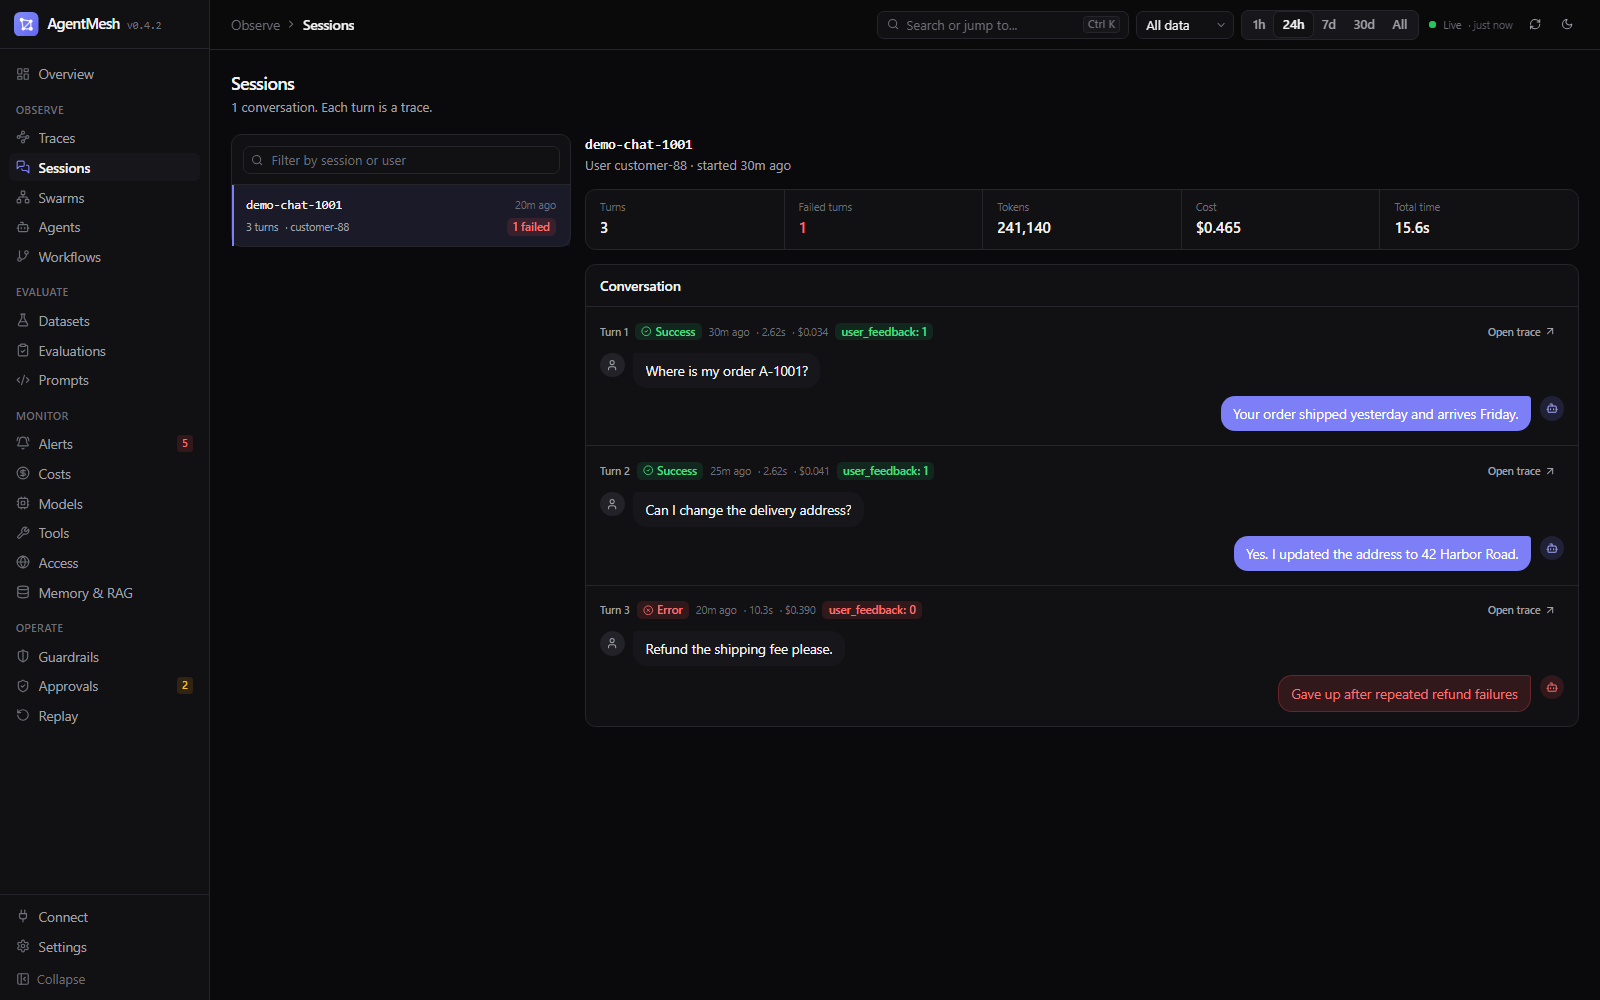 Sessions — every turn of a conversation, with feedback |
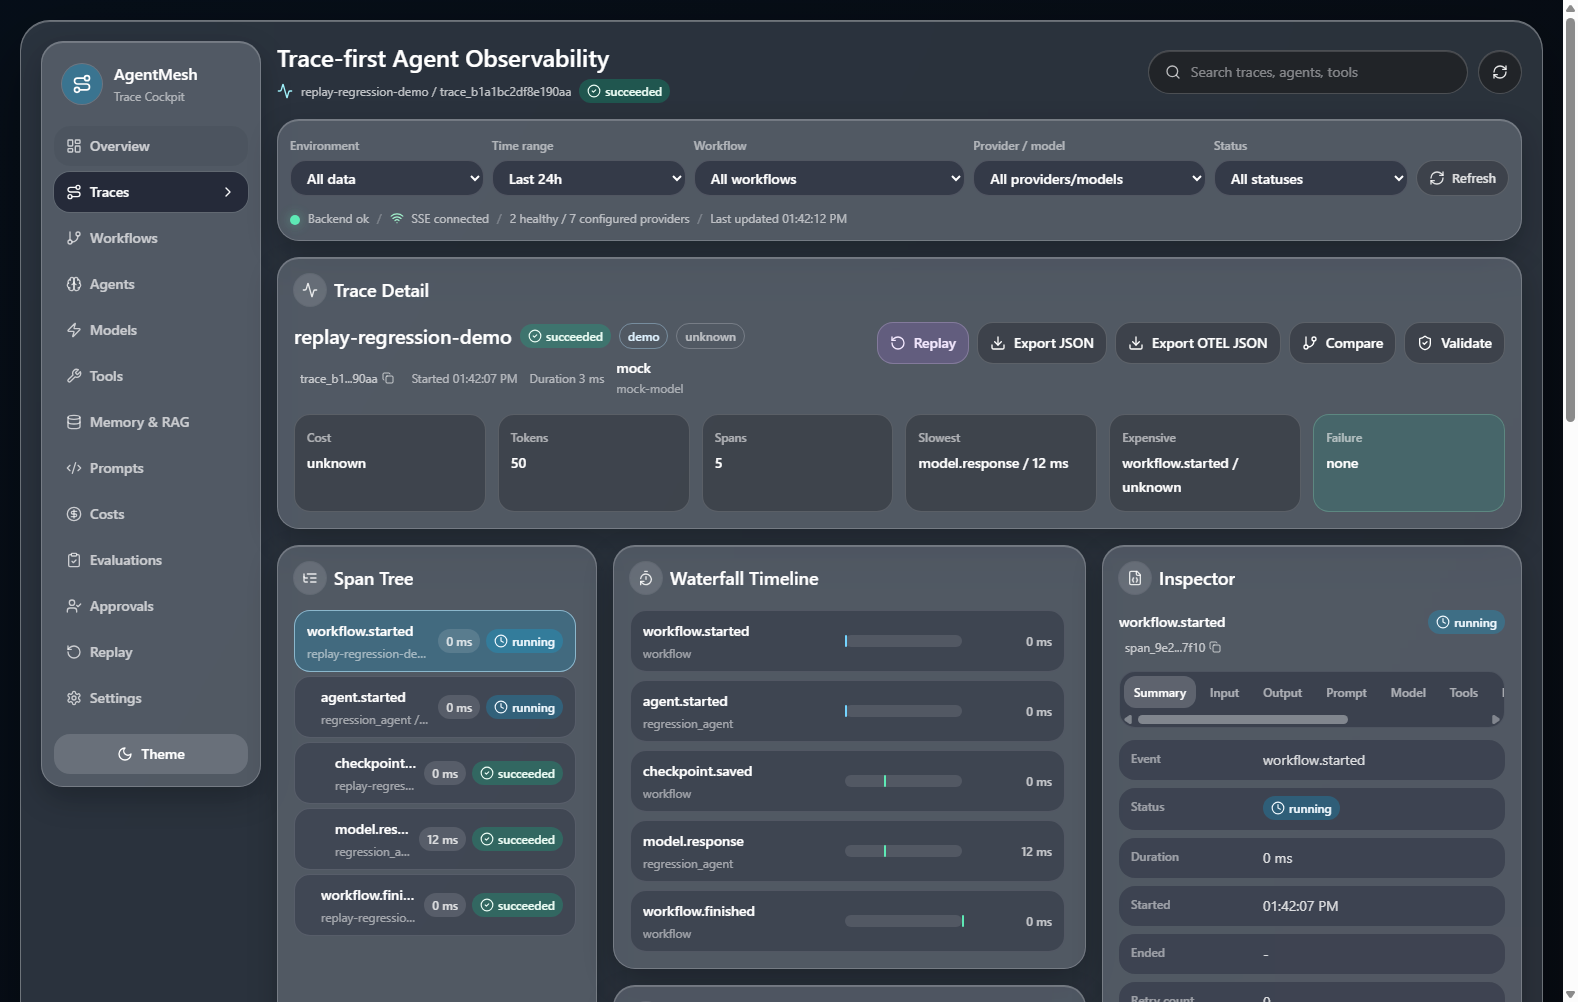 Trace detail — cost, hotspots, span tree, waterfall |
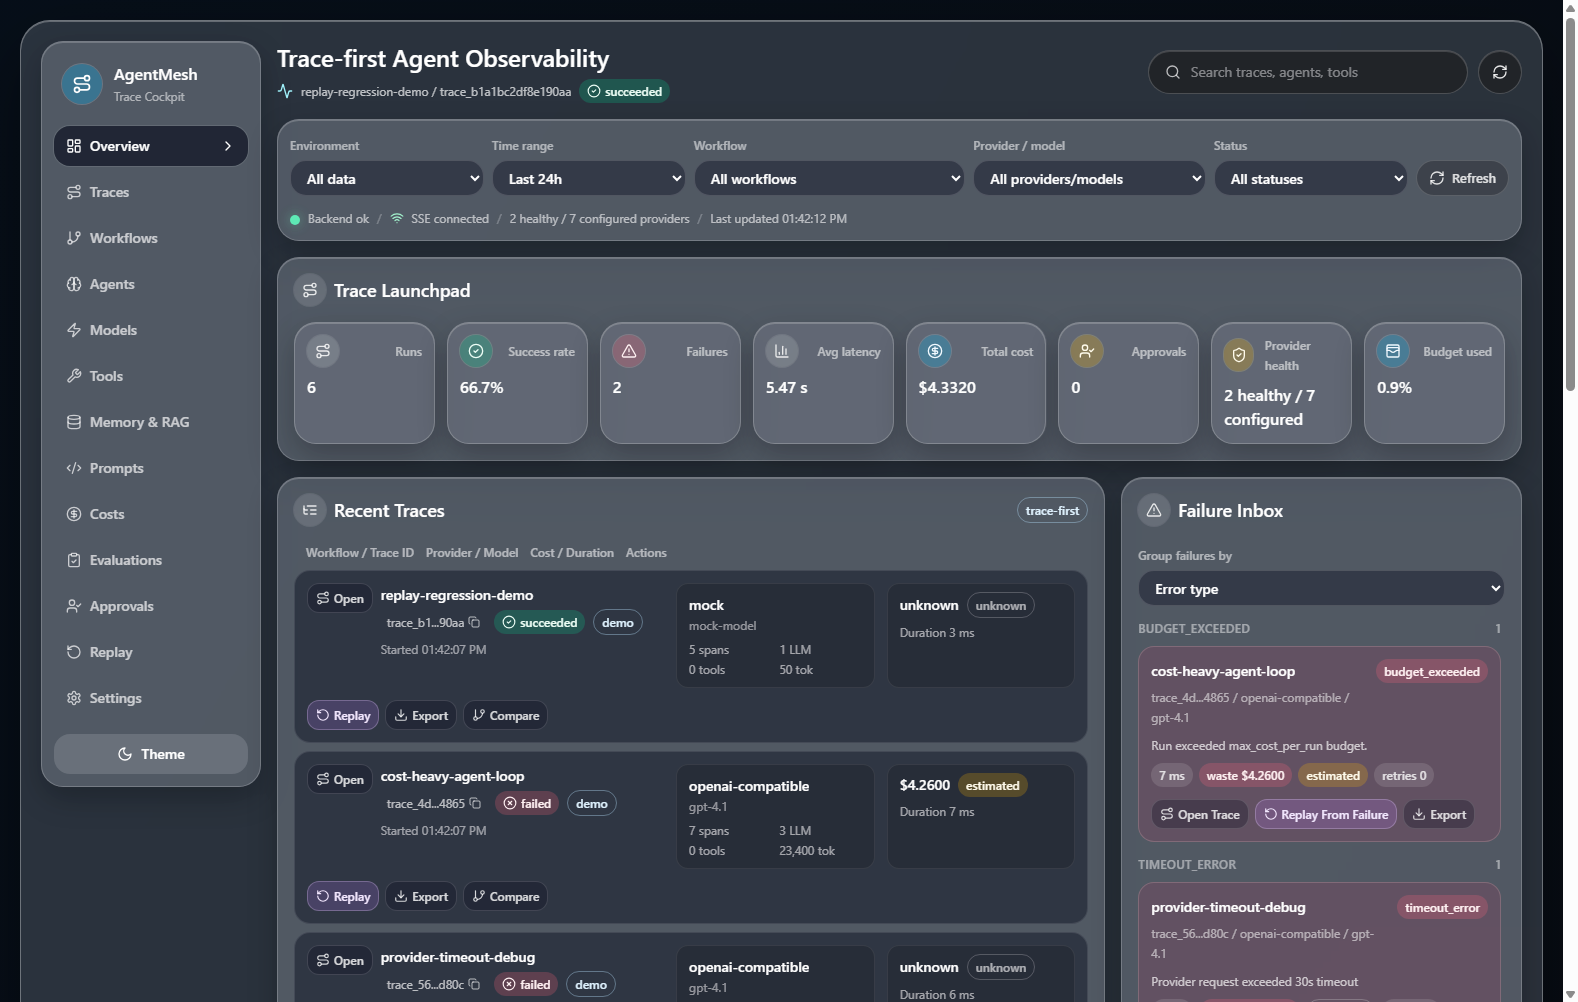 Overview — health, cost, recent traces, failure inbox |
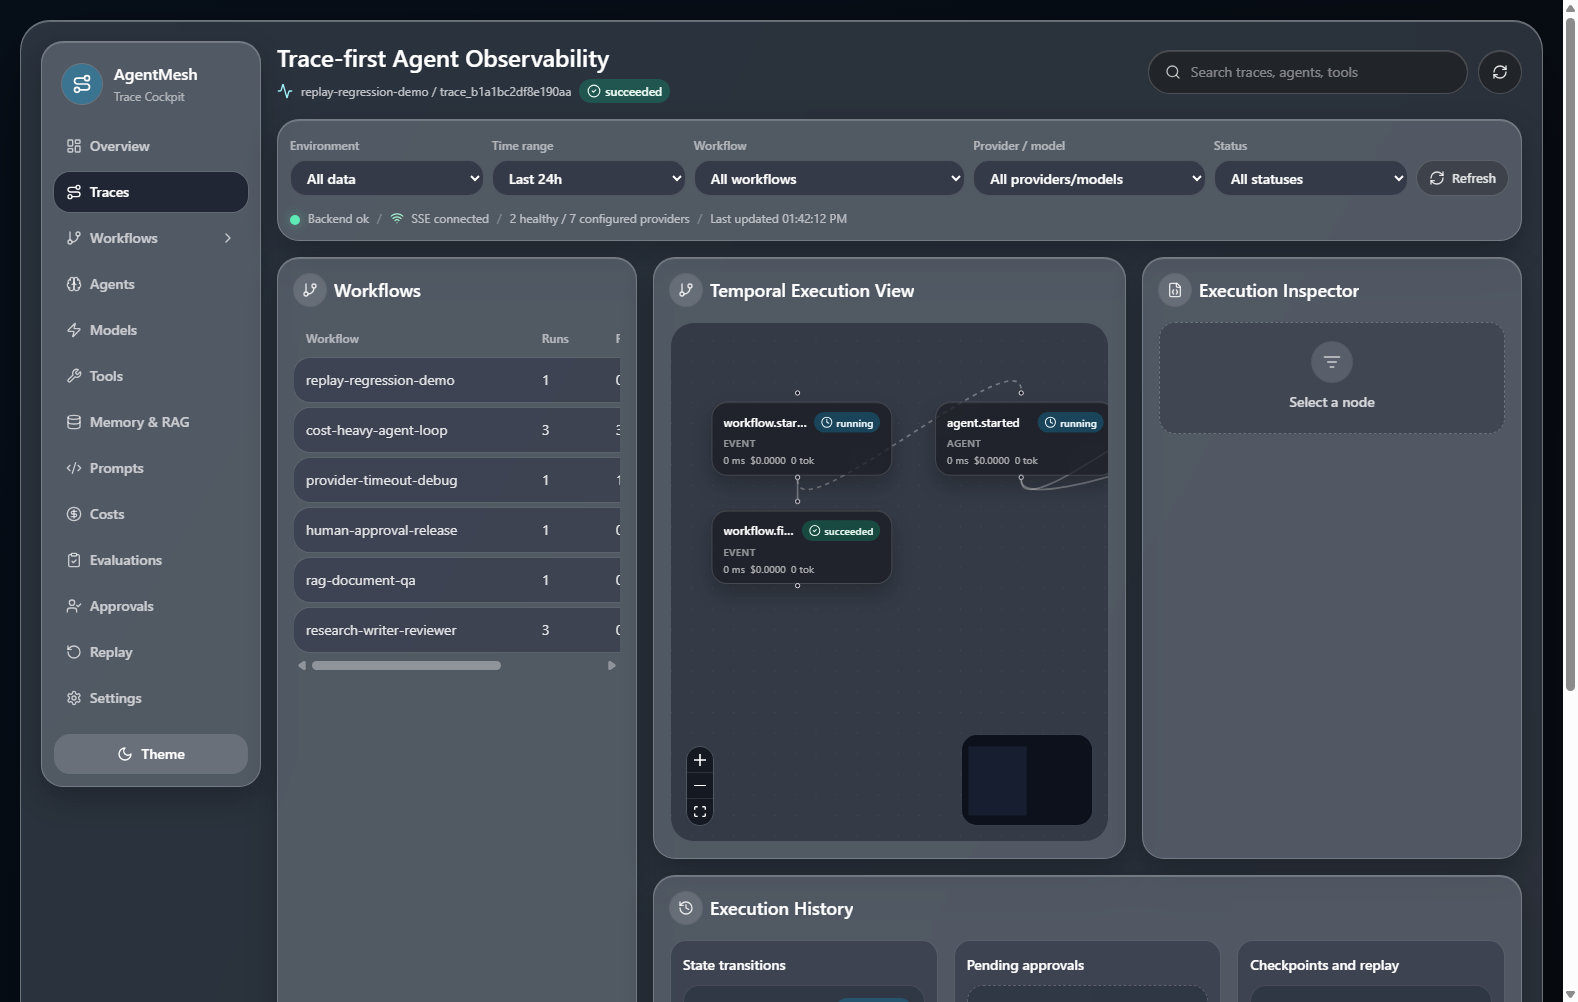 Workflow graph — agents, model calls, and tools as nodes |
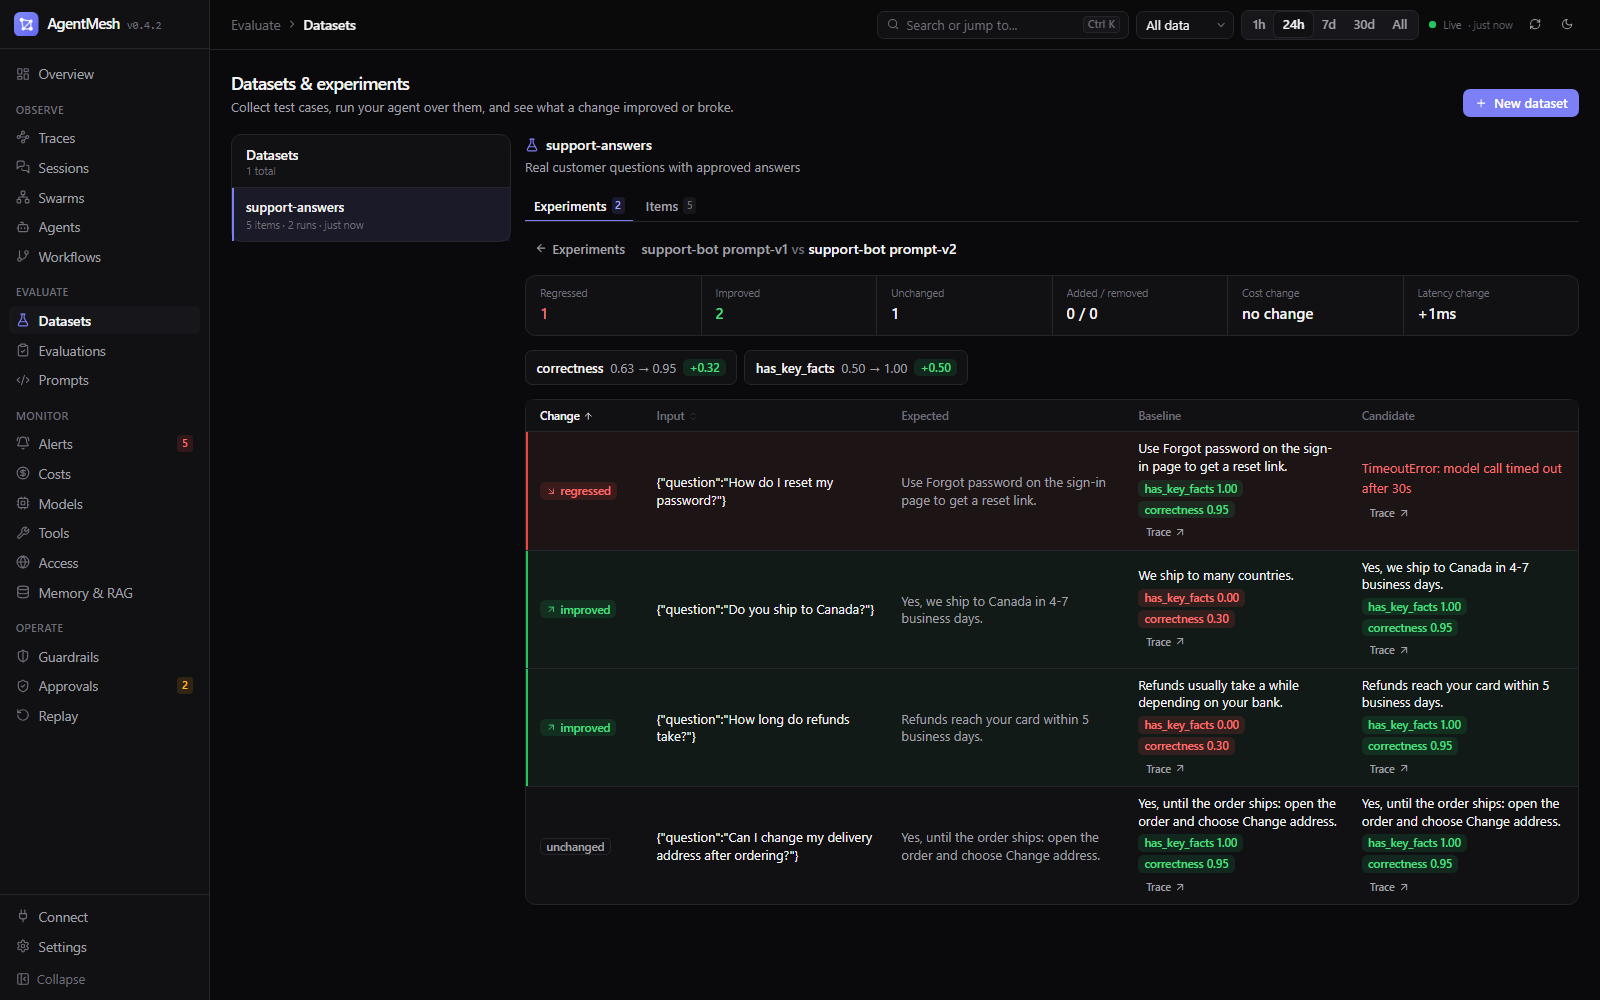 Experiments — what a change improved and what it broke |
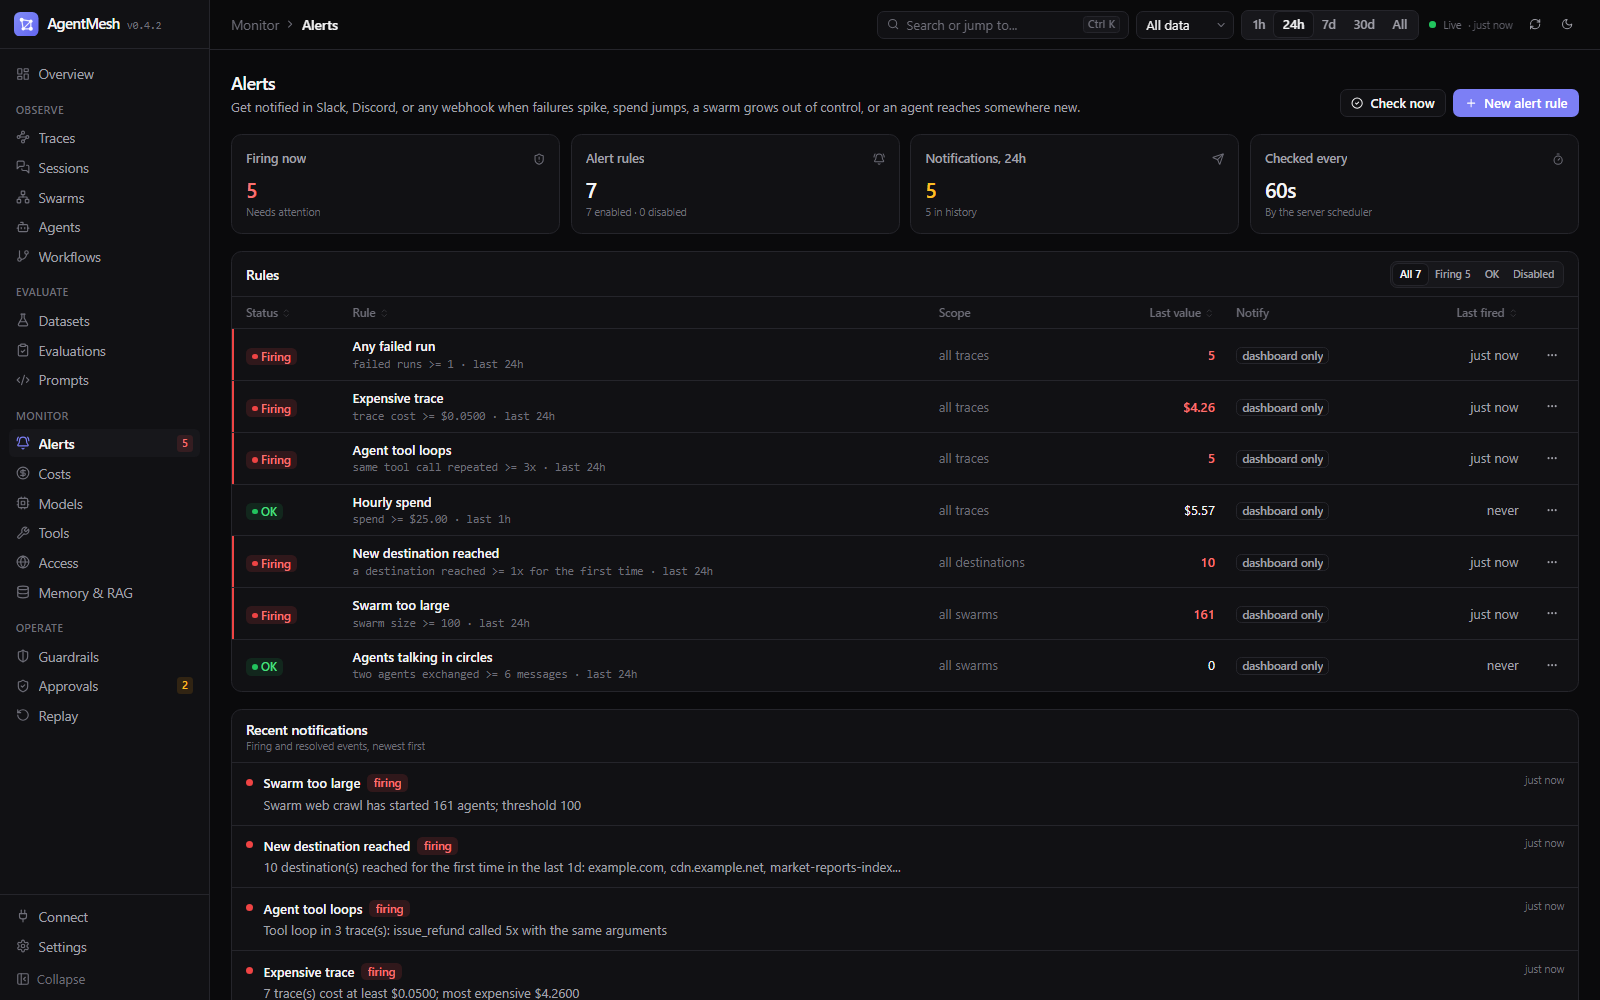 Alerts — failures, spend, and loops, to Slack or a webhook |
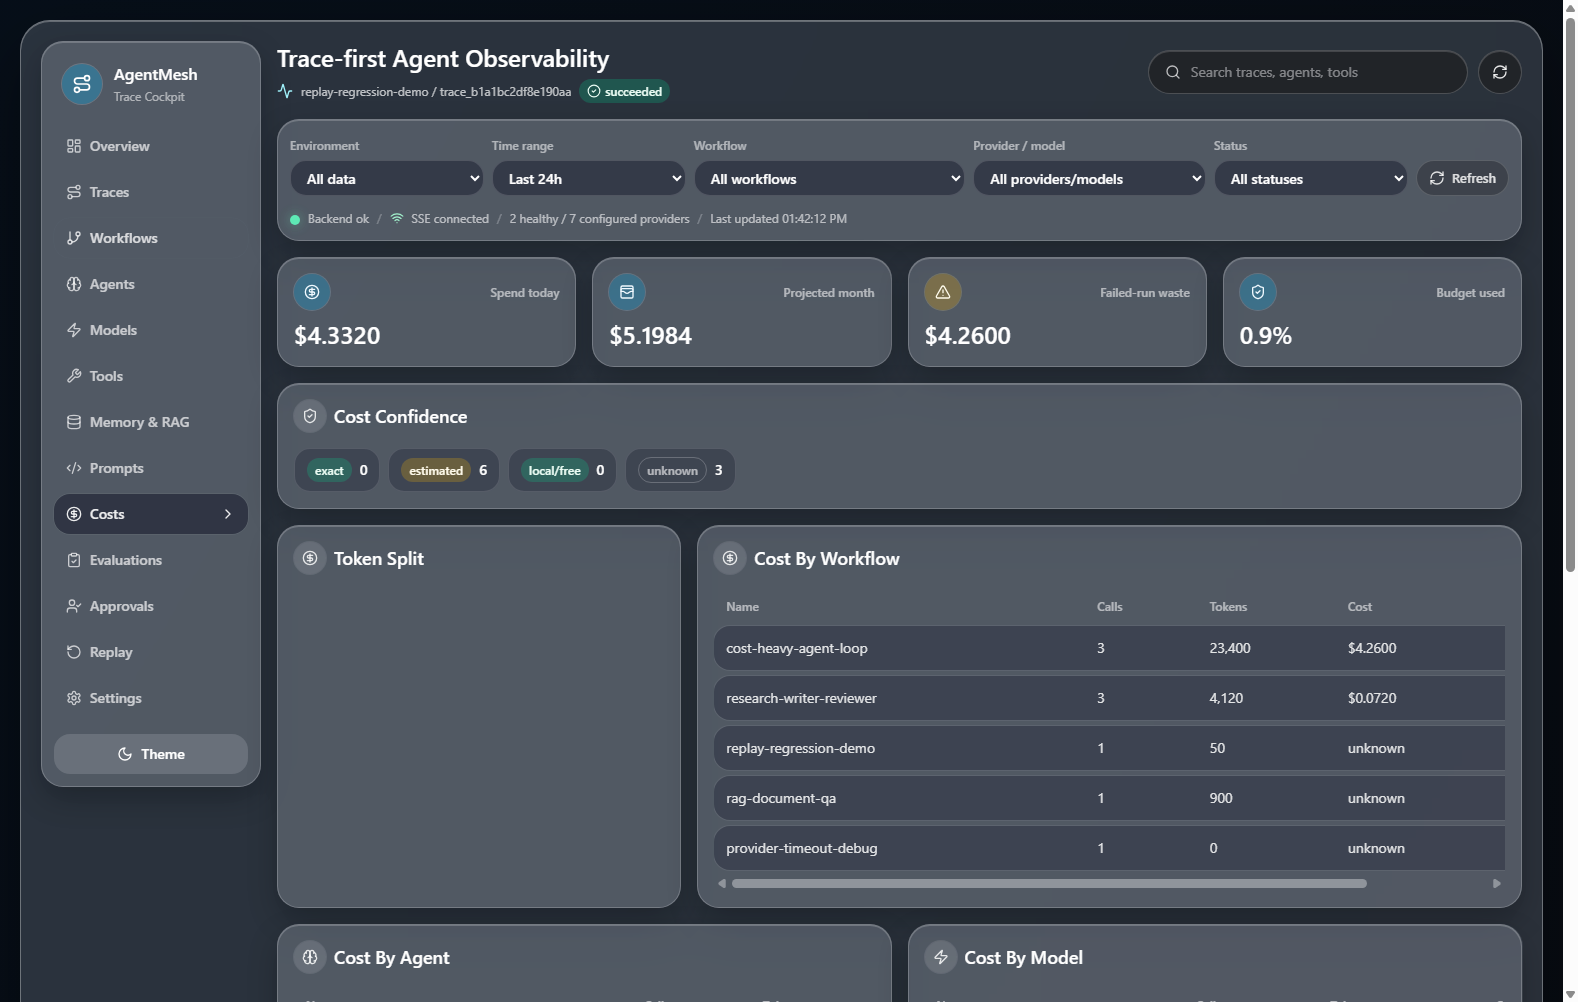 Costs — spend, failed-run waste, cost by workflow/model |
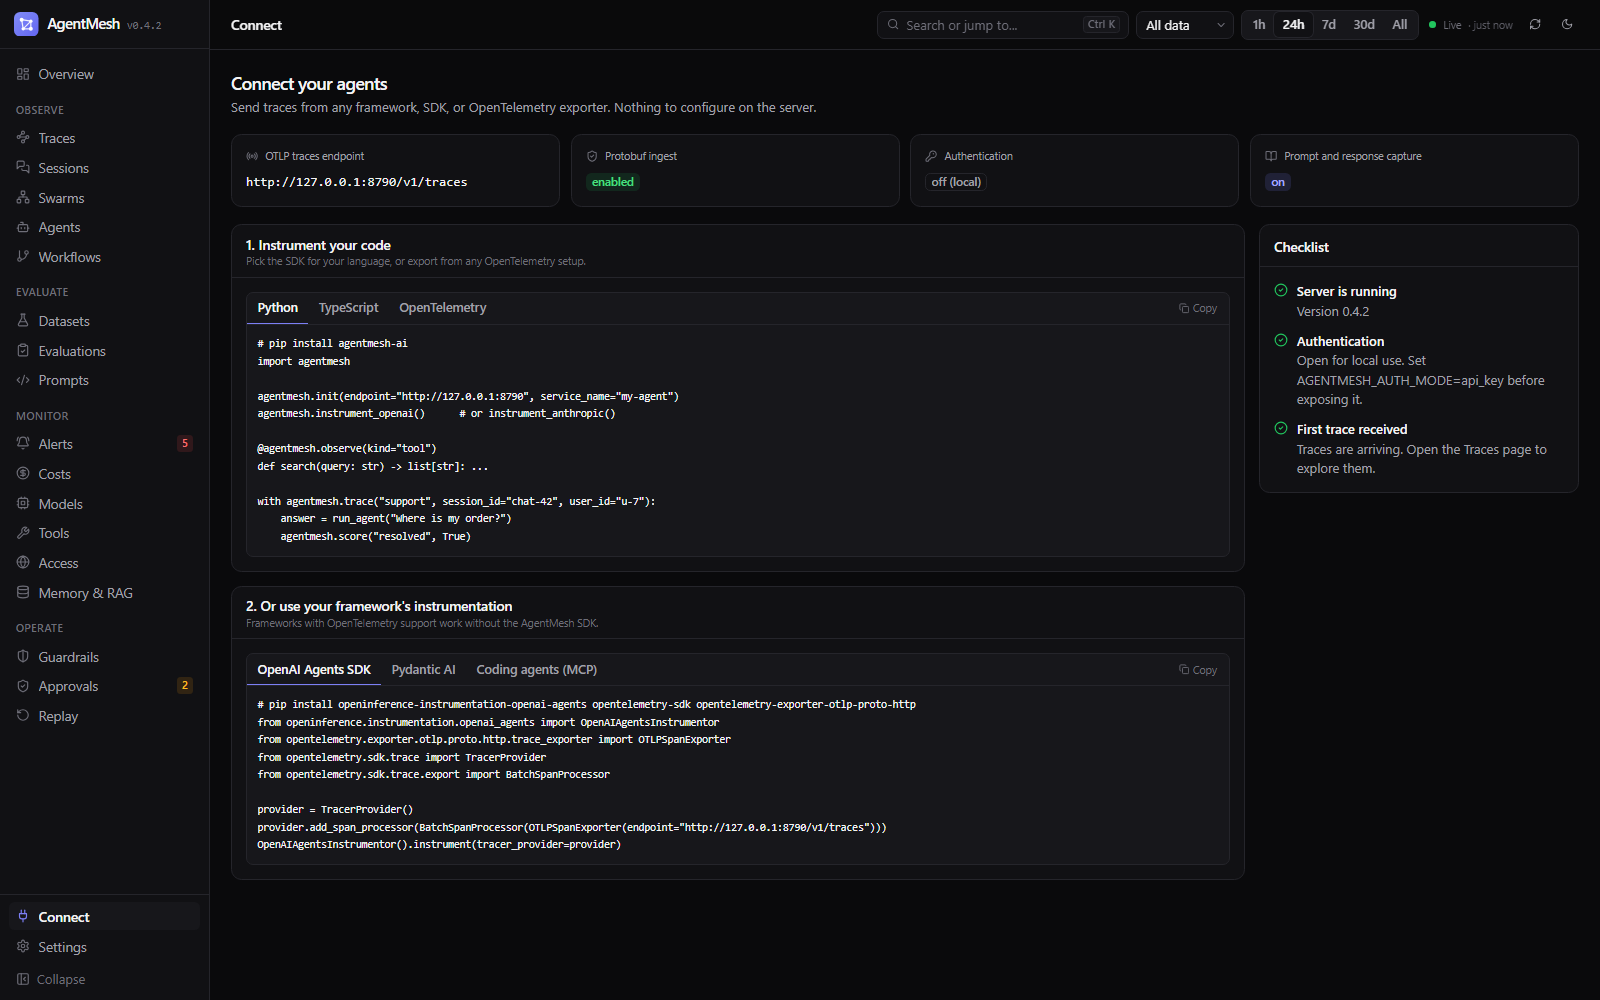 Connect — endpoint and copy-paste setup for your stack |
Architecture
AgentMesh
├── Ingestion         OTLP/HTTP receiver (JSON + protobuf), GenAI semconv / OpenInference / OpenLLMetry mapping
├── SDKs              Python and TypeScript: observe, trace, span, score, OpenAI + Anthropic auto-instrumentation
├── Analysis          Root cause, loop detection, context growth, cache usage, hotspots
├── Evaluation        Datasets, experiments, comparisons, built-in and LLM-as-judge evaluators
├── Alerts            Rule scheduler, Slack / Discord / signed webhook delivery
├── MCP Server        Traces as tools for coding agents
├── Core Runtime      Agents, Tasks, Workflows, Scheduler, Event Bus
├── Observability     Tracing, Metrics, Logs, Replay, Cost Tracking, OpenTelemetry
├── Tool Layer        MCP Proxy, Sandboxed Commands, Permissions, Human Approval
├── Memory Layer      Workflow Memory, Long-term Memory, Vector Store, Checkpoints
├── Model Providers   OpenAI-compatible, Ollama, Anthropic, Gemini, vLLM, Router
├── Dashboard         Workflow Graph, Trace Explorer, Cost Analytics, Replay Studio
└── SDK + CLI
Key components:
Workflow— schedules steps and owns the run context.WorkflowScheduler— executes sequential, parallel, dependency-aware, hierarchical, and event-driven workflows.Agent— receives typedAgentMessageobjects, executes tools, calls a model provider, returns anAgentResult.TraceRecorder— writes every event toSQLiteStoreorPostgreSQLStore(the same queries on both; see docs/configuration.md).ReplayEngine— reconstructs prompts, outputs, tools, agent interactions, memory state, and checkpoints.TimeTravelDebugger— inspects and forks workflow memory from checkpoints.FailedRunDiagnosis— classifies failed runs from retries, errors, and budget events.ToolRegistry— enforces permissions and optional human approval before execution.PluginManager— registers custom tools, model providers, agents, planners, and evaluators.
Technology Stack
| Layer | Implementation |
|---|---|
| Core | Python 3.11+ |
| API | FastAPI |
| Dashboard frontend | React 19 + TypeScript + TailwindCSS + Recharts + React Flow |
| Workflow engine | AsyncIO |
| Messaging | In-memory event bus; optional Redis and NATS adapters |
| Database | SQLite (default) or PostgreSQL 14+, with the same features on both |
| SDKs | Python; TypeScript/JavaScript (agentmesh-sdk, Node.js 18+) |
| Vector DB | FAISS adapter; SQLite vector fallback |
| Tracing | OTLP/HTTP ingestion (OpenTelemetry GenAI semantic conventions); OTEL JSON export |
| Packaging | pyproject.toml with uv-compatible dependency groups and extras |
| Testing | pytest (SQLite and PostgreSQL), node:test for the TypeScript SDK |
| Containerization | Dockerfile + Docker Compose |
Provider Support
| Provider | Status |
|---|---|
| Mock (deterministic tests/CI) | ✅ included |
OpenAI-compatible (/chat/completions) |
✅ included |
| Azure OpenAI | ✅ via OpenAICompatibleProvider |
| Anthropic Messages API | ✅ included |
| Google Gemini | ✅ included |
| Ollama (local models) | ✅ included |
| vLLM (OpenAI-compatible) | ✅ included |
| Custom provider | ✅ implement ModelProvider |
| Model router (cheap/local/coding routes) | ✅ included |
pip install -e ".[production]"   # all production adapters
pip install -e ".[postgres]"     # PostgreSQL only
pip install -e ".[redis]"        # Redis event bus
pip install -e ".[nats]"         # NATS event bus
pip install -e ".[faiss]"        # FAISS vector store
pip install -e ".[otel]"         # OpenTelemetry export
pip install -e ".[otlp]"         # accept OTLP protobuf on /v1/traces
Examples
Runnable examples covering all major features:
examples/
├── sdk_quickstart.py               # Trace plain Python with the SDK (offline)
├── datasets_experiments.py         # Traces -> dataset -> two versions -> comparison (offline)
├── otel_genai_export.py            # Standard OpenTelemetry GenAI spans -> AgentMesh
├── llm_client_auto_instrumentation.py  # instrument_openai() / instrument_anthropic()
├── hello_agent.py                  # Single-agent workflow
├── researcher_writer_reviewer.py   # 3-agent sequential pipeline
├── parallel_multi_agent.py         # Parallel execution
├── tool_calling_agent.py           # Agent with typed tools
├── rag_document_qa.py              # RAG with tracing
├── human_approval_workflow.py      # Approval gates
├── cost_budget_workflow.py         # Budget constraints
├── failed_run_debugging.py         # Failure diagnosis
├── time_travel_debugging.py        # Replay from checkpoint
├── multi_model_routing.py          # Dynamic provider routing
├── ollama_local_model.py           # Local LLM
├── openai_compatible_provider.py   # Generic OpenAI API
└── ...
sdks/typescript/examples/
├── quickstart.mjs                  # Trace a Node.js agent with sessions and scores
└── experiment.mjs                  # Run and grade an experiment from TypeScript
CLI
agentmesh init
agentmesh run examples/research_team.py
agentmesh dashboard                                   # also serves OTLP at /v1/traces
agentmesh mcp                                         # MCP server over stdio
agentmesh demo seed
agentmesh ingest trace.otlp.json                      # import an OTLP/JSON file
agentmesh sessions list
agentmesh sessions show <session_id>
agentmesh traces list
agentmesh traces show <trace_id>
agentmesh traces insights <trace_id>                  # root cause, loops, context growth, hotspots
agentmesh traces prune --older-than 30d [--dry-run]
agentmesh datasets import support-regressions items.jsonl
agentmesh datasets add-trace support-regressions <trace_id>
agentmesh experiments run --dataset support-regressions --task app.py:answer --evaluator exact_match --fail-under exact_match=0.9
agentmesh experiments compare <baseline_id> <candidate_id>
agentmesh alerts add --name "daily spend" --kind cost --threshold 50 --window 1d --webhook <url>
agentmesh alerts check                                # evaluate rules once (e.g. from cron)
agentmesh pricing show claude-sonnet-5
agentmesh pricing sync
agentmesh traces export <trace_id> --out trace.json
agentmesh traces export <trace_id> --format otel-json --out trace.otel.json
agentmesh replay <trace_id> --mode deterministic
agentmesh replay <trace_id> --mode simulated
agentmesh replay <trace_id> --mode live --allow-side-effects
agentmesh diagnose <trace_id>
agentmesh costs summary
agentmesh costs summary --dimension model
agentmesh checkpoints list <trace_id>
agentmesh checkpoints show <checkpoint_id>
agentmesh doctor
agentmesh validate traces
agentmesh version
Security Model
- Secrets (API keys, bearer tokens, private keys, credentials in URLs) are redacted before traces are stored, exported, or mirrored to a collector.
- Optional API-key auth (
AGENTMESH_AUTH_MODE=api_key) covers the dashboard, REST API, live event stream, WebSocket, and/v1/traces; the dashboard prompts for the key. AGENTMESH_CAPTURE_CONTENT=falsekeeps prompt/response text, tool arguments, and retrieval queries out of storage;/v1/tracesenforces a request size limit.- Tools declare permission levels (
READ,WRITE,EXECUTE,SENSITIVE), and sensitive tools can require human approval before execution. - Tool execution and memory writes create audit records;
agentmesh traces pruneenforces retention. - Alert webhooks can be signed (HMAC-SHA256), never follow redirects, and their URLs and secrets are masked in the API and dashboard.
See SECURITY.md for the full security policy and reporting instructions.
Project Status
v0.4.0 — alpha. Ingestion, SDK, dashboard, and runtime are ready for local development, evaluation, and single-team self-hosting.
Implemented: OTLP/HTTP trace ingestion with GenAI semantic-convention mapping, Python and TypeScript tracing SDKs, OpenAI and Anthropic auto-instrumentation, sessions/users/tags, scores and feedback, automatic trace insights, datasets, experiments and LLM-as-judge evaluators, alerts with Slack/Discord/webhook delivery, MCP server, per-MTok pricing with cache rates and community price sync, retention pruning, SQLite and PostgreSQL storage, React dashboard (trace explorer, sessions, datasets & evals, alerts, connect, workflow graph, cost center, tools, memory & RAG, replay studio), AgentMesh runtime, CLI, Docker, CI.
Partial: Dashboard auth is API-key only (no user accounts); the alert scheduler runs inside one server process; no gRPC OTLP receiver (use a Collector).
Planned: OTLP logs, ClickHouse for very high trace volumes, scheduled online evaluation on the server, more client auto-instrumentation, login and RBAC. See ROADMAP.md.
FAQ
Do I have to build my agent with AgentMesh?
No. Send OpenTelemetry traces from any framework, wrap your own code with @agentmesh.observe, or instrument the OpenAI/Anthropic clients. The runtime is optional.
Does my data leave my machine?
Not unless you send it somewhere. Traces go to a local SQLite file, the dashboard runs locally, and AgentMesh has no telemetry of its own. Set AGENTMESH_CAPTURE_CONTENT=false to keep prompt and response text out of storage entirely.
Is it really free? Yes, MIT licensed, with no paid tier or usage limits. You pay only your model providers.
How accurate are the costs?
Token counts come from the provider responses. Prices are list prices per million tokens, including prompt-cache read/write rates; agentmesh pricing show <model> tells you which rule applied, and agentmesh pricing sync refreshes prices for models not built in. Batch discounts and negotiated rates are not applied; override them with AGENTMESH_PRICING_JSON.
Can my team share one instance?
Yes: run it with AGENTMESH_AUTH_MODE=api_key and AGENTMESH_DB_URL=postgresql://... behind a TLS reverse proxy and point everyone's exporters at it. There are no per-user accounts yet.
How do I know a prompt or model change didn't make things worse?
Save representative traces to a dataset (Add to dataset on any trace), then run agentmesh.run_experiment (or agentmesh experiments run in CI) for the old and new version and compare them in Datasets & Evals. See docs/datasets-and-experiments.md.
My agents are in TypeScript. Does this work?
Yes. Use agentmesh-sdk from npm, or any OpenTelemetry exporter (the Vercel AI SDK's telemetry works as-is). See docs/typescript-sdk.md.
Contributing
Contributions are welcome. See CONTRIBUTING.md for setup instructions, development workflow, and contribution areas.
Good first issues are labeled good first issue in the issue tracker.
Documentation
| Document | What it covers |
|---|---|
| docs/integrations.md | Trace any framework over OpenTelemetry — recipes and attribute mapping |
| docs/sdk.md | Python SDK and OpenAI/Anthropic auto-instrumentation |
| docs/typescript-sdk.md | TypeScript/JavaScript SDK (agentmesh-sdk) |
| docs/datasets-and-experiments.md | Datasets, experiments, evaluators, LLM-as-judge, CI gating |
| docs/alerts.md | Alert rules and Slack / Discord / webhook notifications |
| docs/mcp.md | MCP server for Claude Code, Cursor, and other MCP clients |
| Setup.md | Full setup guide — providers, Docker, PostgreSQL, troubleshooting |
| HOW_IT_WORKS.md | Deep dive — architecture, sequence diagrams, data flow, use cases |
| ROADMAP.md | Planned milestones — v0.4, v0.5, v1.0 |
| CONTRIBUTING.md | How to contribute — setup, dev principles, adding providers |
| docs/ | Reference docs — agents, tools, memory, CLI, dashboard, OTEL |
Community
- GitHub Discussions — questions, ideas, show and tell
- GitHub Issues — bug reports and feature requests
- CONTRIBUTING.md — how to contribute
If AgentMesh is useful to you, a ⭐ on GitHub helps others find it.
License
MIT. See LICENSE.
1 maintainer

Metadata
1 maintainer
Release files for agentmesh-ai 0.4.0
For a detailed explanation of source distributions (sdists) and built distributions (wheels), please see the package formats documentation.
Source distribution (sdist)
| File | Size | Uploaded | |
|---|---|---|---|
| agentmesh_ai-0.4.0.tar.gz | 502.5 kB | Details |
Built distribution (wheel)
| File | Interpreter | ABI | Platform | Reset |
|---|---|---|---|---|
| agentmesh_ai-0.4.0-py3-none-any.whl | Python 3 | none | any | Details |
Total release size: 979.8 kB
Release files / agentmesh_ai-0.4.0.tar.gz
| Download URL | agentmesh_ai-0.4.0.tar.gz |
|---|---|
| Size | 502.5 kB |
| Tags | Source |
|
SHA-256 checksum How to use checksums |
e7c5eb21d563222d9070ad04774adf0dfa8492a40e035a4a4e8706b18c7dd69b
|
|
BLAKE2b-256 checksum How to use checksums |
7285752f37e9ca4e8f24eec1fecb891457c66f6a2cb29e8e4094b0d341f68f88
|
| Upload date | |
|
Uploaded using Trusted Publishing? What is trusted publishing? |
Yes |
| Uploaded via |
twine/7.0.0 CPython/3.13.14
|
Provenance
Provenance describes where a file came from. On PyPI, provenance is shared via attestations, which provide a verifiable record of the build or publishing details. View details, limitations and caveats.


PyPI Publish Attestation
PyPI verified that this artifact, at this checksum, originated from the publisher listed below.
Signed by GitHub Actions, verified by PyPI on Sep 15, 2026.
Transparency logRelease files / agentmesh_ai-0.4.0-py3-none-any.whl
| Download URL | agentmesh_ai-0.4.0-py3-none-any.whl |
|---|---|
| Size | 477.3 kB |
| Tags | Python 3 |
|
SHA-256 checksum How to use checksums |
58cf8705dae30844f5a07d263d155f8881e28fb0815d0bfea4c2a64e5051208d
|
|
BLAKE2b-256 checksum How to use checksums |
923a183344681528f239950a8f9944adc6b8e4a25d4e810a7f59c06efd5f2c52
|
| Upload date | |
|
Uploaded using Trusted Publishing? What is trusted publishing? |
Yes |
| Uploaded via |
twine/7.0.0 CPython/3.13.14
|
Provenance
Provenance describes where a file came from. On PyPI, provenance is shared via attestations, which provide a verifiable record of the build or publishing details. View details, limitations and caveats.
PyPI Publish Attestation
PyPI verified that this artifact, at this checksum, originated from the publisher listed below.
Signed by GitHub Actions, verified by PyPI on Sep 15, 2026.
Transparency log













