A machine learning figure generation library

Project description
AI Figures
Purpose
AIFIG is a python library for generating figures of machine learning models.
The libary allows you to generate figures such as the following, which may be useful for use in presentations, papers etc.
AIFIG is a refactored version of some of my personal code. Functionality will naturally be limited and not suited for every use. I encourage anyone who is interested to contribute with additional features.
If you use AIFIG in a paper, you can cite the library like this (bibtex):
@misc{aifig,
  author = {Sigve Rokenes},
  title = {AI-FIG},
  year = {2019},
  publisher = {GitHub},
  journal = {GitHub repository},
  howpublished = {\url{https://github.com/evgiz/aifig}}
}
Install
AI-FIG library with svg export:
pip install aifig
If you need to export as png or pdf:
pip install svglib
Usage
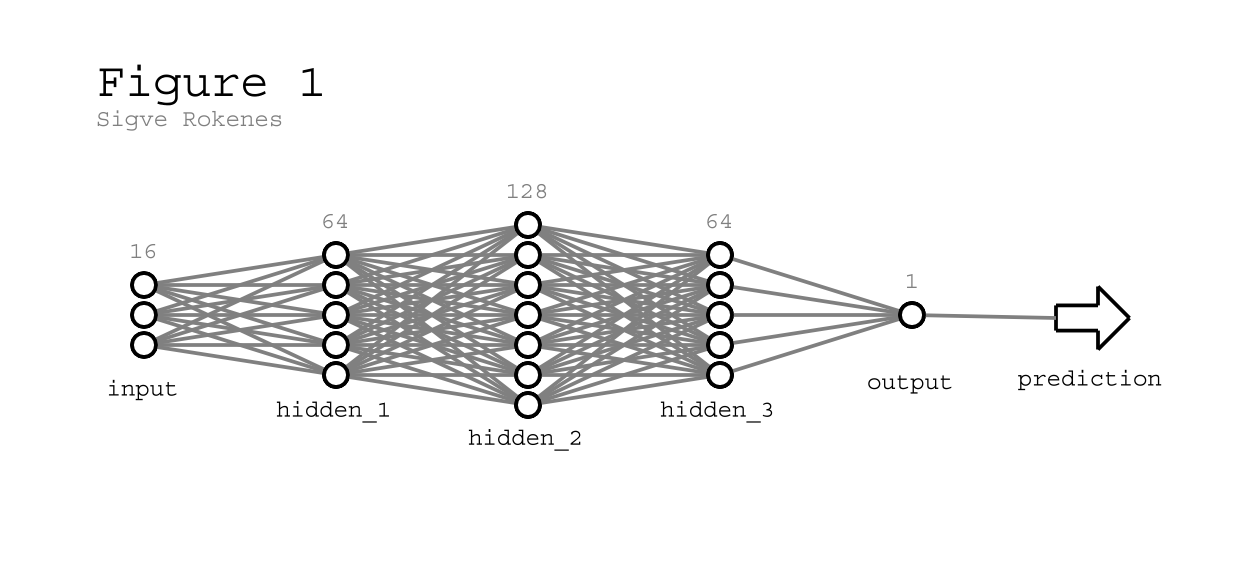
Simple example
# Import library
import aifig

# Create new figure, title and author is optional
my_figure = aifig.figure("Figure 1", "Sigve Rokenes")

# Figures consist of graphs (eg. each network in a model)
my_graph = aifig.graph("gen")

# Graphs contain elements (inputs, outputs, layers)
my_graph.add(aifig.dense("input", 16))
my_graph.add(aifig.dense("hidden_1", 64))
my_graph.add(aifig.dense("hidden_2", 128))
my_graph.add(aifig.dense("hidden_3", 64))
my_graph.add(aifig.dense("output", 1))
my_graph.add(aifig.arrow("prediction"))

# Add the graph to the figure at position (0,0)
my_figure.add(graph, 0, 0)

# Save the figure
my_figure.save_png("my_figure.png", scale=1)
my_figure.save_svg("my_figure.svg")
my_figure.save_pdf("my_figure.pdf")
The above code generates this figure:
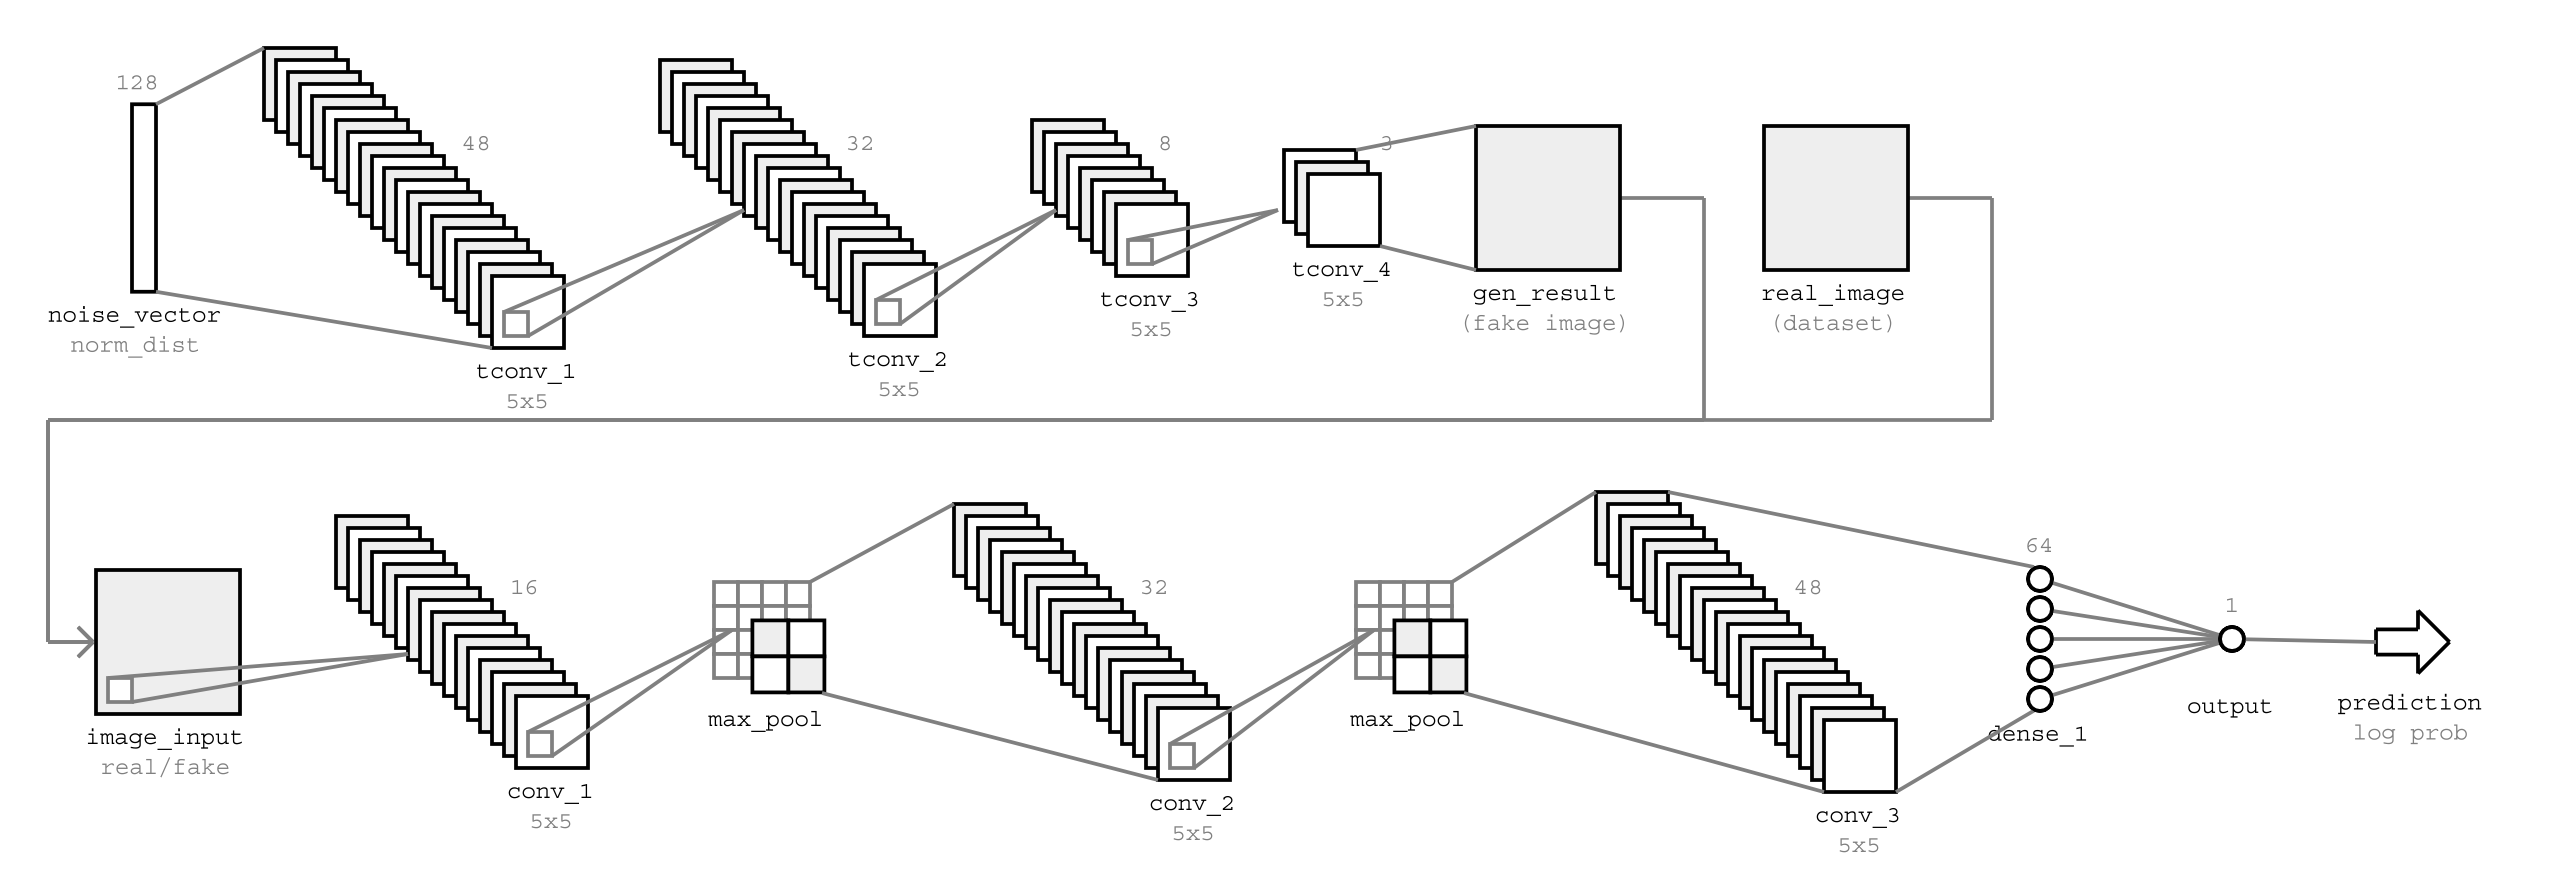
Multi-graph example (GAN model)
import aifig
figure = aifig.figure()

# Define generator network
generator_elements = [
  aifig.dense("noise_vector", 128, comment="norm_dist", simple=True),
  aifig.conv("tconv_1", 48, comment="5x5"),
  aifig.conv("tconv_2", 32, comment="5x5"),
  aifig.conv("tconv_3", 8, comment="5x5"),
  aifig.conv("tconv_4", 3, comment="5x5"),
  aifig.image("gen_result", comment="(fake image)")
]

# Define discriminator network
discriminator_elements = [
  aifig.image("image_input", comment="real/fake"),
  aifig.conv("conv_1", 16, comment="5x5"),
  aifig.pool("max_pool")
  aifig.conv("conv_2", 32, comment="5x5"),
  aifig.pool("max_pool"),
  aifig.conv("conv_3", 48, comment="5x5"),
  aifig.dense("dense_1", 64),
  aifig.dense("output", 1),
  aifig.arrow("prediction", comment="log prob")
]

# Create graphs with elements
gen_graph = aifig.graph("gen", generator_elements)
dsc_graph = aifig.graph("dsc", discriminator_elements)
dat_graph = aifig.graph("dat", [aifig.image("real_image", comment="(dataset)")])

# Add graphs to figure
figure.add(gen_graph, 0, 0)
figure.add(dat_graph, 1, 0)
figure.add(dsc_graph, 0, 1)

# Connect inputs to discriminator network
figure.connect("gen", "dsc")
figure.connect("dat", "dsc")

# Save figure as png
figure.save_png("gan.png")
This code generates the following figure:
API
A figure consists of one or more graphs. These graphs are placed in a grid using figure.add(graph, x, y). You can add elements to graphs using mygraph.add(element), and you can connect graphs with arrows using figure.connect("graph_name1", "graph_name2"). Finally, to save a figure, use my_figure.save_svg("fig.svg") or variants for different formats.
# ===================== #
#        Figure         #
# ===================== #
#  title			figure title
#  author			figure author
my_figure = aifig.figure()

# figure.add
#  graph			graph to add
#  x				x position in grid
#  y				y position in grid
my_figure.add(graph, 0, 0)

# figure.connect
#  from				name of first graph
#  to				name of second graph
#  position			grid position of arrow, use this if
#				different arrows overlap
#  offset			arrow offset in units, useful to
#				distinguish different arrows at same position
my_figure.connect("graph1", "graph2")

# figure.save (path)
#  path				file path to save to
#  scale			upscale (png only)
#  debug			enable debug draw mode
my_figure.save_png("my_figure.png", scale=1)
my_figure.save_svg("my_figure.svg")
my_figure.save_pdf("my_figure.pdf")

# ===================== #
#         Graph         #
# ===================== #
# 	name			(required)
# 	elements		[list of elements]
# 	spacing			(between elements, default 32)

my_graph = aifig.graph("graph_name")
my_graph.add(element)

# ===================== #
#    Layer elements     #
# ===================== #
# 	label			text label, use None to hide
# 	size			size of layer (nodes, filters)
#	comment			additional comment text
#	size_label		set to False to hide size label
#	simple			(dense only) set True to render as simple rectangle

dense = aifig.dense()		# Dense (fully connected)
conv  = aifig.conv()		# Convolutional layer

# ===================== #
#    Simple elements    #
# ===================== #
#	label			text label, use None to hide
#	comment			additional comment text

pool  = aifig.pool()		# Pooling layer
image = aifig.image()		# Image (usually input)
arrow = aifig.arrow()		# Arrow

# ===================== #
#    Special elements   #
# ===================== #
# 	width			width of padding (use negative to reduce)

padding = aifig.padding(10)
Dependencies
- svgwrite
- svglib (only to save as pdf/png)
- reportlab (only to save as pdf/png)
Release history Release notifications | RSS feed


Download files
Download the file for your platform. If you're not sure which to choose, learn more about installing packages.
Source Distribution
Built Distribution
Filter files by name, interpreter, ABI, and platform.
If you're not sure about the file name format, learn more about wheel file names.
Copy a direct link to the current filters
File details
Details for the file aifig-0.1.7.tar.gz.
File metadata
- Download URL: aifig-0.1.7.tar.gz
- Upload date:
- Size: 10.9 kB
- Tags: Source
- Uploaded using Trusted Publishing? No
- Uploaded via: twine/3.3.0 pkginfo/1.7.0 requests/2.25.0 setuptools/49.2.0 requests-toolbelt/0.9.1 tqdm/4.56.0 CPython/3.8.5
File hashes
| Algorithm | Hash digest | |
|---|---|---|
| SHA256 |
324607581e3c923f47ff93cacf35e3a225ab3a5f200dd4caebfda645db691f79
|
|
| MD5 |
93f142fb5c9dce4224ee489ee7186ea1
|
|
| BLAKE2b-256 |
d87828d5ab0beb810e610033527e33b9a644e549f88504b553d80103d9dd9f73
|
File details
Details for the file aifig-0.1.7-py3-none-any.whl.
File metadata
- Download URL: aifig-0.1.7-py3-none-any.whl
- Upload date:
- Size: 9.8 kB
- Tags: Python 3
- Uploaded using Trusted Publishing? No
- Uploaded via: twine/3.3.0 pkginfo/1.7.0 requests/2.25.0 setuptools/49.2.0 requests-toolbelt/0.9.1 tqdm/4.56.0 CPython/3.8.5
File hashes
| Algorithm | Hash digest | |
|---|---|---|
| SHA256 |
9cfc8d6e8c991d28ff670b114601353b25e49612fd33be44f087ed93d05ad48e
|
|
| MD5 |
96d7d18911591a28c0a99c318b5a11f1
|
|
| BLAKE2b-256 |
164a1cb518f782aa6bb8a027092c09c792996f14aca23b7364fb64457e22b941
|


