Automatic classification of tertiary bronchi based on bronchus masks using a rule-based approach.
Project description
Airway
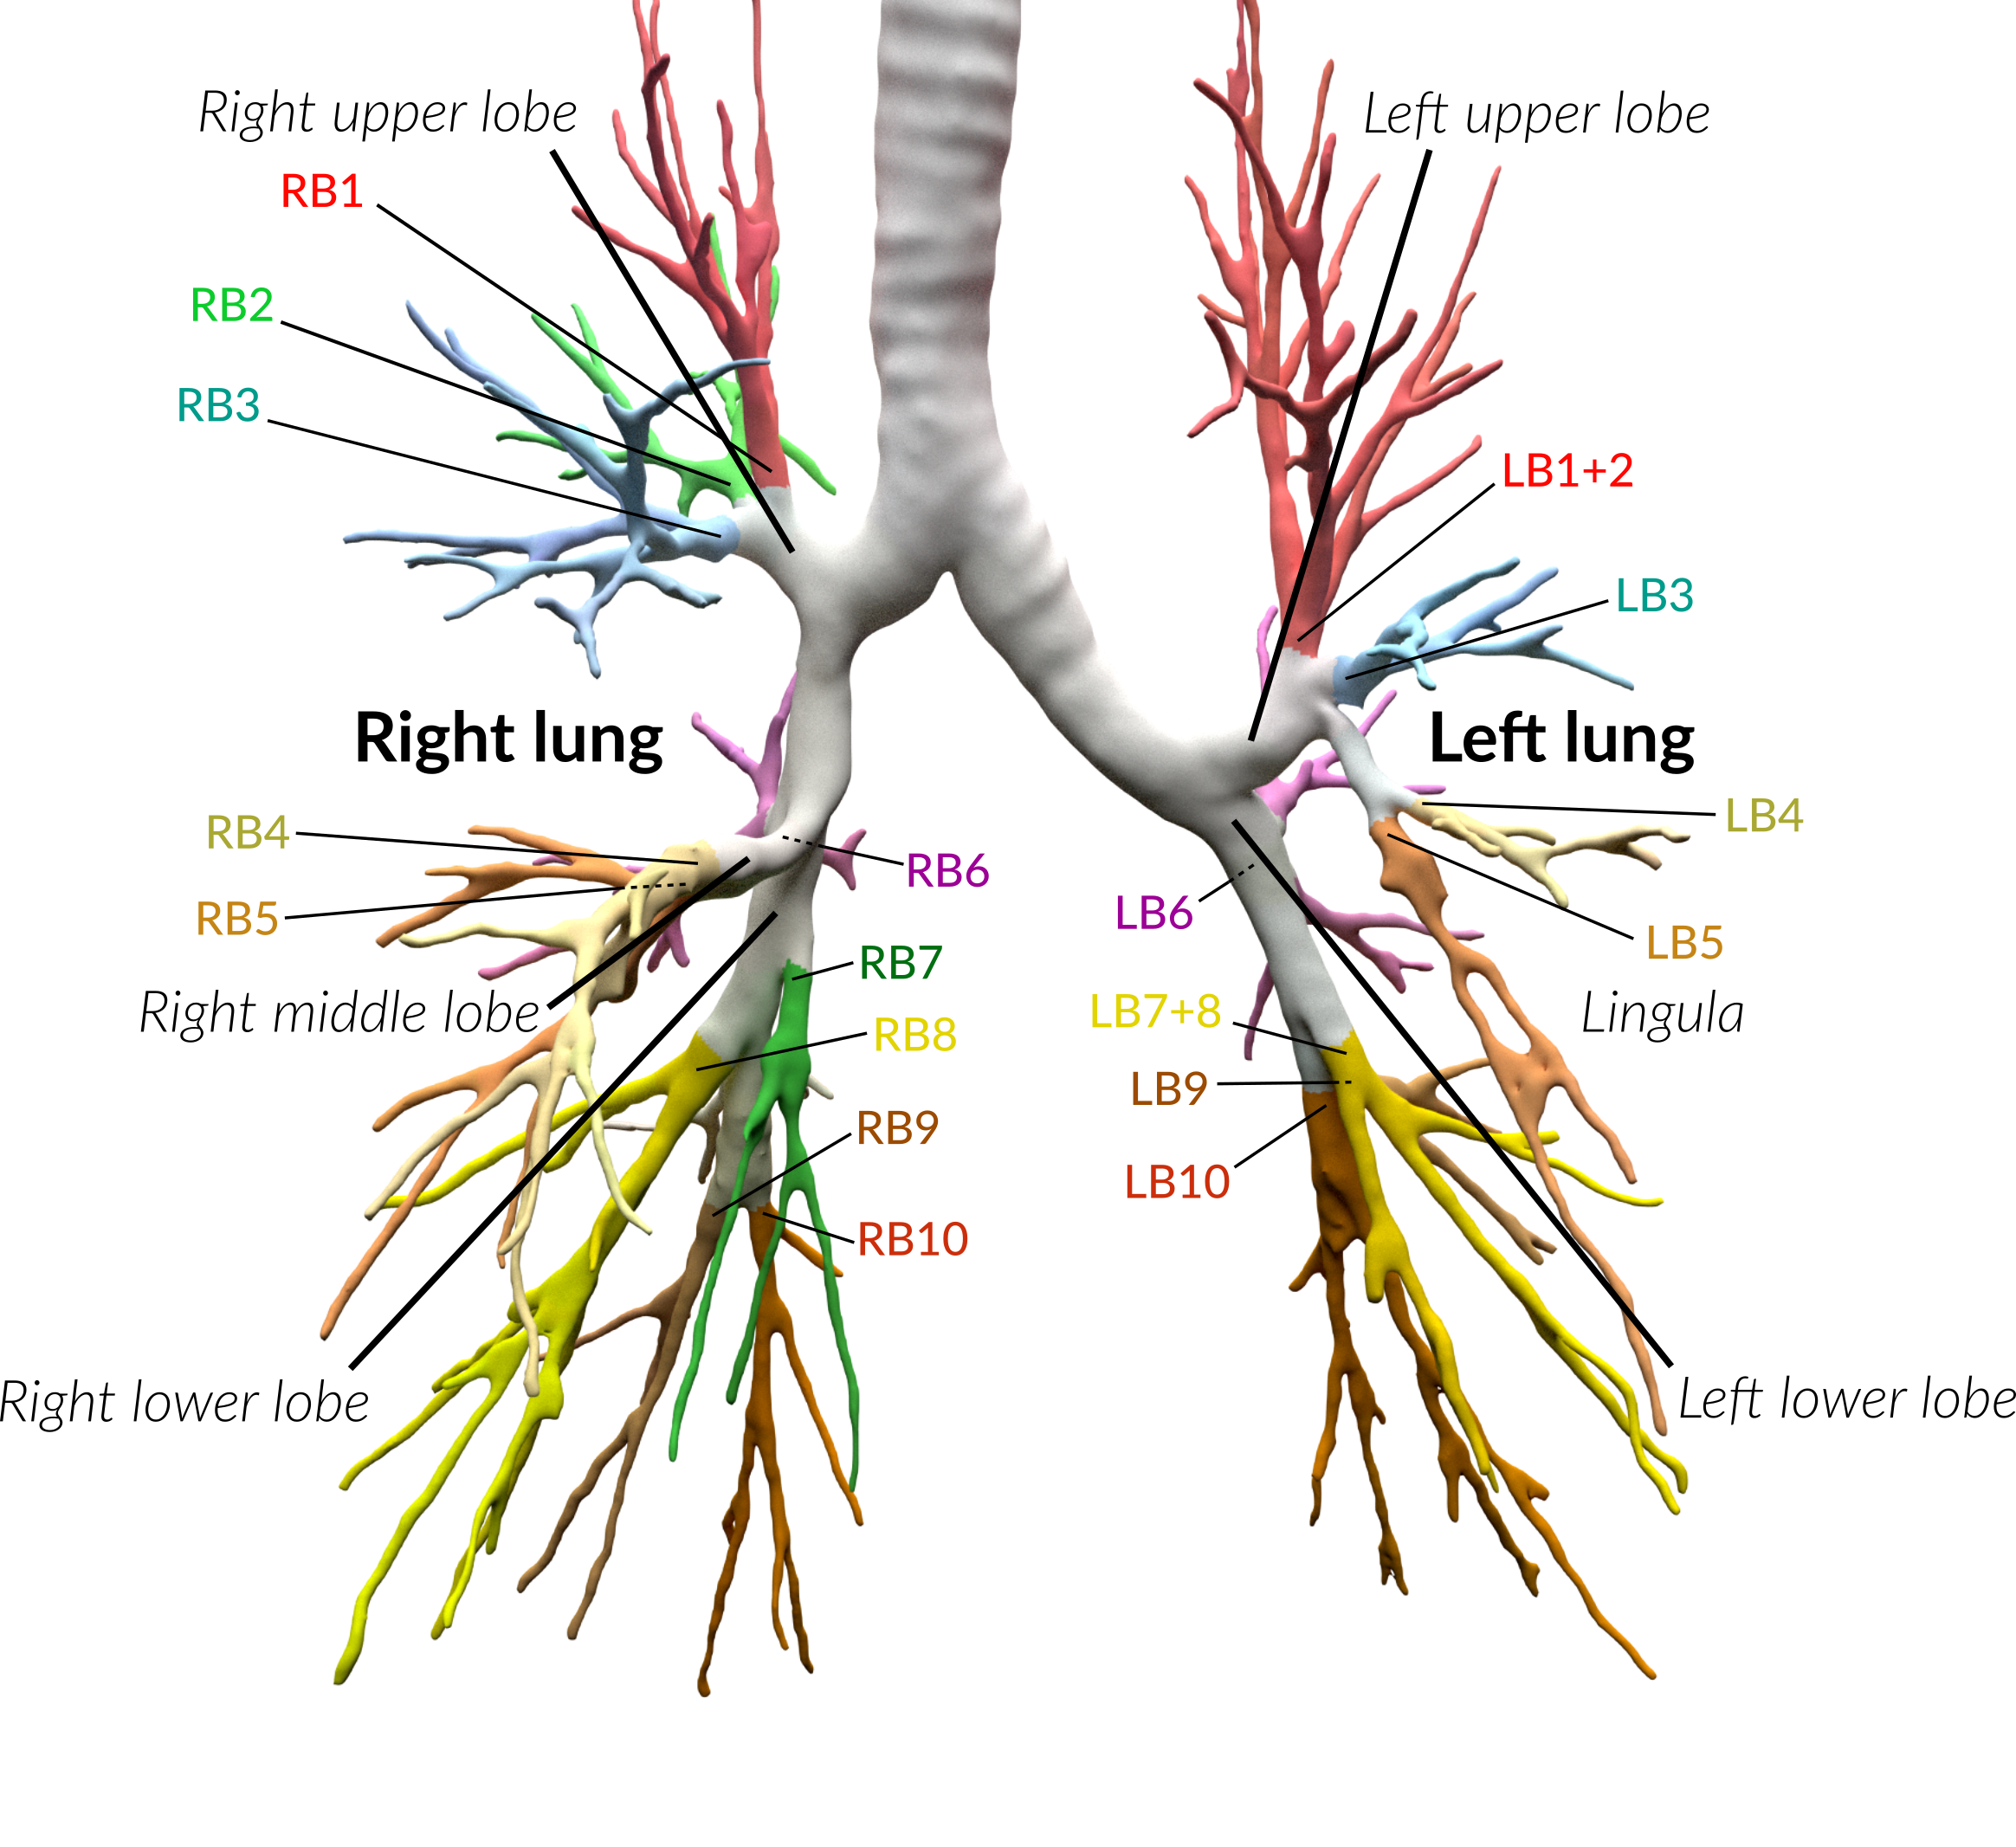
Anatomical classification of human lung bronchus up to segmental/tertiary bronchi based on high-resolution computed tomography (HRCT) image masks. A rule-based approach is taken for classification, where the most cost-effective tree is found according to their angle deviations by defined vectors.
Here, a pipeline is implemented which, given a formatted input data structure, can create the anatomical segmentations, clusters of similar anatomy, and the visualisations presented below.
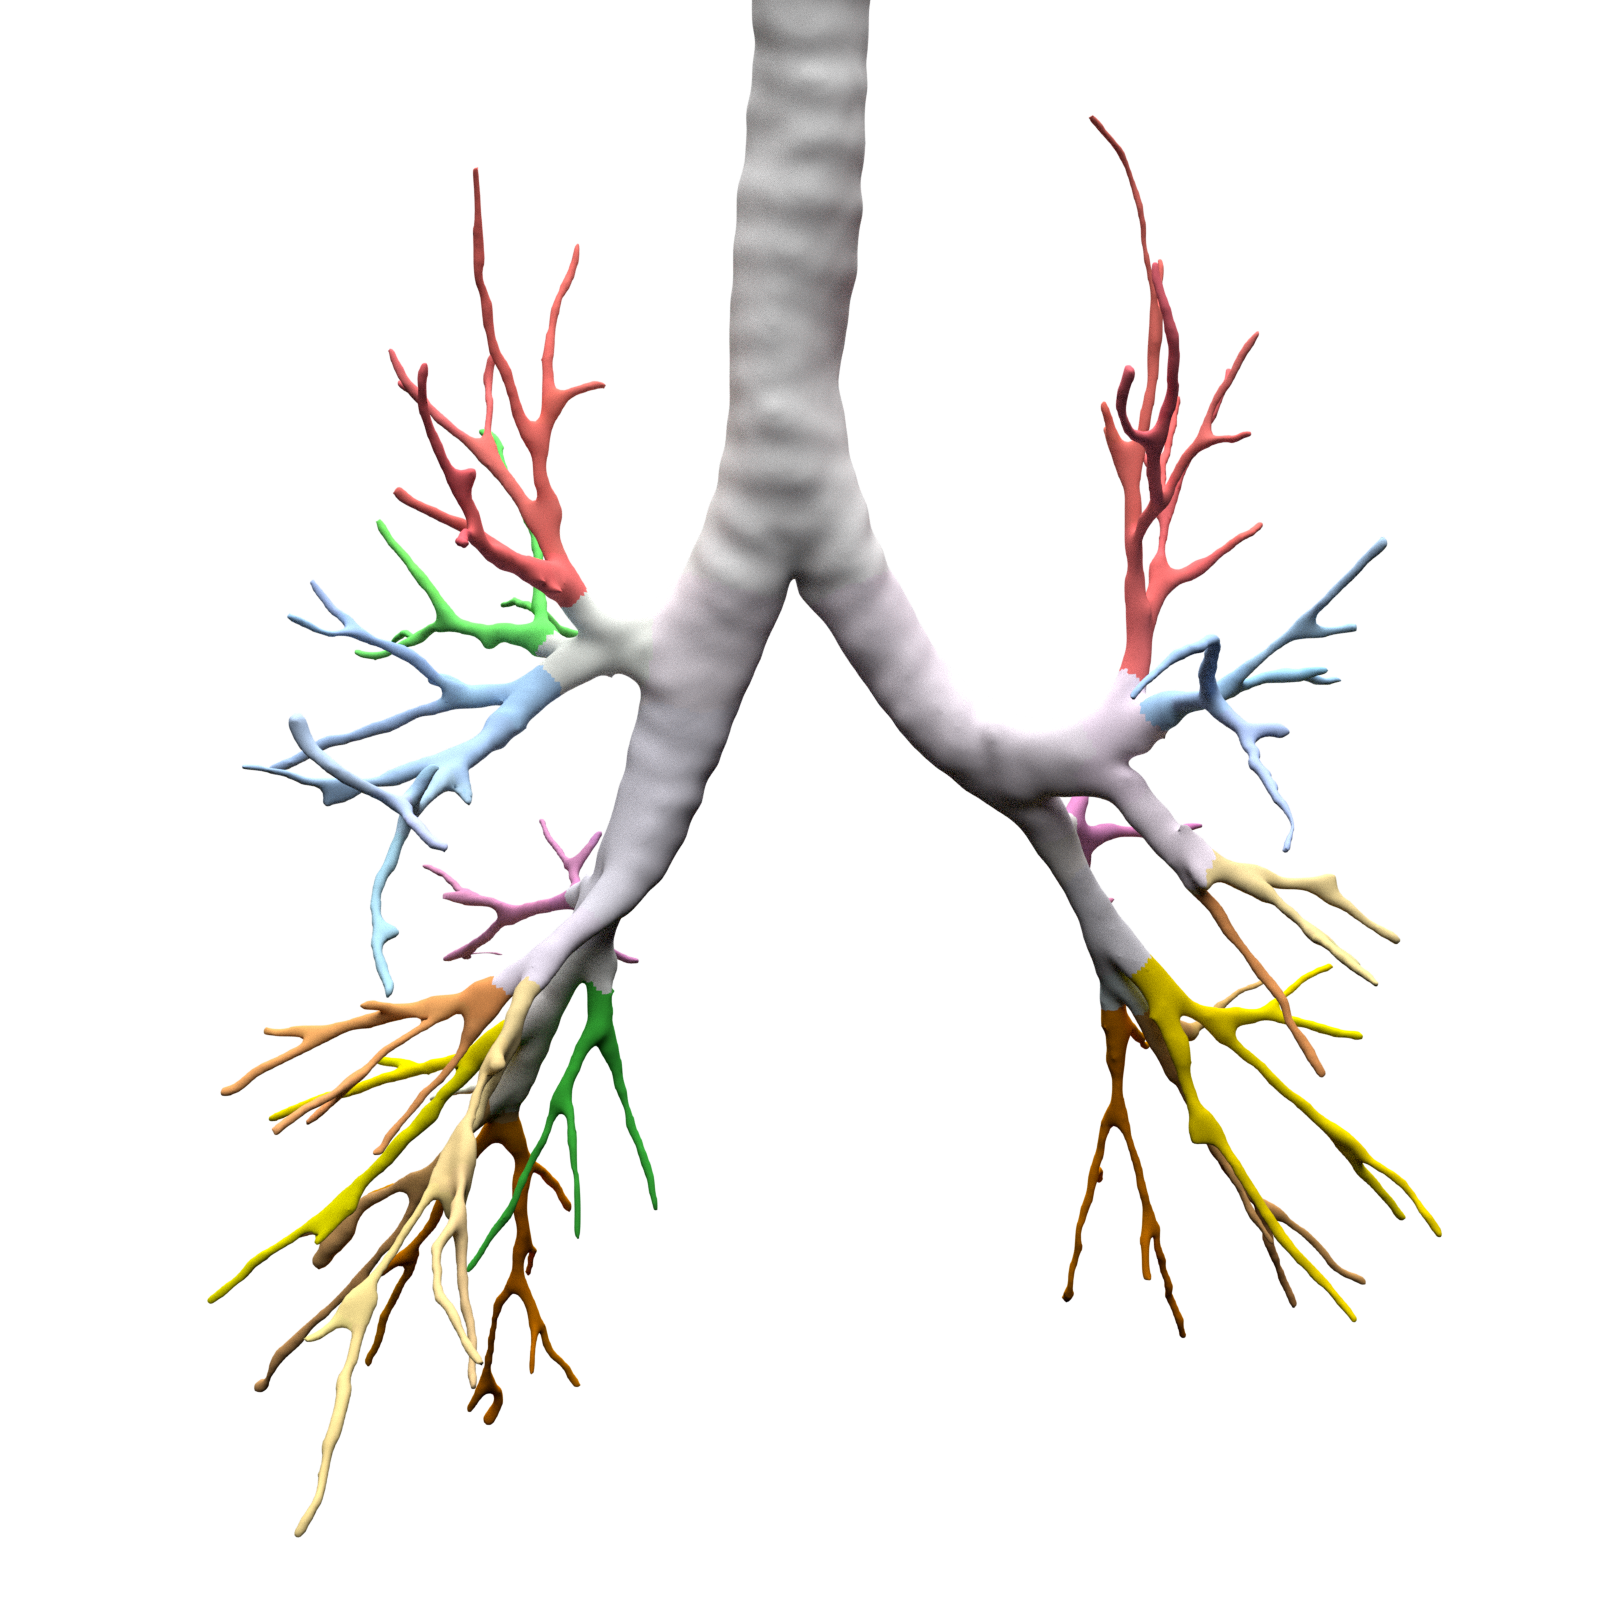
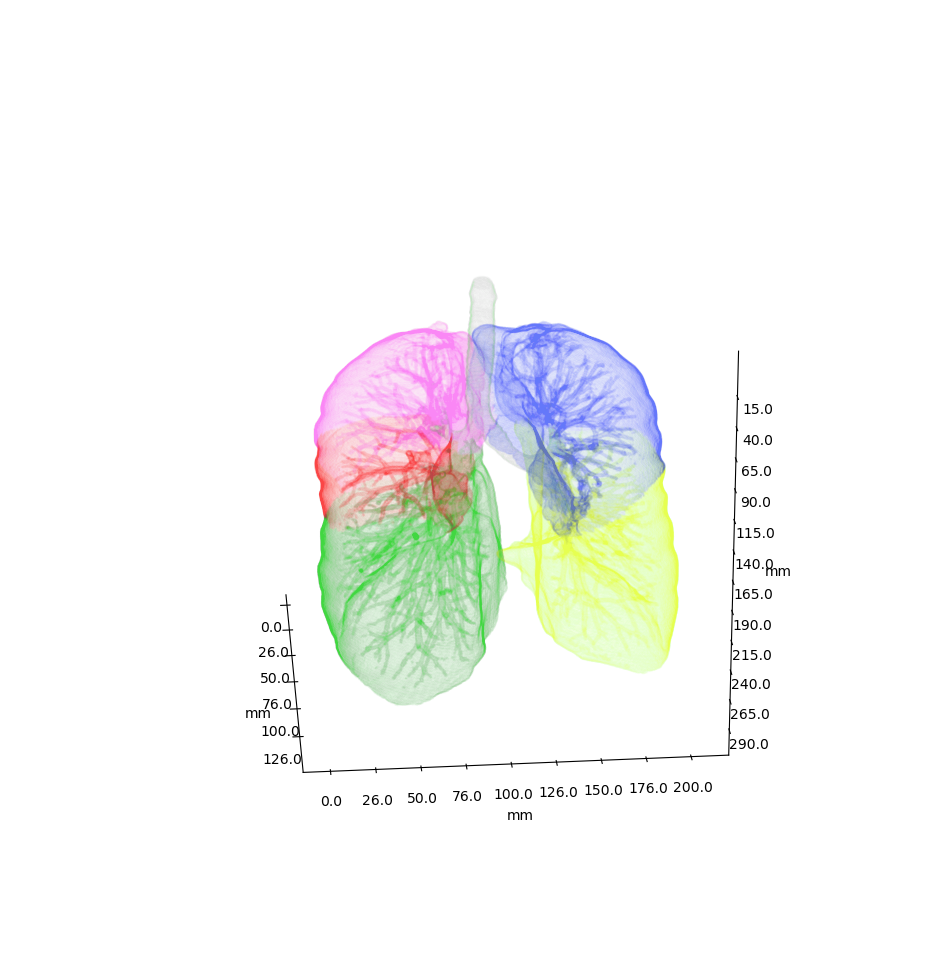
An example can be seen below, the 18 segments of the lung are automatically annotated in the 3D voxel model.
Example visualisation of split detection, rendered with Blender.
This project currently uses masks created using Synapse 3D by Fujifilm, which already segments the lobes, bronchus, arteries and veins in CT images. However, this is not required. To use this project you only need a detailed segmentation of the bronchi.
Quickstart
- Install with
pip install airway - Run the interactive tutorial with
airway tutorial(this will guide you through a fake sample) - Modify your own data so that you could use it with
airway(described in the data section below)
Data
We use a pipeline based approach to calculate the raw data. With the help of
airway_cli.py you are able to calculate each step (called stages).
To get the pipeline to work you need to define and format the first input stage, which is then used to create all other stages. You have multiple options which stage you use as input, depending on which is simpler for your use case:
raw_datais the structure as created by Synapse 3D and cannot be directly used as input. We used the script inscripts/separate-bronchus-files.shto createraw_airway. The format of it is still described in theDATADIRgraphic below for reference.raw_airwayis the same data asraw_data, but the directory structure has been reformatted. This was our input stage for the pipeline. See theDATADIRgraphic below for more details on the file structure. TheIMG\dfiles contain single slices for the CT scan, where -10000 was used for empty, and the rest were various values between -1000 to 1000. We assumed -10000 to be empty, and everything else to be a voxel of that type, as we already had segmented data.stage-01(recommended) can be used as an input stage as well, this may be considerably easier to compute if you have a wildly different data structure. Only a single file needs to be created:model.npz. It is a compressed numpy file where a single ~800×512×512 array is saved for the entire lung (order is important, (transverse × sagittal × frontal planes)). The ~800 is variable and depends on the patient, the 512×512 is the slice dimension. The array is of typenp.int8and the array in the.npzfile is not named (it should be accessible asarr_0). An encoding is used for each voxel to represent the 8 different classes as shown in the table below. If you do not have some classes then you may ignore them, onlybronchus(encoded as1) is required, as otherwise nothing will really work in the rest of the project. Empty or air should be encoded as0. Seeairway/image_processing/save_images_as_npz.pyfor reference if you decide to use this stage as input.
Note that the slice thickness for our data was 0.5 mm in all directions. Currently, the pipeline assumes this is always the case. It will work fairly well for different, but equal, thicknesses in all directions (e.g. 0.25 mm × 0.25 mm × 0.25 mm), although some results may wary. Different thicknesses in multiple directions (e.g. 0.8 mm × 0.8 mm × 3 mm) will likely not work well at all. In that case we recommend to duplicate certain axes manually, so that the thickness is similar in all directions.
| Category | Encoding |
|---|---|
| Empty | 0 |
| Bronchus | 1 |
| LeftLowerLobe | 2 |
| LeftUpperLobe | 3 |
| RightLowerLobe | 4 |
| RightMiddleLobe | 5 |
| RightUpperLobe | 6 |
| Vein | 7 |
| Artery | 8 |
The directory structure for the data structure is described below. Note that if you use stage-01 as input you do not need
raw_data or raw_airway at all.
    DATADIR
    ├── raw_data                    🠔 This is an example of entirely unformatted raw data as we received them
    │   └── Ct_Thorax_3123156       🠔 Each patient has its own directory
    │       └── DATA
    │           ├── Data.txt        🠔 This contained the paths for finding the various bronchus and lobes
    │           └── 3123156         🠔 Example patient ID
    │               └── 20190308
    │                   └── 124101
    │                       └── EX1
    │                           ├── SE1         🠔 Each SE* folder contains a list of DICOM images
    │                           │   ├── IMG1       named IMG1 through IMG642 (may be a different amount)
    │                           │   ├── ...        these represent the slices for that segmentation.
    │                           │   └── IMG642     E.g. SE4 is Bronchus, SE5 is the Right upper lobe.
    │                           ├── SE2            This is described in Data.txt for each patient.
    │                           ├── ...
    │                           └── SE10
    │                           └── SE11
    │
    ├── raw_airway                  🠔 Formatted data which will be used as input for stage-01
    │   └── 3123156                 🠔 Single patient folder, in total there are around 100 of these
    │       ├── Artery
    │       │   ├── IMG1            🠔 DICOM images, in our case 512x512 slices
    │       │   ├── IMG2            🠔 with 0.5 mm thickness in all directions
    │       │   ├── ...
    │       │   ├── IMG641          🠔 There generally are between 400 and 800 of these slices
    │       │   └── IMG642          🠔 So the number of slices is variable
    │       ├── Bronchus
    │       │   ├── IMG1            🠔 Same number and dimension of slices as above
    │       │   ├── ...
    │       │   └── IMG642
    │       ├── LeftLowerLobe       🠔 All of these also share the same structure
    │       ├── LeftUpperLobe
    │       ├── RightLowerLobe
    │       ├── RightMiddleLobe
    │       ├── RightUpperLobe
    │       └── Vein
    │
    ├── stage-01                    🠔 Each stage now has the same basic format
    │   ├── 3123156
    │   │   └── model.npz           🠔 See above for an explanation
    │   ├── 3123193
    │   │   └── model.npz
    │   └── ...
    ├── stage-02                    🠔 Each stage from here on will be created by the pipeline itself
    │   ├── 3123156                    so you do not need to handle this, each of them have different
    │   └── ...                        files depending on their use.
    ...
Note that currently NIFTI images are not supported, all IMG\d files are DICOM images.
Installation
At least Python 3.6 is required for this project.
pip3 install airway
The open source 3D visualisation software Blender is required for visualisation. This dependency is optional if you do not need the visualisation part. Install from the website above or via a package manager like this (pip does not have blender):
apt install blender
Tested with Blender versions 2.76, 2.79, 2.82 (recommended) and 2.92.
Now configure the defaults, copy and rename configs/example_defaults.yaml to configs/defaults.yaml
(in the root folder of the project) and change the path in the file to where you have put the data.
You may ignore the other parameters for now, although feel free to read the comments there and adjust
them as needed (especially number of workers/threads).
Stages
For every calculated stage airway creates a new directory (stage-xx) and
subdirectories for each patient (e.g. 3123156).
Each stage has input stages, these are handled for you though, so you only need to specify which stages to create.
If you use raw_airway as input stage, then calculate stage-01:
airway stages 1
You may add the -1 flag to calculate a single patient for test purposes. Note that calculation of stage-01
may be really slow if you store your data on an HDD (multiple hours), as there are a lot of single small files with a large
overhead for switching between files.
Or if you use stage-01 as input you can calculate stage-02 directly:
airway stages 2
If this works then great! You may continue to create all other stages as described below. If it does not work, then make sure the data format is correct as described in the Data section. If you think everything is correct then please open an issue or message me, there may be bugs, or some stuff may be naively hard-coded.
You may list all stages with short descriptions by calling airway stages without any arguments,
or you can list all commands by using the --help flag.
Summary of the stages:
- Stages 1 - 7 use the raw data to create the tree splits used in the rest of the stages.
- Stages 30 - 35 analyse the tree structure, focusing mostly on the left upper lobe.
- Stages 60 - 62 are 3D visualisations, wherein .obj files of the lungs are exported.
- Stages 70 - 72 are plot visualisations of various stats.
- Stage 90 is the website which displays information for each patient including the 3D models.
The airway pipeline checks if the stage already exists, if you need to overwrite
a stage you need to add the -f/--force flag.
You can now create all remaining stages like this:
airway stages 2+
It may take a couple of hours for everything, depending on how many patients you have.
If you don't have some dependencies installed you can still safely run it, and only those stages will crash.
Open the ./log file and search for STDERR if you want to see the errors listed by airway.
By default, eight patients will be calculated in parallel (8 workers are used). If you have more CPU threads, simply increase the number of workers:
airway stages 1 2 3 -w 32 or change the default in the config file (defaults.yaml).
To see the results you may open blender interactively like this:
airway vis 1 -o
This loads the bronchus model with the correct materials for the segments.
You can also see the various files created by the stages:
stage-62: renders based on the lungstage-10: which contain.graphmlfiles describing the tree structure, and the classifications created by the algorithm.stage-35: creates a pdf with renders for each patientstage-11: creates a pdf with the found clusters of the various structures
More images
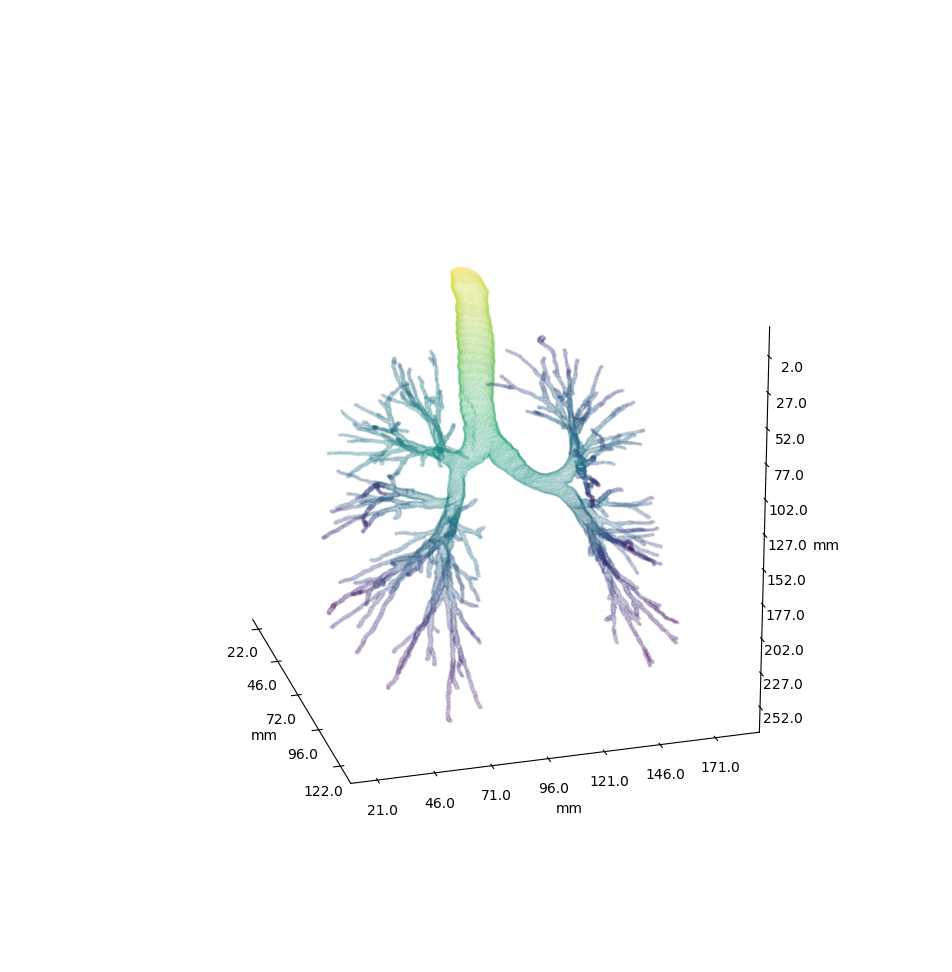
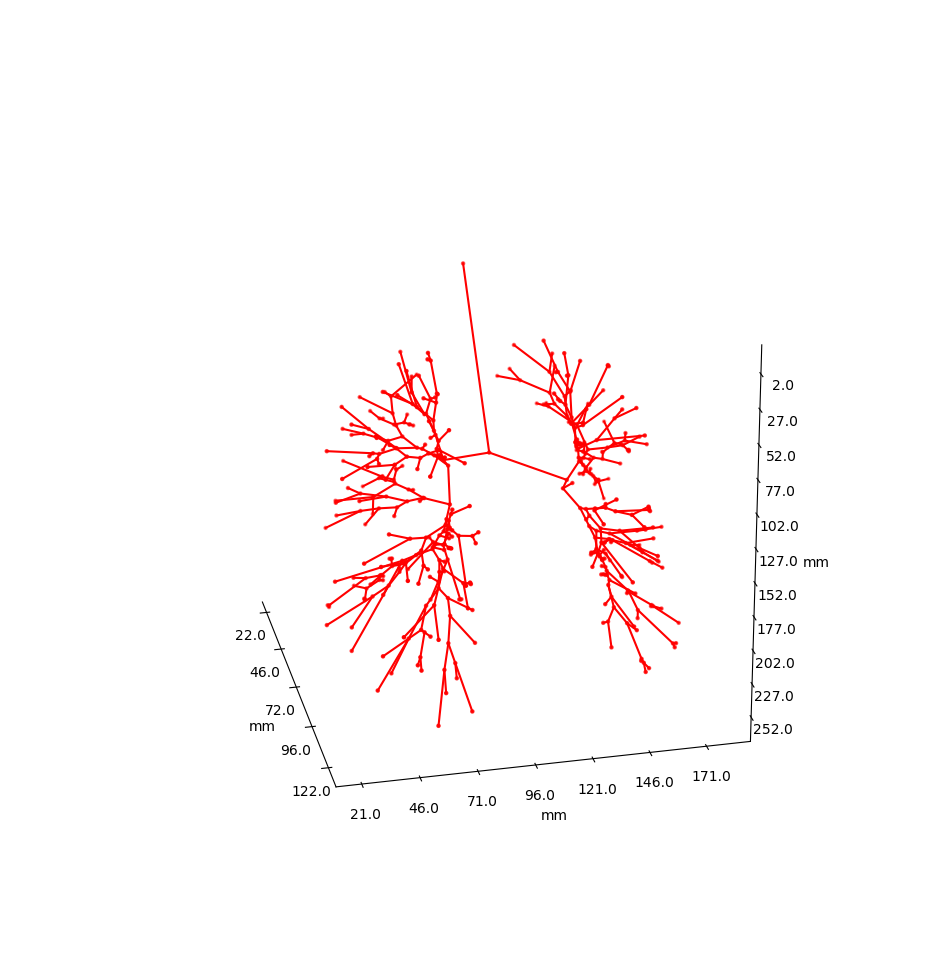
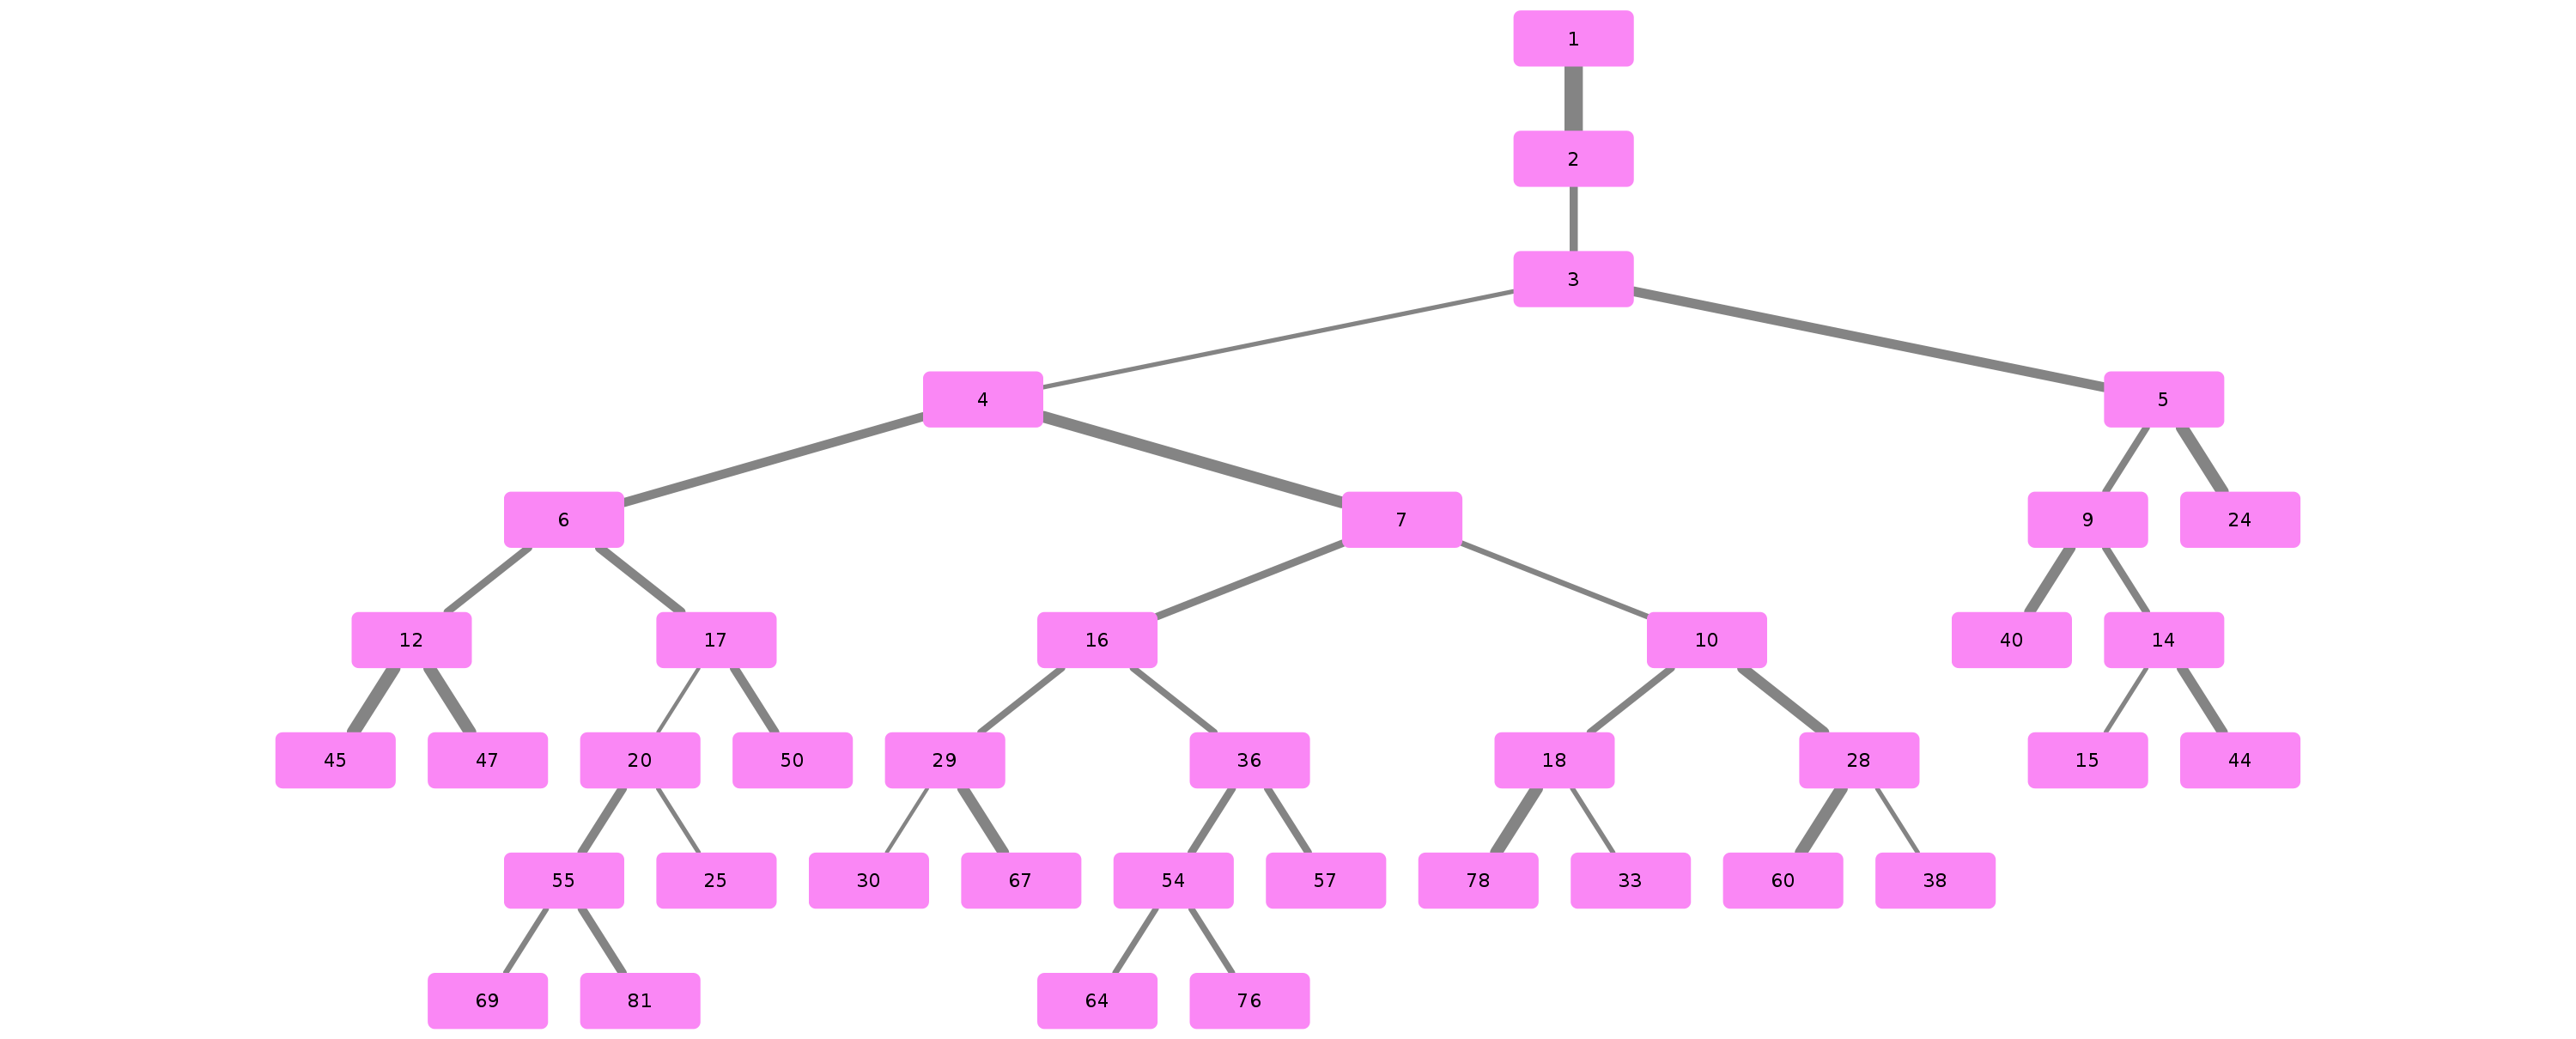
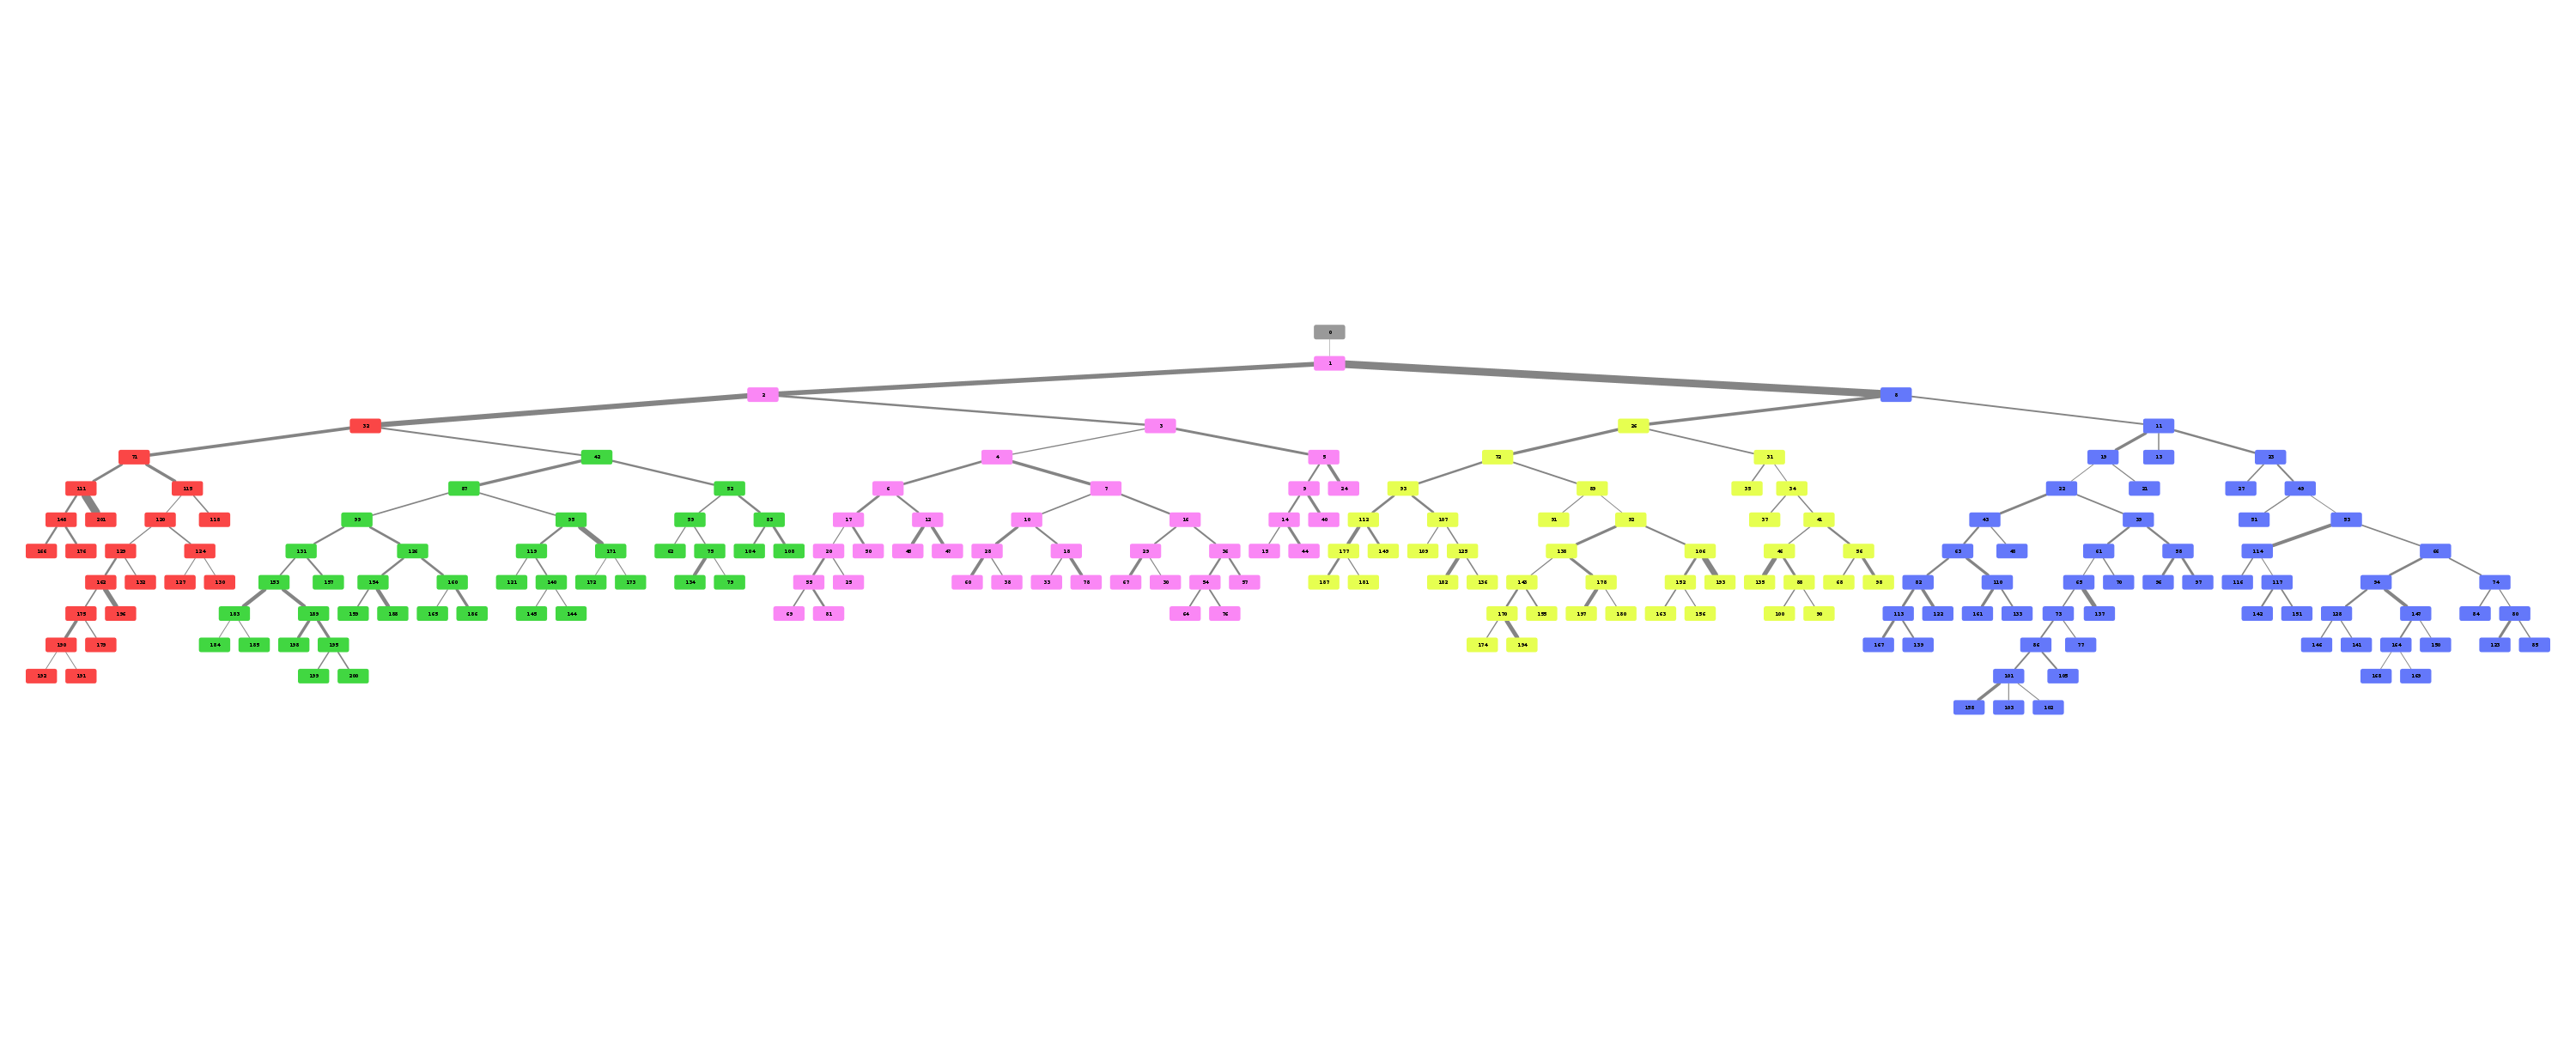
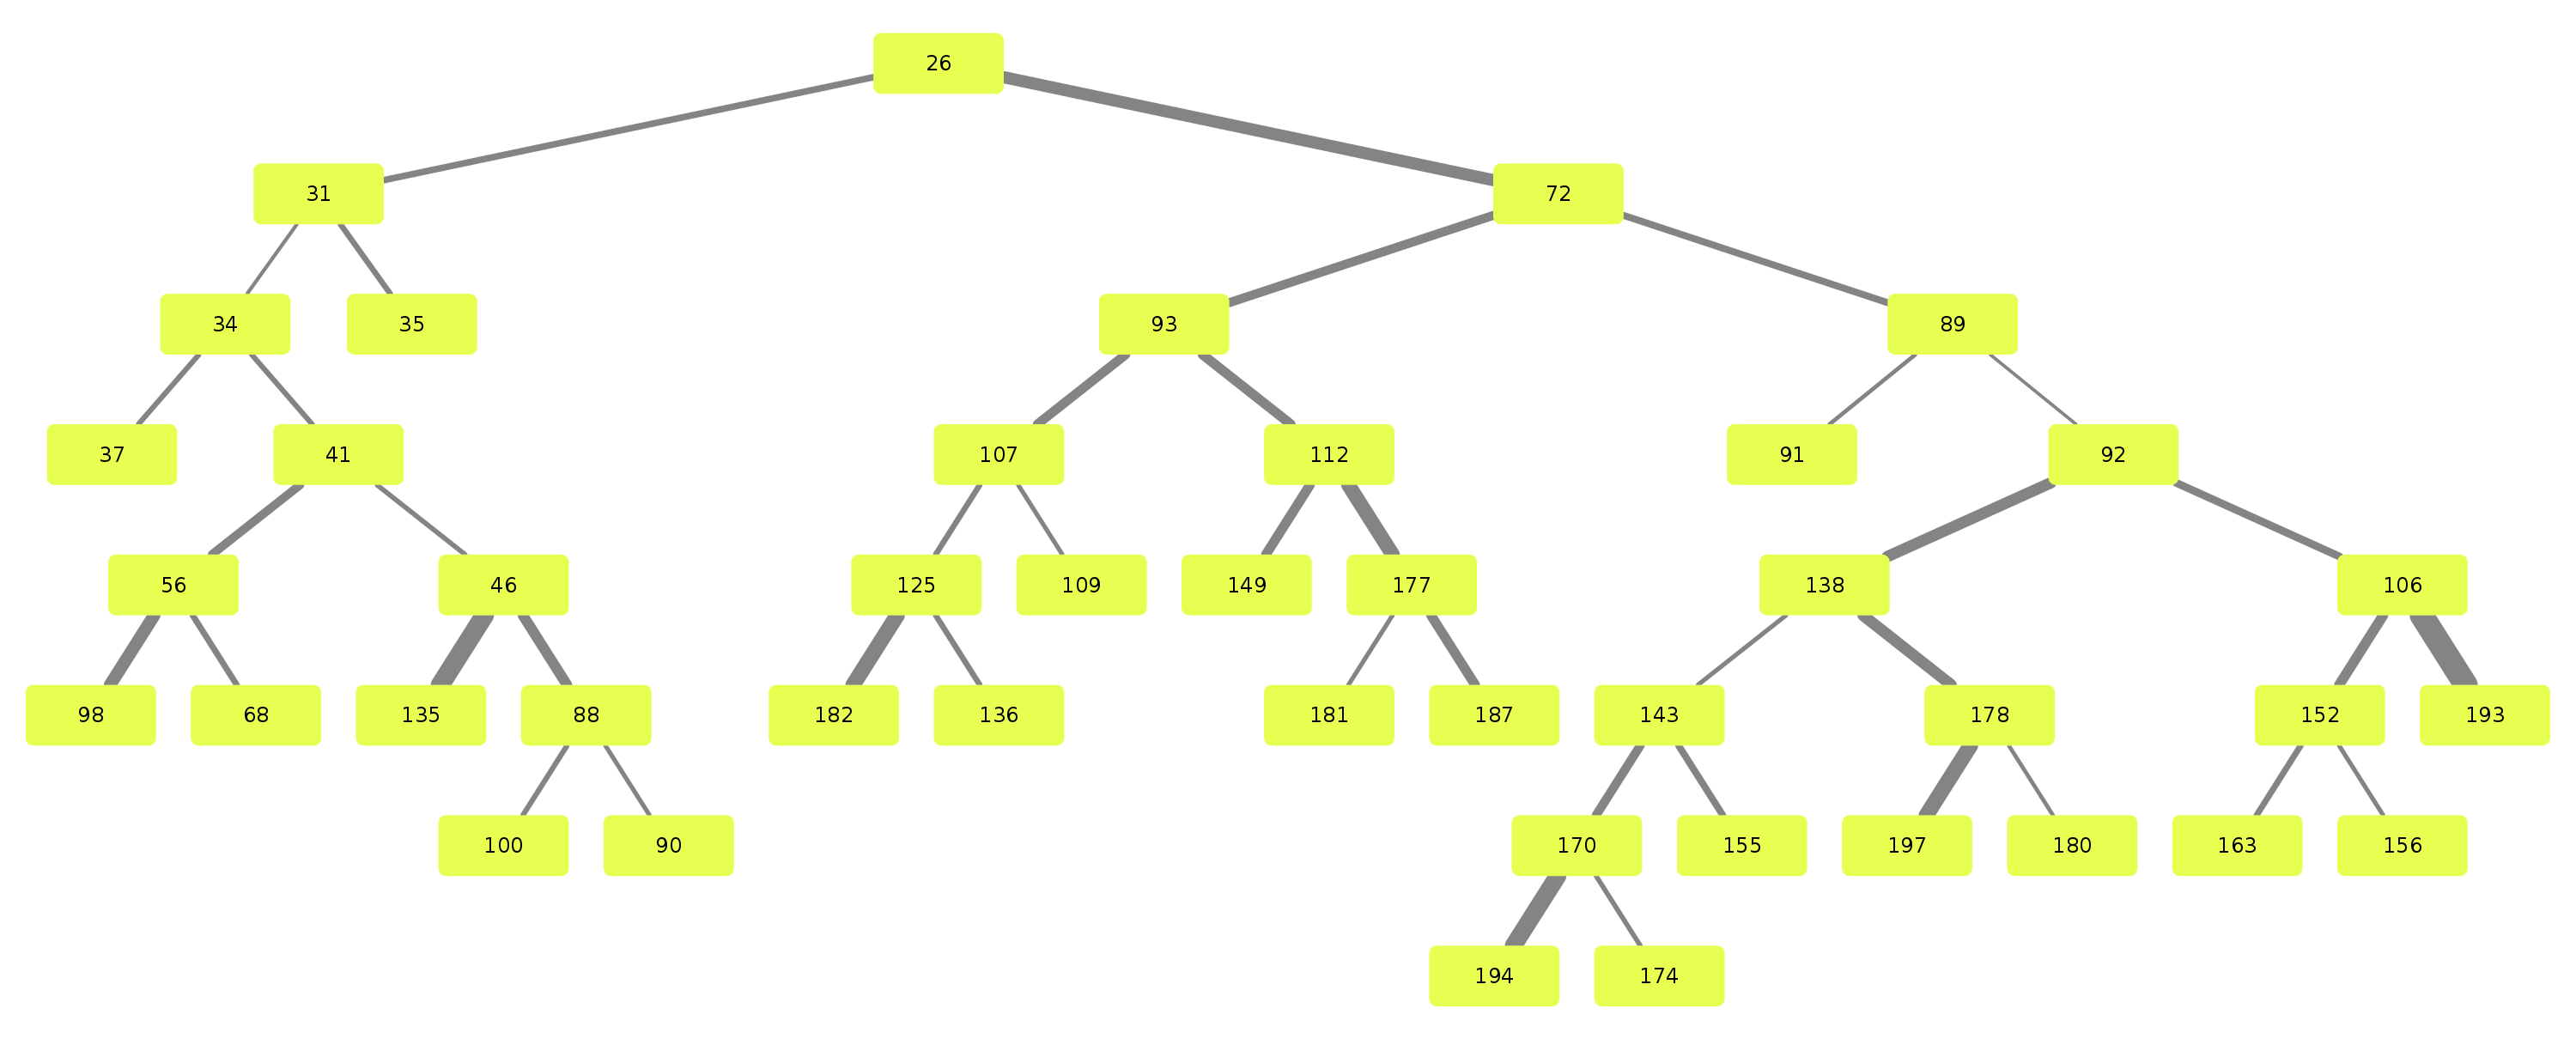
Example trees for patient 3183090
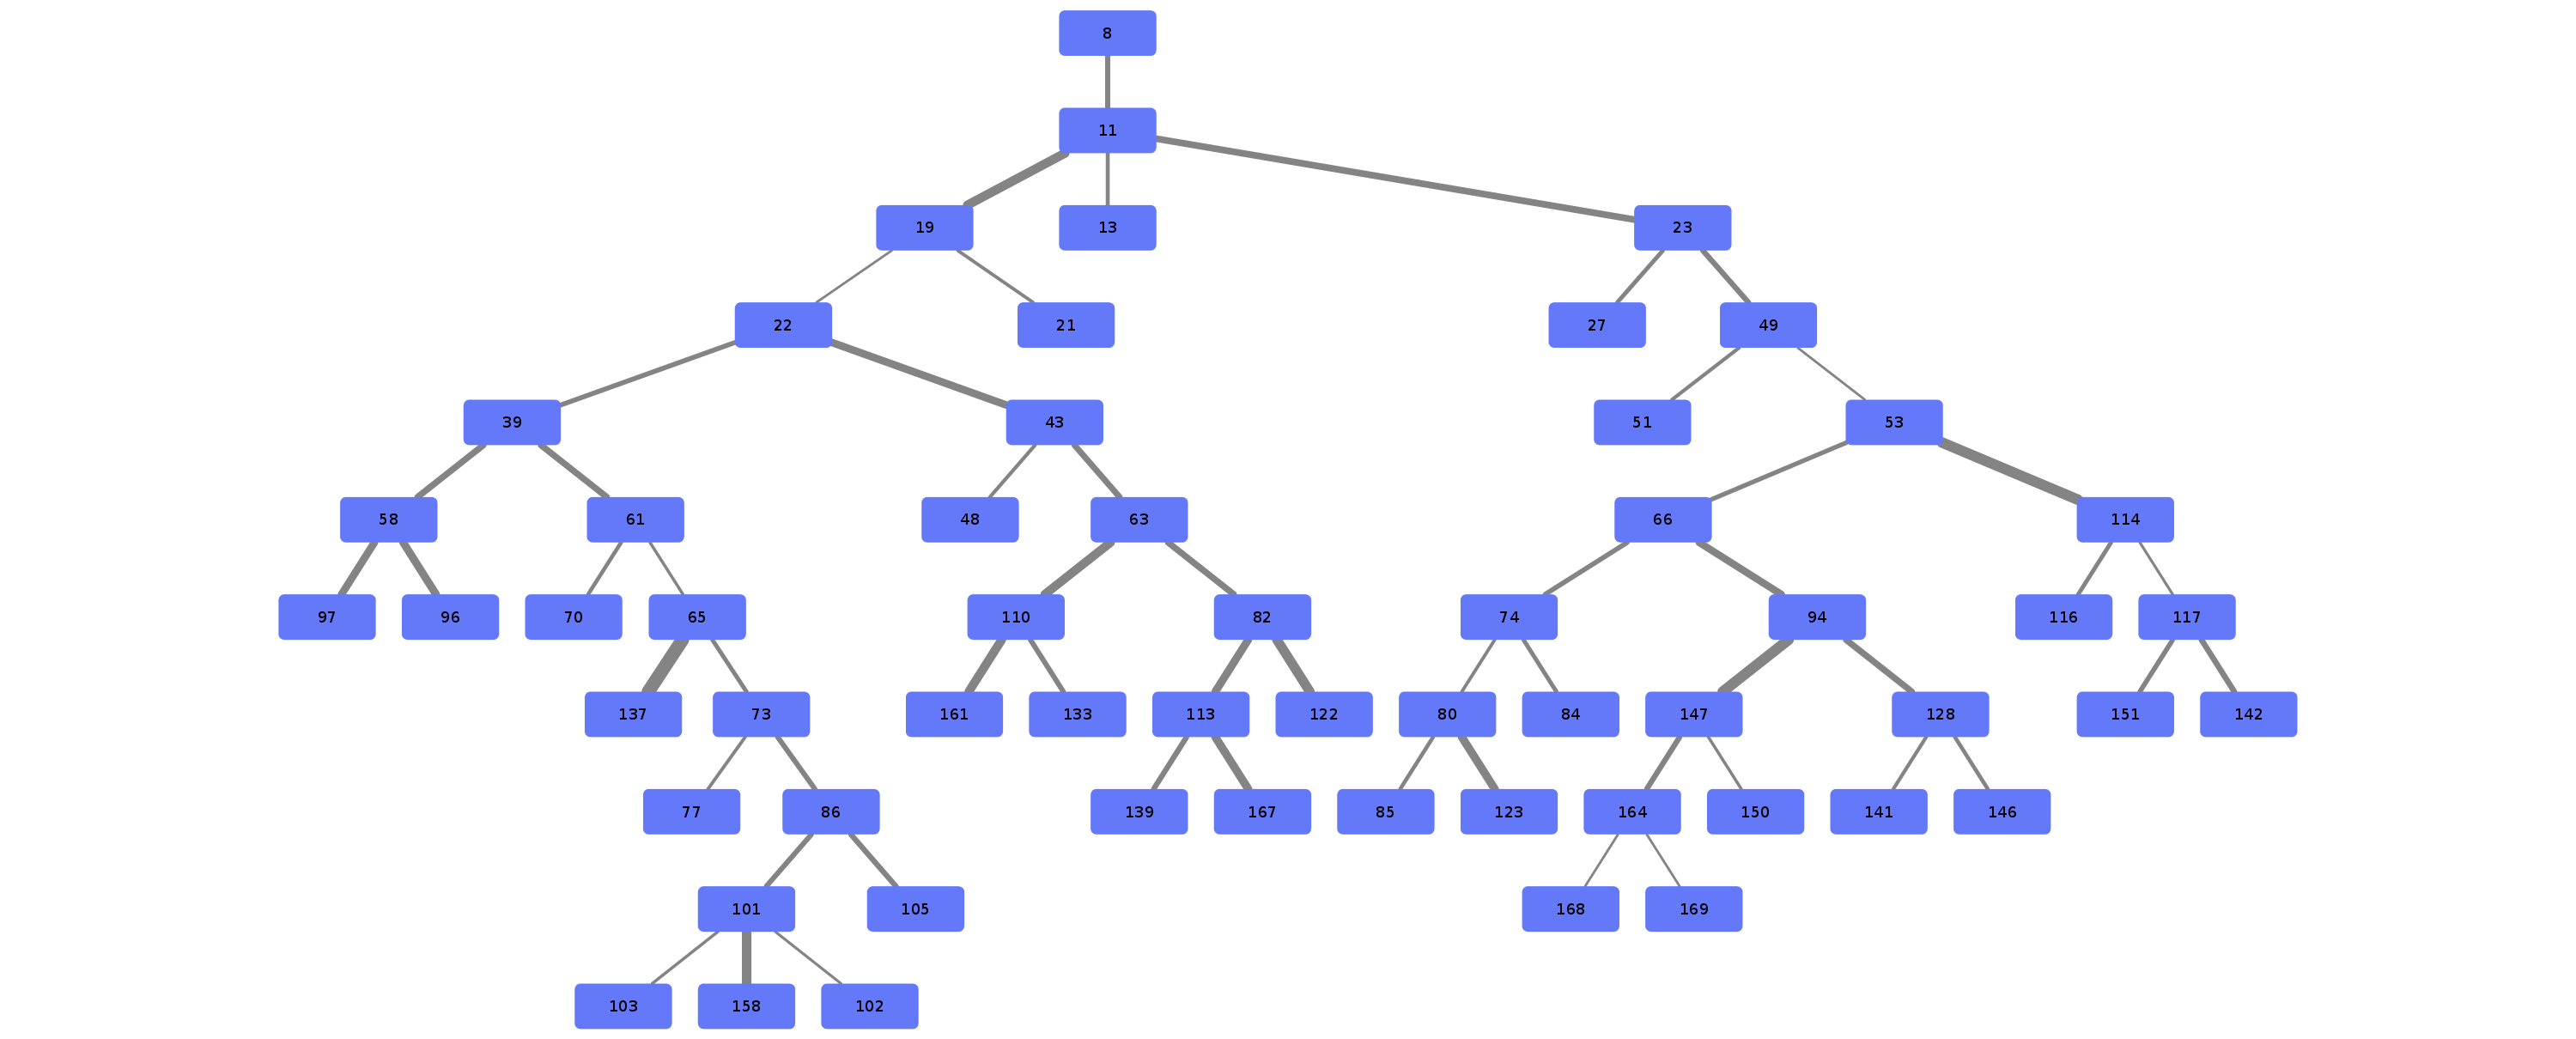
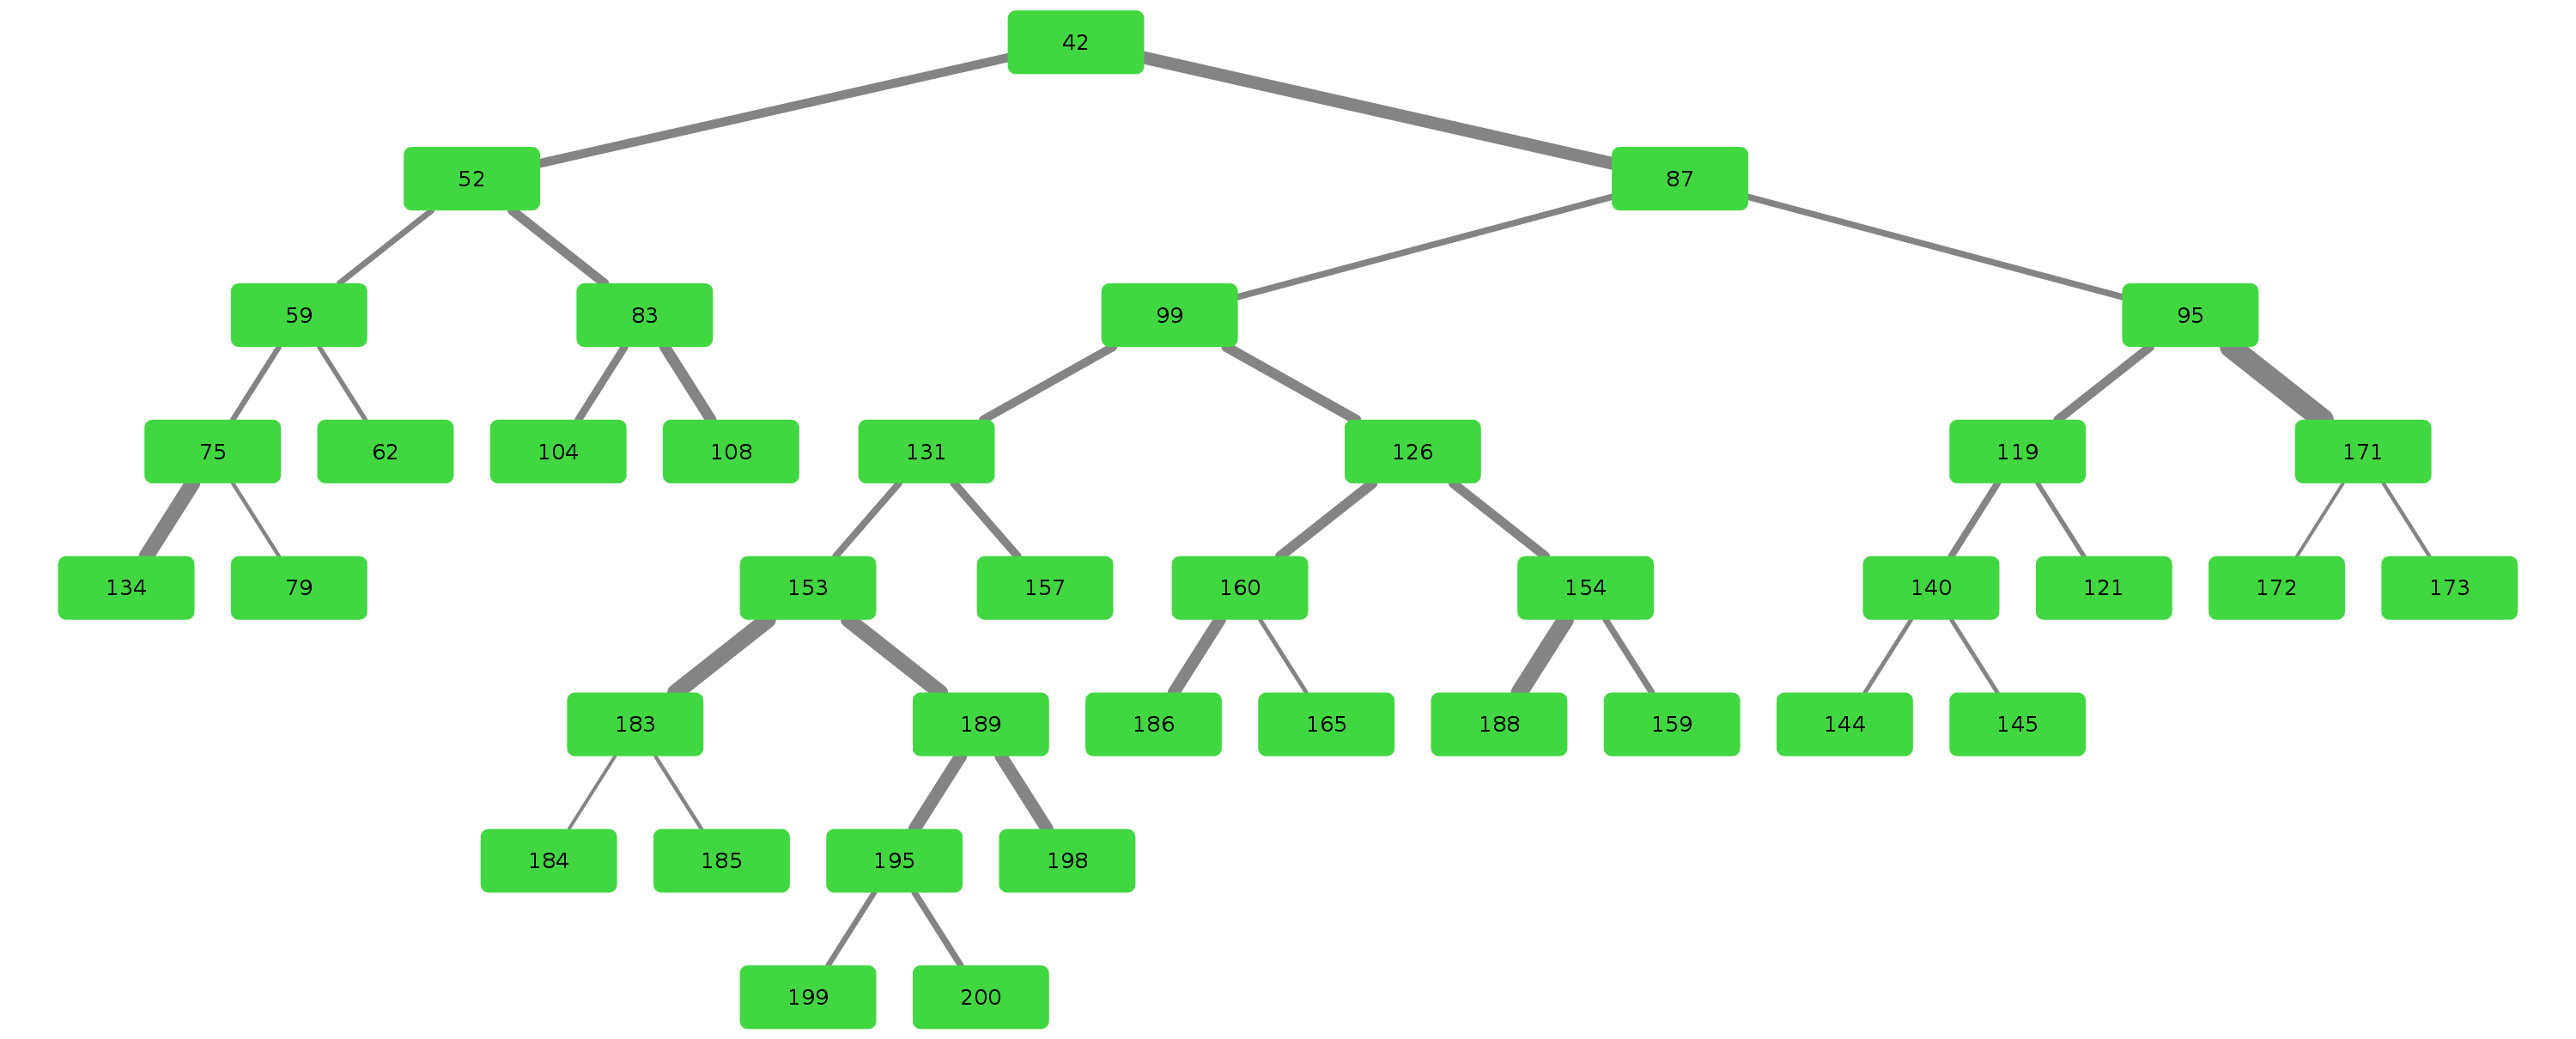
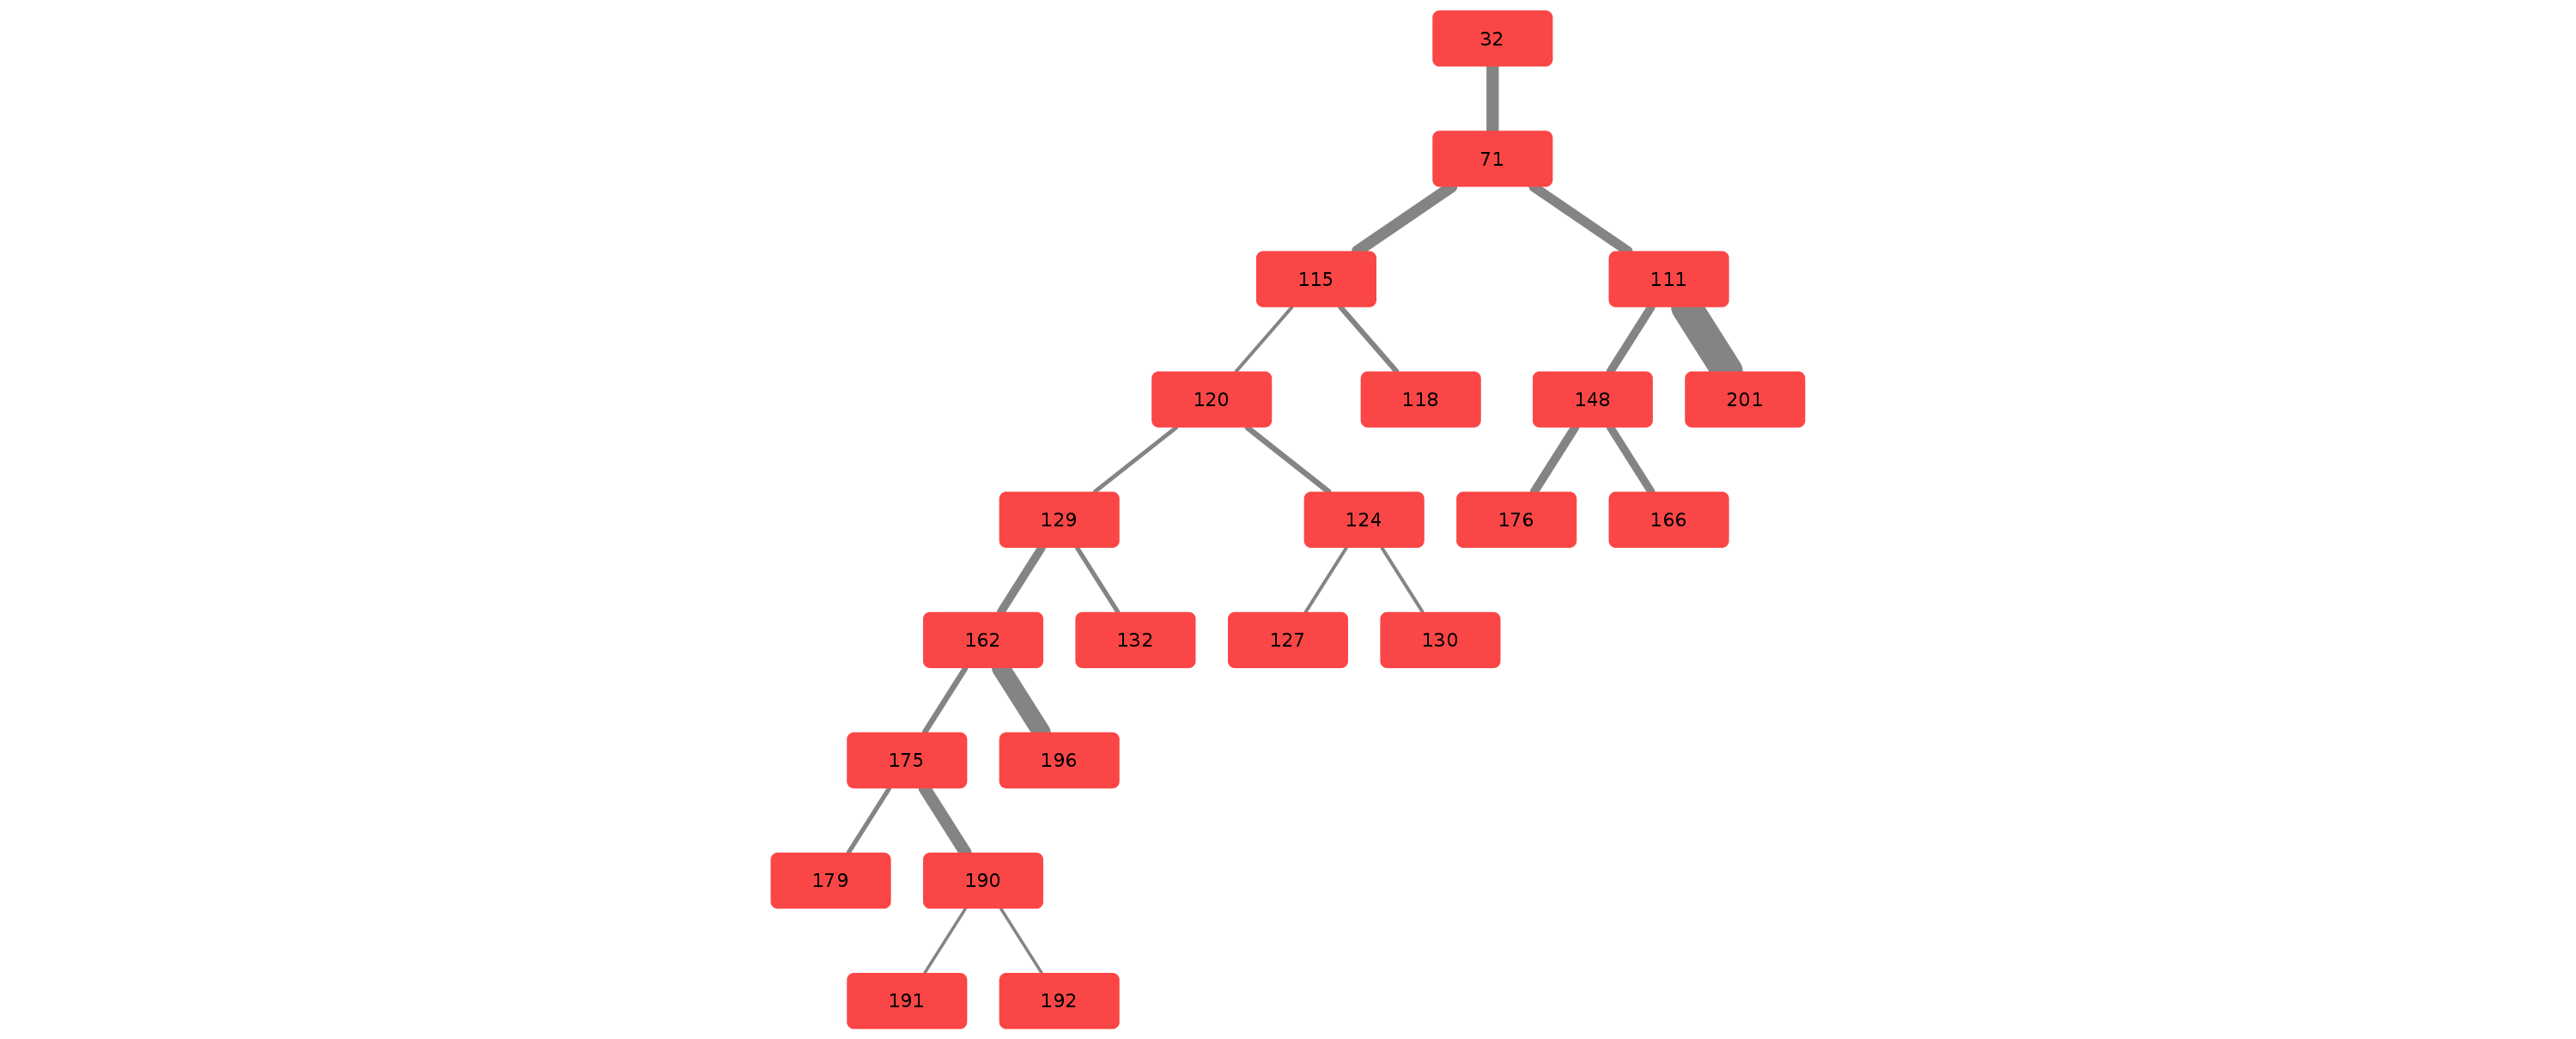
Credits & Thanks to
Airway originated as an observation by Dr. Rolf Oerter at the University of Rostock that certain structures in the lungs bronchus he has seen while operating have not been documented. The first steps of the project were made as a student project at the University of Rostock at the Department of Systems Biology organised by Mariam Nassar.
It consisted of this team:
- Martin Steinbach
- Brutenis Gliwa
- Lukas Großehagenbrock
- Jonas Moesicke
- Joris Thiele
After this, the project is being continued by me (Brutenis) as my bachelor thesis. Thanks to Mariam Nassar, Dr. Rolf Oerter, Gundram Leifert and Prof. Olaf Wolkenhauer for supervision during this time. And thanks to Planet AI for letting me write my thesis at their office.
Project details
Download files
Download the file for your platform. If you're not sure which to choose, learn more about installing packages.


