Algebra and Analytic Geometry in Python
Project description
algepy
A Python Package that allows you to manipulate vectors, it can be useful to calculate or verify the results of your operations.
This project is still under development and is not fully developed, it may have some bugs or failures.
Installation
- The package is not yet uploaded to PyPI so to test it you need to clone the repository and test it manually.
git clone https://github.com/manucabral/algepy.git
cd algepy
Vector
To create a vector you simply need to instantiate the Vector class with its components (x, y, z)
By default it will have 3 dimensions but you can specify the dimension as in the following example.
from algepy import Vector
v = Vector(x=1, y=1, z=1)
u = Vector(x=1, y=1, z=1, dimension=2)
Basic operations
To add and subtract you just have to use the + and - operator, both operations returns a vector.
>>> from algepy import Vector
>>> u = Vector(x=1, y=2, z=3)
>>> v = Vector(x=0, y=2, z=5)
>>> u + v
(1,4,8)
>>> u - v
(1,0,-2)
Opposite
To get the opposite of a vector you have to use its opposite method, this method returns a new vector.
>>> from algepy import Vector
>>> u = Vector(x=1, y=2, z=3)
>>> u.opposite()
(-1,-2,-3)
Magnitude
To get magnitude of the vector, you have to use magnitude method, this method returns a decimal number.
>>> from algepy import Vector
>>> u = Vector(x=1, y=2, z=3)
>>> u.magnitude()
3.7416573867739413
Direction Cosine
To get the direction angles of a vector you have to use the direction_cosine method, this method requires that you specify the axis (x, z, y).
The method returns radians by default but you can change it to degrees using the degrees parameter, the same applies with the decimals parameter.
>>> from algepy import Vector
>>> a = Vector(x=2, y=0, z=-2)
>>> a.direction_cosine(axis='x', degrees=True)
45.0
>>> a.direction_cosine(axis='y', degrees=True)
90.0
>>> a.direction_cosine(axis='z', degrees=True)
135.0
Angle between two vectors
To get the angle between two vectors, use the commutative method angle.
The method returns radians by default but you can change it to degrees using the degrees parameter, the same applies with the decimals parameter.
>>> from algepy import Vector
>>> u = Vector(x=1, y=1, z=3)
>>> v = Vector(x=-1, y=0, z=4)
>>> u.angle(v, degrees=True, decimals=3)
36.448
>>> u.angle(v) # resultado en radianes
0.6361
Dot product
To get the dot product between two vectors, use the * operator (do not confuse this operator with the cross product), this operation returns a scalar number.
>>> from algepy import Vector
>>> u = Vector(x=-3, y=5, z=8)
>>> v = Vector(x=1, y=1, z=1)
>>> u * v
10
Perpendicular
To know if a vector is perpendicular to another you have to use the perpendicular method, this method returns a boolean value (True or False)
>>> from algepy import Vector
>>> u = Vector(x=1, y=1, z=3)
>>> v = Vector(x=-1, y=0, z=4)
>>> u.perpendicular(v)
False
Proyection
To get the projection of one vector in the direction of another you have to use the projection method, this method returns a list with two vectors.
w: main vector (u) projected on another vector (v)
n: other vector (v) projected on main vector (u)
The main vector is the vector to which we apply the projection method.
>>> from algepy import Vector
>>> u = Vector(x=1, y=2, z=1)
>>> v = Vector(x=0, y=1, z=-1)
>>> w, n = u.proyection(v)
>>> w
(0.0,0.4999999999999999,-0.4999999999999999) # u on v
>>> n
(1.0,1.5,1.5) # v on u
Cross product
To get the cross product between two vectors, you must use the cross method, this returns the vector resulting from the cross product.
Bear in mind that the vector product is not commutative, since if we change the order of the vectors, the direction and the magnitude of the vector product are preserved, but the sense is reversed.
>>> from algepy import Vector
>>> a = Vector(x=1, y=2, z=3)
>>> b = Vector(x=0, y=2, z=5)
>>> v = a.cross(b)
>>> v
(4,-5,2) # cross product
>>> v.perpendicular(a), v.perpendicular(b)
True, True
Triple product
To get the triple product you have to use the triple method, this returns a number and isn't commutative.
Defined u, v and w
When using the method on u.triple(v, w) the cross product between v and w will be applied and then the dot product between u(vx w)
>>> from algepy import Vector
>>> u = Vector(x=1, y=2, z=3)
>>> v = Vector(x=0, y=2, z=5)
>>> w = Vector(x=0, y=0, z=2)
>>> u.triple(v, w)
4
>>> u * v.cross(w) # equivalent
Point
To create a point you simply need to instantiate the Point class with its (x,y,z) components.
You can only use 3-dimensional points.
from algepy import Point
>>> R = Point(x=1, y=1, z=4)
>>> S = Point(x=3, y=0, z=2)
Basic operations
To add and subtract you just have to use the + and - operator, both operations return a point.
Midpoint
To get the midpoint between two points, use the midpoint method, it returns a vector with the components of the midpoint.
from algepy import Point
>>> r = Point(x=1, y=2, z=3)
>>> s = Point(x=3, y=-1, z=2)
>>> r.midpoint(s)
(2.0,0.5,2.5)
Find the vector between two points
To get a vector from two points you have to use the find_vector method, this returns a vector formed from the two points.
from algepy import Point
>>> r = Point(x=1, y=1, z=4)
>>> s = Point(x=3, y=0, z=2)
>>> r.find_vector(s)
(2,-1,-2)
Plot
Algepy uses pyplot from matplotlib so for this module to work, you need to have this package installed.
For now the plot only supports 3 dimensions, you can try others dimensions but you will have errors.
plot = Plot(name='Example', projection='3d')
plot.show()
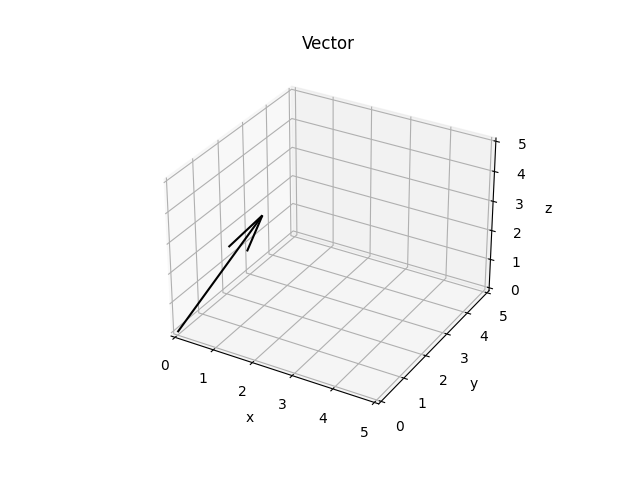
Plot a vector
To add a vector to our plot we need to use the add_vector method and also have an origin point for the vector.
Once this is done we can show the graph with the show method.
origin = Point(x=0, y=0, z=0)
a = Vector(x=1, y=2, z=3)
plot = Plot(name='Vector', projection='3d')
plot.add_vector(origin=origin, vector=a)
plot.show()

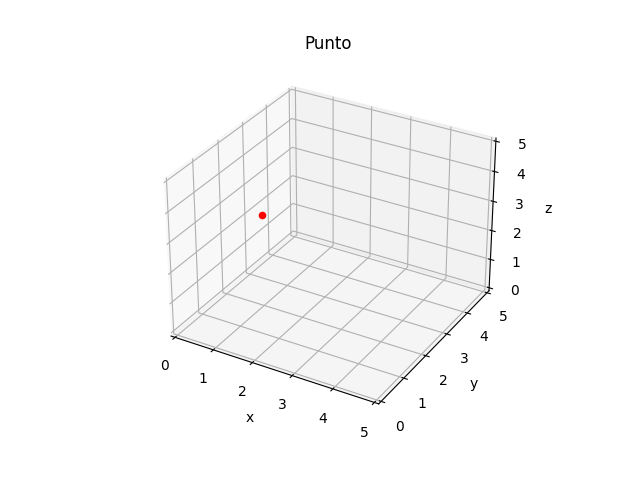
Plot a point
To add a point to our plot we need to use the add_point method.
Once this is done we can show the graph with the show method.
p = Point(x=1, y=2, z=3)
plot = Plot(name='Point', projection='3d')
plot.add_point(point=p, color='red')
plot.show()

Contributions
All contributions, reports or bug fixes and ideas are welcome. You can go to the issues section and provide your help.
Project details
Release history Release notifications | RSS feed
Download files
Download the file for your platform. If you're not sure which to choose, learn more about installing packages.


