
ambivalent 🤷🏻
Sam Foreman 2024-05-13
opinionatedambivalent 🤷🏻
Clean, simple style for Matplotlib figures.
Transparent backgrounds with grey text
$\textcolor{#838383}{\blacksquare}$ that are accessible / legible and
{light, dark}-mode independent.
Install
python3 -m pip install ambivalent
Getting Started
import ambivalent
import matplotlib.pyplot as plt
plt.style.use(ambivalent.STYLES['ambivalent'])
Examples
seaborn Tips Dataset
Code
import seaborn as sns

tips = sns.load_dataset("tips")
tips.head()

fig, ax = plt.subplots(figsize=(6, 6))  # , ncols=2)

_ = sns.kdeplot(
   data=tips, x="total_bill", hue="size",
   fill=True, common_norm=False, palette="flare_r",
   alpha=.3, linewidth=0,
   ax=ax,  # [0],
)
_ = ax.set_ylabel('')
plt.show()

seaborn Scatter Plot
Code
import seaborn as sns
import matplotlib.pyplot as plt

# Load the example diamonds dataset
diamonds = sns.load_dataset("diamonds")

# Draw a scatter plot while assigning point colors and sizes to different
# variables in the dataset
f, ax = plt.subplots(figsize=(6, 6))
_ = sns.despine(f, left=True, bottom=True)
_ = clarity_ranking = ["I1", "SI2", "SI1", "VS2", "VS1", "VVS2", "VVS1", "IF"]
_ = sns.scatterplot(x="carat", y="price",
                hue="clarity", size="depth",
                palette="flare",
                hue_order=clarity_ranking,
                sizes=(1, 8), linewidth=0,
                data=diamonds, ax=ax)

Histogram + Scatter Plot
Code
import numpy as np
import seaborn as sns
import matplotlib.pyplot as plt

# Simulate data from a bivariate Gaussian
n = 10000
mean = [0, 0]
cov = [(2, .4), (.4, .2)]
rng = np.random.RandomState(0)
x, y = rng.multivariate_normal(mean, cov, n).T

# Draw a combo histogram and scatterplot with density contours
f, ax = plt.subplots(figsize=(6, 6))
_ = sns.scatterplot(x=x, y=y, s=5, color="#666666", alpha=0.3)
_ = sns.histplot(x=x, y=y, bins=50, pthresh=.1, cmap="flare_r")
_ = sns.kdeplot(x=x, y=y, levels=5, color="w", linewidths=1)
_ = ax.set_xlabel('x')
_ = ax.set_ylabel('y')
_ = plt.show()

Jointplot
Code
import seaborn as sns
# Load the penguins dataset
penguins = sns.load_dataset("penguins")
# Show the joint distribution using kernel density estimation
import matplotlib as mpl
with mpl.rc_context(plt.rcParams.update({'axes.grid': False})):
  g = sns.jointplot(
      data=penguins,
      x="bill_length_mm",
      y="bill_depth_mm",
      hue="species",
      edgecolors='none',
      alpha=0.4,
  )
  _ = plt.grid(False)
  plt.show()

Matplotlib Histograms
Code
import matplotlib.pyplot as plt
import numpy as np

n_bins = 10
x = np.random.randn(1000, 3)

plt.rcParams['axes.grid'] = True

fig, ((ax0, ax1), (ax2, ax3)) = plt.subplots(nrows=2, ncols=2)

colors = ['#333333', '#666666', '#999999']
ax0.hist(x, n_bins, density=True, histtype='bar', color=colors, label=colors)
_ = ax0.legend()
_ = ax0.set_title('bars with legend')

_ = ax1.hist(x, n_bins, density=True, histtype='bar', stacked=True, alpha=0.4)
_ = ax1.set_title('stacked bar')

_ = ax2.hist(x, n_bins, histtype='step', stacked=True, fill=False)
_ = ax2.set_title('stack step (unfilled)')

# Make a multiple-histogram of data-sets with different length.
x_multi = [np.random.randn(n) for n in [10000, 5000, 2000]]
_ = ax3.hist(x_multi, n_bins, histtype='bar')
_ = ax3.set_title('different sample sizes')

_ = fig.tight_layout()
plt.show()

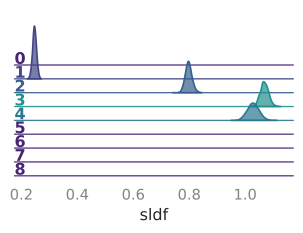
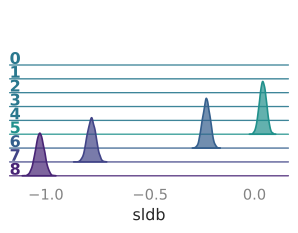
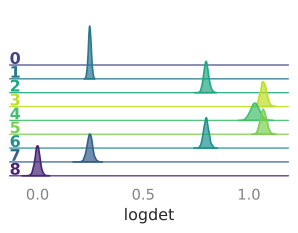
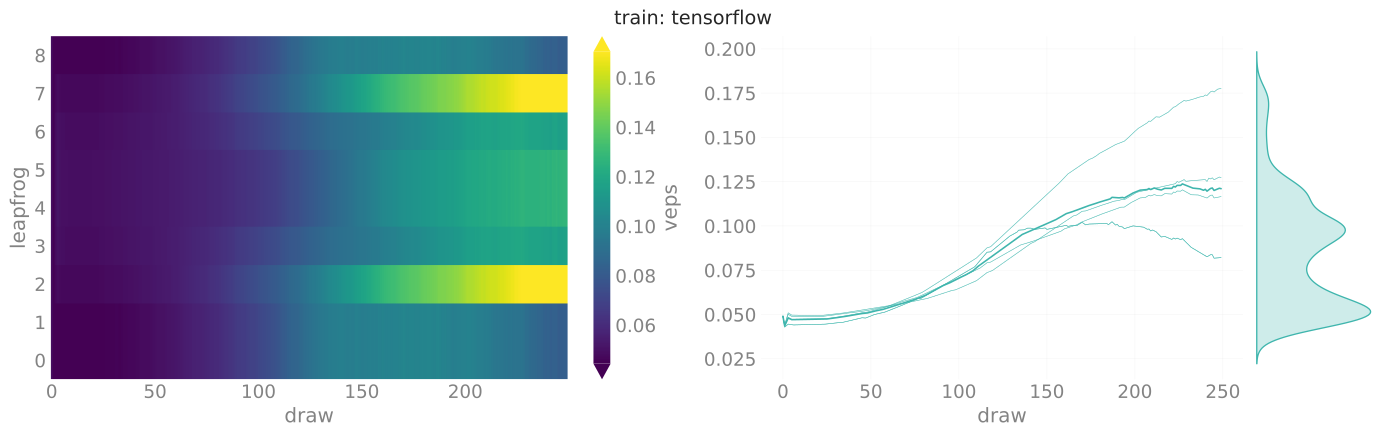
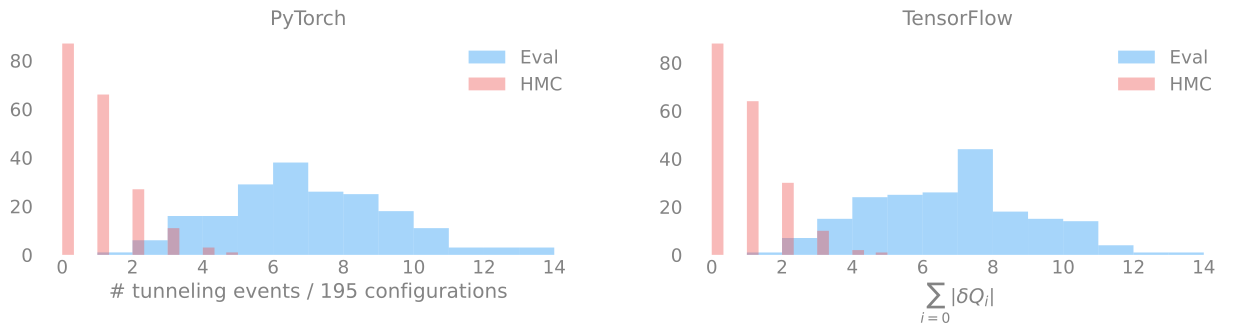
Gallery1
More Examples…

[!TIP]
💝 Status
Last Updated: 05/13/2024 @ 21:56:28

-
Examples from Matplotlib Examples ↩
1 maintainer

Metadata
1 maintainer
Release files for ambivalent 0.3.0
For a detailed explanation of source distributions (sdists) and built distributions (wheels), please see the package formats documentation.
Source distribution (sdist)
| File | Size | Uploaded | |
|---|---|---|---|
| ambivalent-0.3.0.tar.gz | 91.3 MB | Details |
Built distribution (wheel)
| File | Interpreter | ABI | Platform | Reset |
|---|---|---|---|---|
| ambivalent-0.3.0-py3-none-any.whl | Python 3 | none | any | Details |
Total release size: 91.3 MB
Release files / ambivalent-0.3.0.tar.gz
| Download URL | ambivalent-0.3.0.tar.gz |
|---|---|
| Size | 91.3 MB |
| Tags | Source |
|
SHA-256 checksum How to use checksums |
e3237e5e376c20bd43f6f7e3fe6f6a79dfae99c5c2cfe92881f06b15763c05f5
|
|
BLAKE2b-256 checksum How to use checksums |
40a5a10440f78fc924ee84e4ddb0770c301fe7f917fd33c799f9c989aa68b580
|
| Upload date | |
|
Uploaded using Trusted Publishing? What is trusted publishing? |
No |
| Uploaded via |
python-httpx/0.27.0
|
Release files / ambivalent-0.3.0-py3-none-any.whl
| Download URL | ambivalent-0.3.0-py3-none-any.whl |
|---|---|
| Size | 26.2 kB |
| Tags | Python 3 |
|
SHA-256 checksum How to use checksums |
52ddd5d4427837b43bfb3feb0dc3674687b802fda1b18753f8f5212e9e31a476
|
|
BLAKE2b-256 checksum How to use checksums |
7bd1b05ade12f7c0eb12190ae88eb0724fe62476300584fb9b68c4e864398362
|
| Upload date | |
|
Uploaded using Trusted Publishing? What is trusted publishing? |
No |
| Uploaded via |
python-httpx/0.27.0
|














