
antplus-recorder
Shows and records every ANT+ sensor in range: power meters, smart trainers and heart rate straps, side by side in the terminal. Built to compare power meters against each other, for example a smart trainer against crank or pedal power meters. One power meter is the reference, and every other one shows how far it is off, in watts and percent. Every ride is written to a CSV file, to one FIT file per power meter and to a raw log of every ANT+ message, from which any ride can be recomputed with a later version.
There is no pairing. The ANT+ USB stick listens to the whole ANT+ frequency, and every sensor that sends shows up on its own.
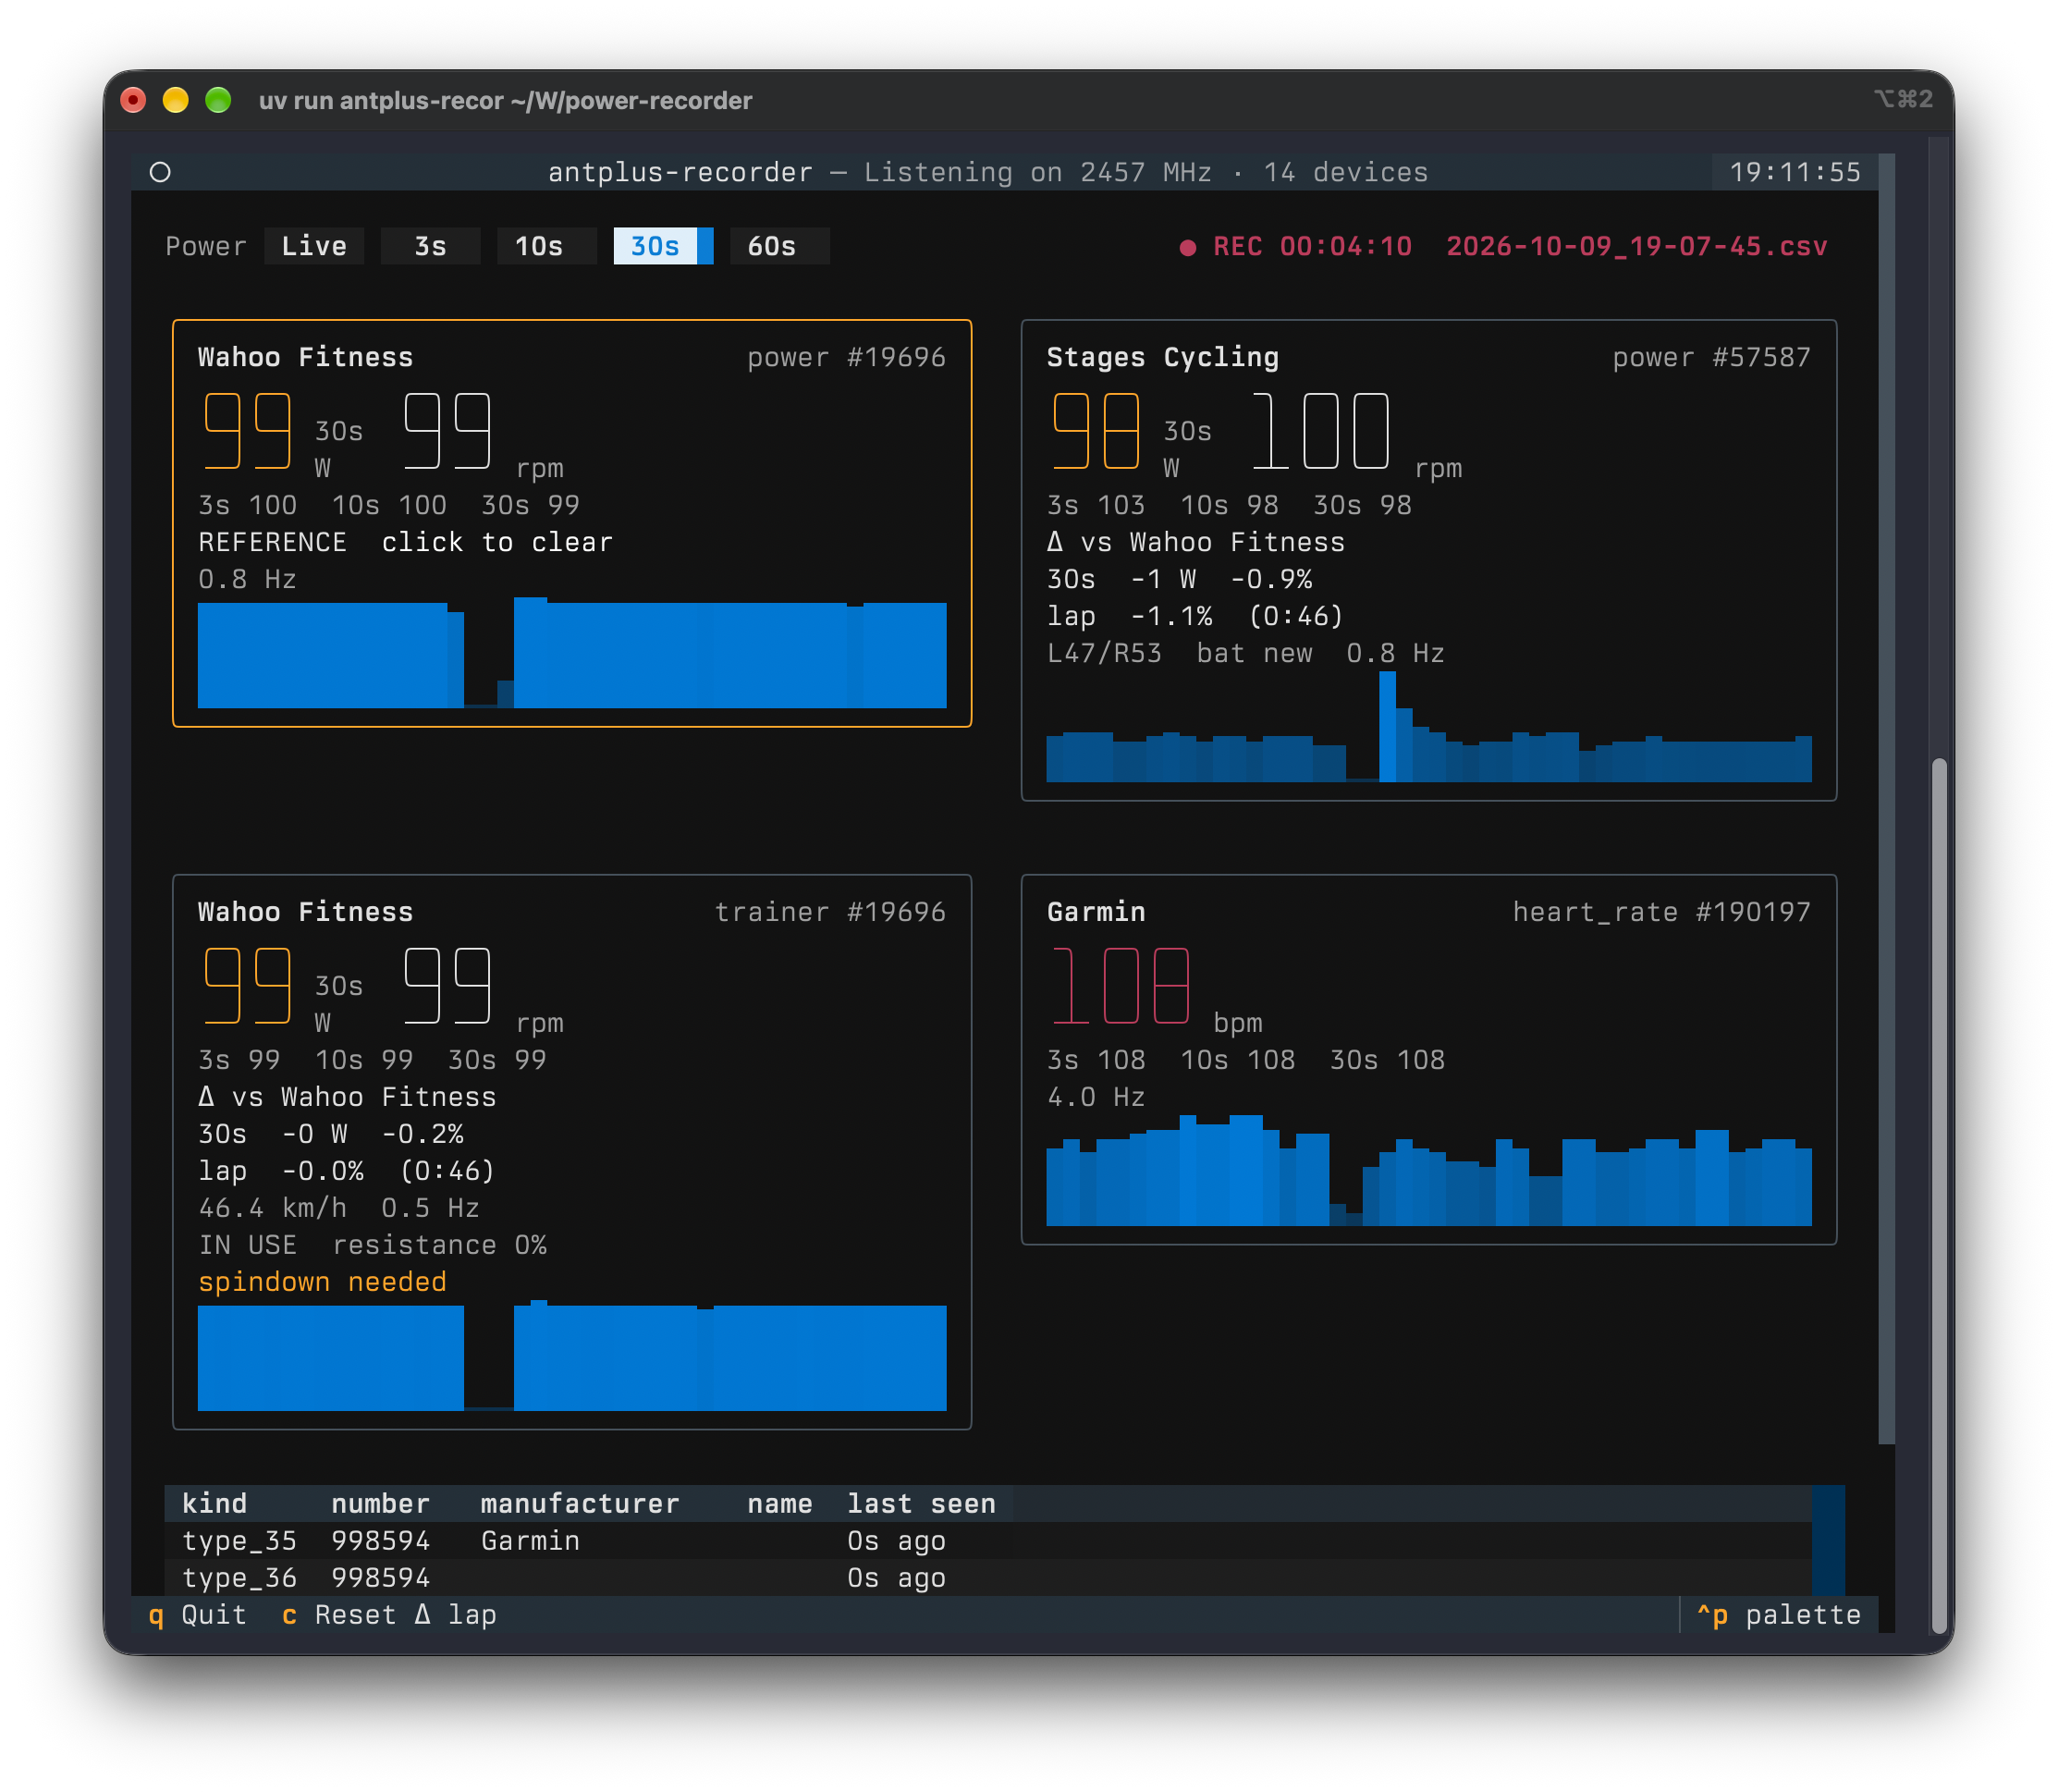
The Kickr in ERG mode at 100 W is the reference. Its power and trainer channels agree, the Stages crank reads 1.1% lower over the lap.
Install
Python ≥ 3.11 and an ANT+ USB stick (ANT USB2 or ANT USB-m, the usual Garmin/Dynastream ones).
uvx antplus-recorder            # run without installing
uv tool install antplus-recorder
pipx install antplus-recorder
libusb comes along with the libusb-package dependency, so a Mac needs nothing from Homebrew. If libusb is installed on the system, that one is used.
-
macOS: Plug the stick in and allow the accessory to connect when macOS asks.
-
Linux: The stick needs read/write access for your user. Untested, but this udev rule in
/etc/udev/rules.d/42-ant-usb-sticks.rulesshould do it, followed bysudo udevadm control --reload-rulesand replugging the stick:SUBSYSTEM=="usb", ATTRS{idVendor}=="0fcf", ATTRS{idProduct}=="1008", MODE="0666" SUBSYSTEM=="usb", ATTRS{idVendor}=="0fcf", ATTRS{idProduct}=="1009", MODE="0666"
Usage
antplus-recorder                       # show and record everything in range
antplus-recorder --no-record           # only show
antplus-recorder -o ~/Rides            # record somewhere else
antplus-recorder -d 57587 -d 19696     # only these device numbers
antplus-recorder --note "Kickr spindown done" --note "Stages zeroed"
antplus-recorder --fit-from 2026-10-09_18-57-53.csv
antplus-recorder --replay 2026-10-09_18-57-53.ant.gz
Recording starts right away, so it can't be forgotten. Files go to the folder you start the command in, named after the start time, and are never overwritten.
| Option | Default | Effect |
|---|---|---|
-o, --output-dir DIR |
current folder | Where recordings go. |
--no-record |
off | Only show, write no files. |
-d, --device NUMBER |
all | Only show and record this ANT+ device number. Repeat for more. Useful when other people's sensors are in range. |
--devices FILE |
devices.toml |
The device list, see Naming devices. |
--note TEXT |
A note for the raw log, e.g. bike, spindown, zero offset, the head unit's power factor. Repeat for more. | |
--fit-from CSV |
Build the FIT files for a recorded CSV, e.g. after a crash, then exit. | |
--replay LOG |
Recompute CSV and FIT files from a raw log with the current version and report reception, then exit. See Raw log and replay and Reception. |
Keys
| Key | Effect |
|---|---|
1–5 or the buttons |
Big power numbers, L/R balance and the difference show Live, 3 s, 10 s, 30 s or 60 s averages. |
| click a power tile | Make it the reference for comparing, click again to clear. |
c |
Start a new lap for the comparison. |
n |
Write a note into the raw log at this moment, e.g. "Stages zeroed". |
q |
Quit. Writes the FIT files. |
What a tile shows
- Power and cadence. Power is the average over the selected window, cadence is live.
- 3 s, 10 s and 30 s averages, always.
- The difference to the reference meter, see below.
- L/R balance for dual-sided meters, power-weighted over the selected window, battery and how often a new power value arrives (Hz).
- Smart trainers (FE-C): state (ready, in use, paused), resistance level, incline if sent, and warnings such as
spindown neededorERG: speed too low. - A trend line of the last two minutes, starting at 0 W.
Heart rate straps get a tile with bpm. Every other ANT+ device in range (watches, footpods, radars …) is listed in a table below.
Comparing power meters
Click the power meter you trust, for example the pedals or the crank. It gets an orange border and REFERENCE. Every other power tile then shows:
Δ vs Stages Cycling
30s  -7 W  -6.5%
lap  -6.8%  (4:12)
- The middle line compares the averages over the selected window. In Live mode it uses 30 s, because two meters never measure at the same instant and single readings make the difference jump.
- lap compares the work of both meters since the last
c. Seconds in which the reference is below 20 W (coasting) or one of the meters sends nothing don't count, and the time in brackets is only the counted seconds. Because it sums energy, a minute at 300 W weighs three times as much as a minute at 100 W. Presscat the start of every power level. - Changing the reference starts a new lap. The reference is saved in
devices.toml.
Use the lap, not the 30 s value, for corrections: over a few seconds, the reference's own noise shows up as a difference.
Example: With the crank as reference, a smart trainer shows -6.5%, so it reads 6.5% low. To really ride 200 W in ERG mode, set it to 200 × (1 − 0.065) ≈ 187 W.
For a clean number, warm up for 10 minutes, then do the trainer's spindown and the zero offset of the other meters, and ride a few minutes at each of several levels (100, 200, 300 W). That also shows whether the difference is a constant percentage or a fixed number of watts: 7 W are 7% at 100 W but only 2–3% at 300 W.
Files
CSV
2026-10-09_18-57-53.csv, one row per sensor and second, appended and flushed every second, so a crash loses at most the last second.
| Column | Content |
|---|---|
time |
Local time with UTC offset, ISO 8601. |
kind |
power, trainer or heart_rate. |
number |
ANT+ device number. |
name |
Name from devices.toml, else the manufacturer. |
value |
Watts or bpm, the mean of that second. |
unit |
W or bpm. |
cadence |
rpm. |
right_balance |
Right leg's share in %, dual-sided meters only. |
speed |
km/h, smart trainers only. |
A device that joins mid-ride (pedals woken up later) simply starts appearing in the rows. With pandas: df.pivot_table(index="time", columns=["kind", "number"], values="value").
FIT
When you quit, there is one FIT file per power source, e.g. 2026-10-09_18-57-53_power-57587_stages-cycling.fit, with power, cadence, L/R balance and the heart rate of the first strap, plus speed and distance for a smart trainer. Each file is a complete cycling activity (indoor cycling) with lap and session summary, so it can be uploaded anywhere and compared with tools like the DC Rainmaker Analyzer, which expect one file per power meter. A FIT file is only valid when complete, so it is built from the CSV at the end. After a crash, --fit-from builds it.
Raw log and replay
2026-10-09_18-57-53.ant.gz holds every ANT+ message exactly as the stick delivered it, nothing decoded. Whatever the app makes of the bytes belongs to the analysis, so an old log can be replayed with every newer version, e.g. after a decoding fix. About 1–3 MB per hour. It is flushed every second, so after a crash it is readable up to that point.
One tab-separated line per entry: type, seconds since start (monotonic, for exact intervals), unix time (to line the ride up with other devices, e.g. a head unit's FIT file), then the fields:
meta   0.0000  1791567846.535  started  2026-10-09T19:44:06+02:00
meta   0.0000  1791567846.535  note     Stages zeroed before start
meta   1.1732  1791567847.717  stick    serial 304363608, AP2USB1.05, USB 0fcf:1008, extended data 0xe0 (channel ID, RSSI, timestamp)
msg    1.3331  1791567847.868  10 9d ff 00 59 76 00 00 e0 f0 4c 0b 05 10 01 6d 00 5a 1a
note   8.1091  1791567854.214  Kickr spindown done
meta: start time, app version, command line, stick, notes from--note.msg: the 8-byte page, the flag byte and the channel ID (device number, type, transmission type). Where the stick supports it, also a signal block and the stick's own receive timestamp in 1/32768 s, the most exact clock there is. The timestamp wraps every 2 s.event: anything the stick reports besides data, such as a serial queue overflow, which explains a gap no sensor caused.note: a note typed in withnduring the ride.
The signal block is not a signal strength on the usual sticks. ANT defines two layouts: measurement type 0x20 is RSSI in dBm (3 bytes: type, RSSI, threshold), type 0x10 is a reading of the radio's automatic gain control (4 bytes: type, threshold offset, 16-bit register). The ANT USB2 and USB-m sticks are built on the nRF24AP2, which can't measure RSSI and sends the AGC block, e.g. 10 01 6d 00. By the reports below, its register stays the same at every distance until the messages stop, so it says nothing about reception. It stays in the log unchanged, and a stick with a newer chip that sends 0x20 gets real dBm values recorded. Sources: antgo #24, Nordic DevZone, ANT parameters.
--replay runs the messages through the current decoder and writes next to the log <ride>_replay.csv, its FIT files and <ride>_replay_reception.csv. It also prints the notes and the reception of every channel, see below.
Reception
Instead of a signal strength, --replay measures what arrived. Every ANT+ profile sends at a fixed period (heart rate every 8070/32768 s, power 8182, FE-C 8192), so the interval between two messages of a channel tells how many were missed:
channel                  period   usual  messages   loss    breaks   loss per minute (█ = 65.1%)
power #19696              250ms   250ms       271  24.7%         0   ▄▂
trainer #19696            250ms   750ms       132  63.1%         0   █▇
type_35 #998594          ~125ms   125ms       654   9.4%         0   ▂▁
- Per channel, not per device: a Kickr sends power and FE-C, a heart rate strap heart rate and a footpod profile, each with its own period and its own loss.
- period: what the profile prescribes. For profiles the app doesn't know (marked
~) it is estimated from the intervals. - usual: the median interval. Equal to the period with high loss means messages really get lost. A whole multiple of the period means the sensor sends less often than its profile says, or something hits the same slots every time: in the example, the Kickr's FE-C channel arrives every 750 ms instead of every 250 ms, its power channel at the period.
- breaks: more than 2 s without a message count as a break, not as loss, e.g. a power meter asleep while the cranks stand still. Counting starts over after a break.
- Intervals: the stick's timestamp gives the exact interval within its 2 s; the computer's clock only decides how many times it wrapped. Logs without stick timestamps use the computer's clock.
- loss per minute: one character per minute,
·no loss, blank no message. In scan mode, two sensors with almost the same period collide each time their send times drift past each other, which shows as loss in regular waves. Even loss, or loss on one sensor only, points to the radio or the sensor.<ride>_replay_reception.csvhas the numbers per channel and minute.
A gap in the reception explains a wrong value; a wrong value without a gap points to the decoder.
Naming devices
devices.toml in the current folder lists every device ever seen, filled in automatically:
[power.57587]
name = ""
manufacturer = "Stages Cycling"
model = 3
serial = 40618248
reference = true
Set name and the tile shows it right away, no restart needed. Names also go into the CSV and the FIT file names. A Kickr shows up twice, as power and as trainer: smart trainers send both profiles, so plain power meter displays can read them too.
How it works
- Scan mode: The stick runs in ANT continuous scan mode. It listens 100% of the time on 2457 MHz and receives every sensor, with no pairing and no limit of 8 channels. The same sensor can still be paired with a bike computer or Zwift at the same time, because ANT+ sensors broadcast. The flip side: scan mode only receives, so the app can't control a trainer. Use the trainer's own app for ERG.
- Power between pages: Torque-based meters send the page with the power value only every few messages. The app computes the average from the accumulated power and the event counter, so the power of every pedal stroke counts, not just the latest one.
- Coasting: A meter keeps repeating its last value while the cranks stand still. If the event counter hasn't moved for 3 s, the app shows 0 W, like head units do.
- Recording: If a second gets no new power value, the last one is held while the sensor is still sending, again like head units with 1 s recording.
- Every message: The stick is asked to add a signal block and its receive timestamp to each message. That also keeps openant from dropping a message that repeats the previous one byte for byte, so the raw log really has all of them.
Troubleshooting
- No ANT+ USB stick found: Check that the system sees it (macOS: allow the accessory; Linux: udev rule above).
- No permission to use the ANT+ USB stick (Linux): Add the udev rule above, reload the rules and plug the stick in again.
- Stick is used by another app: Only one program can use the stick. Close Zwift, Garmin Express or another
antplus-recorder. - This stick can't do continuous scan mode: The original ANT USB1 and other nRF24AP1 sticks only pair one channel at a time. Any ANT USB2, ANT USB-m or newer stick works.
- No libusb found:
libusb-packagebundles libusb for macOS, x86_64 and arm64 Linux and Windows. Elsewhere (e.g. 32-bit Raspberry Pi OS) install it from the system, e.g.apt install libusb-1.0-0. - The ANT+ USB stick was disconnected: The session ends and the files are written as when quitting with
q. Plug the stick in again and start a new session. - Stick didn't answer, resetting it: After a crash or kill the stick can hang once. The app resets it on its own, which takes about 3 s.
- No sensors found: Sensors sleep until they move. Pedal a few turns, put on the heart rate strap.
- Two scrollbars at the right edge in iTerm2: iTerm2 extends the last column into the window margin. Settings → Advanced → "Extend background color into margins in alternate screen mode?" → No (textual#6230).
Limitations
- Receives only, no trainer control (see scan mode above).
- Tested on macOS with an ANT USB2 stick, a Wahoo Kickr, a Stages crank and a Garmin heart rate strap. Linux is untested.
- A Kickr sends the power page on its trainer channel only rarely, sometimes more than 10 s apart, so its
trainertile reacts slowly. Itspowertile updates about once per second and is the better one to compare. - Many sensors on one frequency collide more often. Untested beyond a handful of real sensors; the display itself was tested with 40 simulated ones.
Development
just run                  # run the dashboard from the repo
just test                 # pytest
just lint                 # ruff with all rules (config in pyproject.toml)
just build                # sdist and wheel into dist/
Releases go out through GitHub Actions: git tag v0.2.0 && git push --tags runs ruff and the tests and publishes to PyPI with Trusted Publishing. The tag has to match the version in pyproject.toml.
License
MIT
1 maintainer

Metadata
1 maintainer
Release files for antplus-recorder 0.4.0
For a detailed explanation of source distributions (sdists) and built distributions (wheels), please see the package formats documentation.
Source distribution (sdist)
| File | Size | Uploaded | |
|---|---|---|---|
| antplus_recorder-0.4.0.tar.gz | 33.9 kB | Details |
Built distribution (wheel)
| File | Interpreter | ABI | Platform | Reset |
|---|---|---|---|---|
| antplus_recorder-0.4.0-py3-none-any.whl | Python 3 | none | any | Details |
Total release size: 70.5 kB
Release files / antplus_recorder-0.4.0.tar.gz
| Download URL | antplus_recorder-0.4.0.tar.gz |
|---|---|
| Size | 33.9 kB |
| Tags | Source |
|
SHA-256 checksum How to use checksums |
b3df05efb337faf13761436fb80b4b93cbf7354b866f66139ffea6be8ed385d8
|
|
BLAKE2b-256 checksum How to use checksums |
3c79cfc95d655d12cd8bb087a36929d0b4524988047ec378bb97f836e4c61f2c
|
| Upload date | |
|
Uploaded using Trusted Publishing? What is trusted publishing? |
Yes |
| Uploaded via |
twine/7.0.0 CPython/3.13.14
|
Provenance
Provenance describes where a file came from. On PyPI, provenance is shared via attestations, which provide a verifiable record of the build or publishing details. View details, limitations and caveats.


PyPI Publish Attestation
PyPI verified that this artifact, at this checksum, originated from the publisher listed below.
Signed by GitHub Actions, verified by PyPI on Oct 10, 2026.
Transparency logRelease files / antplus_recorder-0.4.0-py3-none-any.whl
| Download URL | antplus_recorder-0.4.0-py3-none-any.whl |
|---|---|
| Size | 36.6 kB |
| Tags | Python 3 |
|
SHA-256 checksum How to use checksums |
6956ef44499635ab3d5a9c04816a597e18b078690ecee79af5a15df64a1e28a8
|
|
BLAKE2b-256 checksum How to use checksums |
663add95f931e48faa0b58a8a72689d4cbe1be125efc770fddfdacb9e03132f0
|
| Upload date | |
|
Uploaded using Trusted Publishing? What is trusted publishing? |
Yes |
| Uploaded via |
twine/7.0.0 CPython/3.13.14
|
Provenance
Provenance describes where a file came from. On PyPI, provenance is shared via attestations, which provide a verifiable record of the build or publishing details. View details, limitations and caveats.
PyPI Publish Attestation
PyPI verified that this artifact, at this checksum, originated from the publisher listed below.
Signed by GitHub Actions, verified by PyPI on Oct 10, 2026.
Transparency log













