Advanced Pipeline for Simple yet Comprehensive AnaLysEs of DNA metabarcoding data - Graphical User Interface
Project description
APSCALE graphical user interface
Advanced Pipeline for Simple yet Comprehensive AnaLysEs of DNA metabarcoding data
Introduction
The APSCALE Graphical User Interface is a metabarcoding pipeline that handles the most common tasks in metabarcoding pipelines like paired-end merging, primer trimming, quality filtering, otu clustering and denoising. It uses a Graphical interface and is configured via a single configuration file. It automatically uses the available ressources on the machine it runs on while still providing the option to use less if desired.
For more information on the pipeline running in the background visit APSCALE.
Installation
APSCALE can be installed on all common operating systems (Windows, Linux, MacOS). APSCALE requires Python 3.7 or higher and can be easily installed via pip in any command line:
pip install apscale_gui
To update apscale_gui run:
pip install --upgrade apscale_gui
Further dependencies - vsearch
APSCALE calls vsearch for multiple modules. It should be installed and be in PATH to be executed from anywhere on the system.
Check the vsearch Github page for further info:
https://github.com/torognes/vsearch
Support for compressed files with zlib is necessary. For Unix based systems this is shipped with vsearch, for Windows the zlib.dll can be downloaded via:
The dll has to be in the same folder as the vsearch executable. If you need help with adding a folder to PATH in windows please take a look at the first answer on this stackoverflow issue:
How to add a folder to PATH Windows
To check if everything is correctly set up please type this into your command line:
vsearch --version
It should return a message similar to this:
vsearch v2.19.0_win_x86_64, 31.9GB RAM, 24 cores
https://github.com/torognes/vsearch

Rognes T, Flouri T, Nichols B, Quince C, Mahe F (2016)
VSEARCH: a versatile open source tool for metagenomics
PeerJ 4:e2584 doi: 10.7717/peerj.2584 https://doi.org/10.7717/peerj.2584

Compiled with support for gzip-compressed files, and the library is loaded.
zlib version 1.2.5, compile flags 65
Compiled with support for bzip2-compressed files, but the library was not found.
Further dependencies - cutadapt
APSCALE also calls cutadapt with some modules. Cutadapt should be downloaded and installed automatically with the APSCALE installation. To check this, type:
cutadapt --version
and it should return the version number, for example:
3.5
Further dependencies - blastn
APSCALE also calls blastn for the local blast modules. It should be installed and be in PATH to be executed from anywhere on the system.
Check the BLAST Software home page:
https://blast.ncbi.nlm.nih.gov/Blast.cgi?PAGE_TYPE=BlastDocs&DOC_TYPE=Download
you can download it from here:
https://ftp.ncbi.nlm.nih.gov/blast/executables/blast+/LATEST/
To check this, type:
blastn -version
and it should return the version number, for example:
blastn: 2.12.0+ Package: blast 2.12.0, build Jun 4 2021 04:06:33
Tutorial
Creating a new project
Create a new folder (e.g. on your desktop) and name it for example: 'APSCALE_projects'.
Now run the APSCALE GUI with:
python -m apscale_gui or simply apscale_gui
You will be asked to select an output directory.
Select the folder you just created ('APSCALE_projects').
Now create a new project using the GUI by typing your desired name of the project (e.g. My_new_project'). A new folder in your output directory will be created.
Already existing project folders can be loaded from here in the future.
In this case a new, blank project folder was created.

Data structure
APSCALE is organized in projects with the following structure:
/YOUR_PROJECT_PATH/My_new_project/
├───1_raw data
│   └───data
├───2_demultiplexing
│   └───data
├───3_PE_merging
│   └───data
├───4_primer_trimming
│   └───data
├───5_quality_filtering
│   └───data
├───6_dereplication_pooling
│   └───data
│       ├───dereplication
│       └───pooling
├───7_otu_clustering
│   └───data
├───8_denoising
│   └───data
└───9_lulu_filtering
    ├───denoising
    │   └───data
    └───otu_filtering
        └───data
Input data
APSCALE expects demultiplexed .fastq.gz files in the 2_demultiplexing/data folder (see above).
APSCALE expects the paired-end reads to end on e.g. _R1.fastq.gz and _R2.fastq.gz! If APSCALE crashes and you need to rename your files you can simply use the rename tool integrated in APSCALE.
If you prefer to have your data all in one place you can copy the raw data into 1_raw_data/data. However, demultiplexing won't be handled by APSCALE directly, but the GUI version has a demultiplexing tool implemented (see https://github.com/DominikBuchner/demultiplexer).
The interface
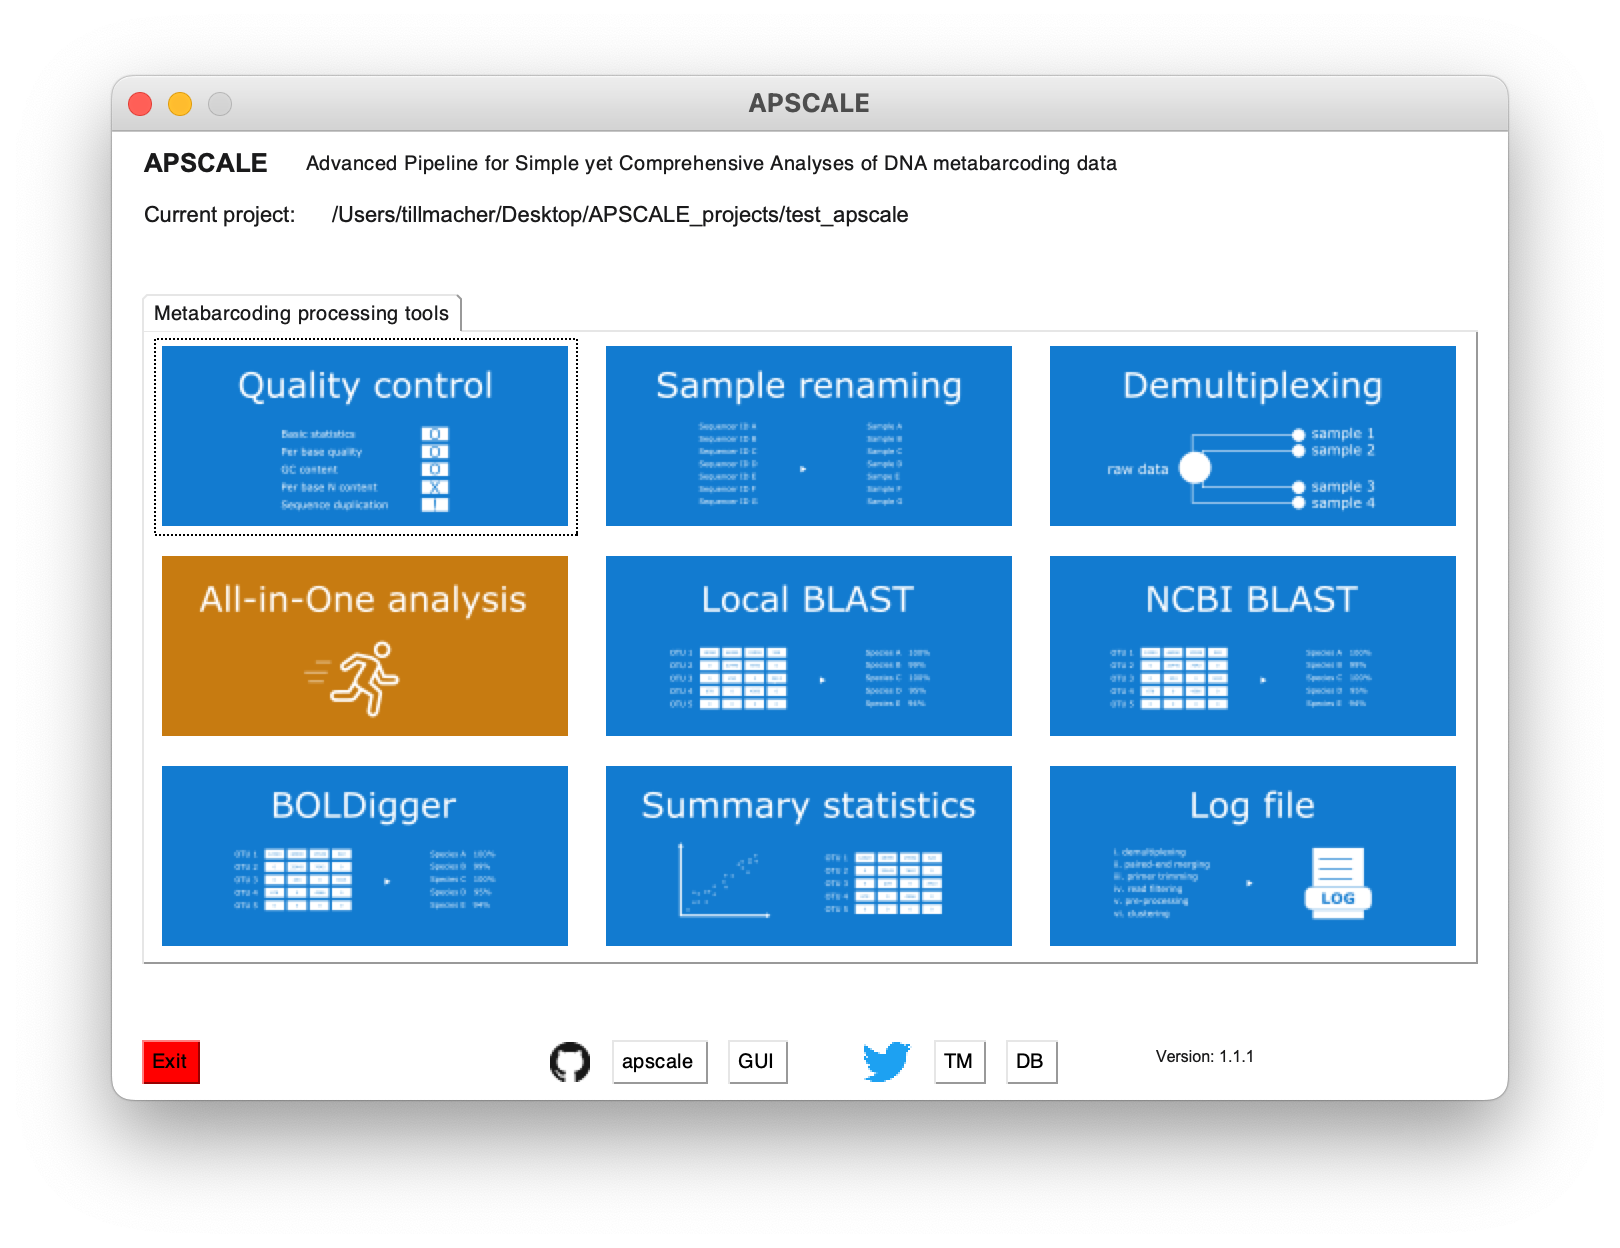
When loading a project you will be greeted by the APSCALE home window.
From here a multitude of DNA metabarcoding related tools can be started.
Running apscale: All-in-One Analysis
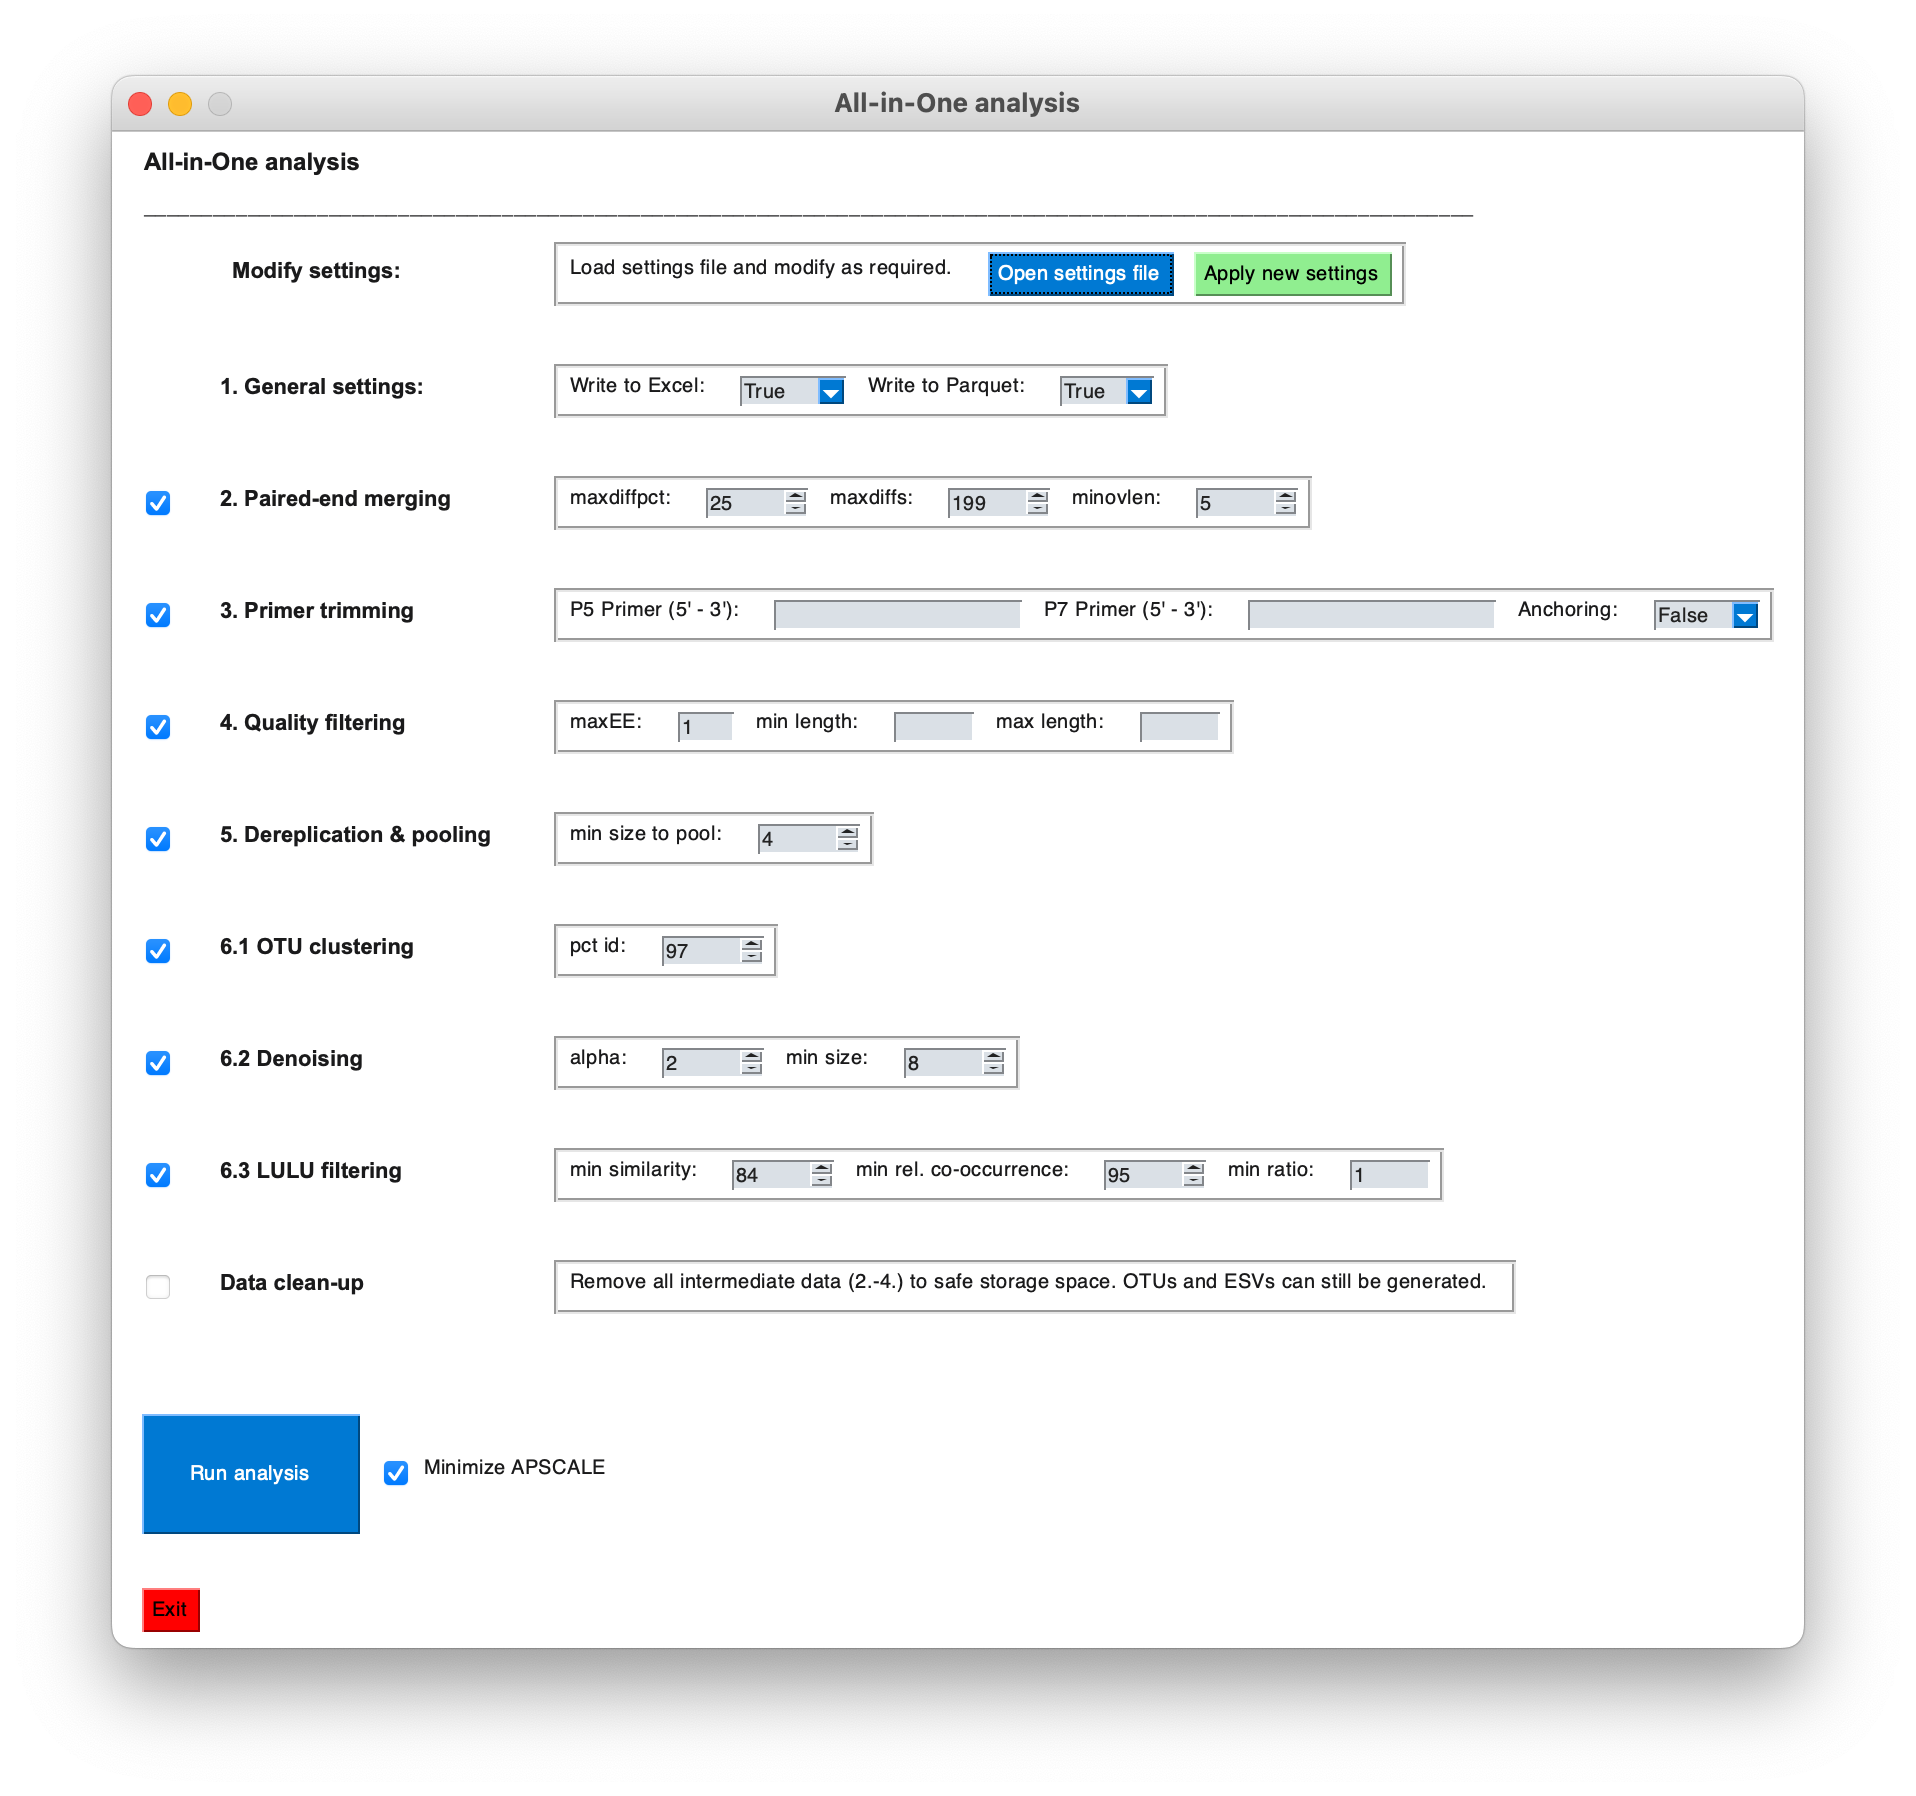
The APSCALE pipeline can easily be started via the All-in-One window.
First, the settings need to be adjusted. Therefore, one can either adjust the settings from within the GUI and apply them via the green button. Or one can open the settings file (either from within the GUI or from the project folder) and adjust all settings according to the data set.
Most settings can be left on default. However, following settings need to be adjusted:
- Forward primer sequence (in 5'-3' orientation)
- Reverse primer sequence (in 5'-3' orientation)
- Length of the target fragment (after primer trimming)
To run APSCALE, simply select the steps to perform, click on 'Run analysis' and sit back and enjoy!
Output
APSCALE will create following output files (that are relevant for downstream analyses):
- Lulu-filtered OTU table (.xlsx and .snappy)
- Lulu-filtered OTU sequences (.fasta)
- Lulu-filtered ESV table (.xlsx and .snappy)
- Lulu-filtered ESV sequences (.fasta)
These files can be used for taxonomic assignment. For example, for COI sequences, BOLDigger (https://github.com/DominikBuchner/BOLDigger) can be used directly with the output of APSCALE to assign taxomoy to the OTUs / ESVs using the Barcode of Life Data system (BOLD) database. Furthermore, the ESV and OTU tables are compatible with TaxonTableTools (https://github.com/TillMacher/TaxonTableTools), which can be used for DNA metabarcoding specific analyses.
Click here to an exemplary APSCALE project
/YOUR_PROJECT_PATH/My_new_project/
├───1_raw data
│   └───data
│       ├───raw_data_R1.fastq.gz
│       └───raw_data_R2.fastq.gz
├───2_demultiplexing
│   └───data
│       ├───SAMPLE_1_a_R1.fastq.gz
│       ├───SAMPLE_1_a_R2.fastq.gz
│       ├───SAMPLE_1_b_R1.fastq.gz
│       ├───SAMPLE_1_b_R2.fastq.gz
│       ├───SAMPLE_2_a_R1.fastq.gz
│       ├───SAMPLE_2_a_R2.fastq.gz
│       ├───SAMPLE_2_b_R1.fastq.gz
│       ├───SAMPLE_2_b_R2.fastq.gz
│       └───...
├───3_PE_merging
│   └───data
│       ├───SAMPLE_1_a_PE.fastq.gz
│       ├───SAMPLE_1_b_PE.fastq.gz
│       ├───SAMPLE_2_a_PE.fastq.gz
│       ├───SAMPLE_2_b_PE.fastq.gz
│       └───...
├───4_primer_trimming
│   └───data
│       ├───SAMPLE_1_a_PE_trimmed.fastq.gz
│       ├───SAMPLE_1_b_PE_trimmed.fastq.gz
│       ├───SAMPLE_2_a_PE_trimmed.fastq.gz
│       ├───SAMPLE_2_b_PE_trimmed.fastq.gz
│       └───...
├───5_quality_filtering
│   └───data
│       ├───SAMPLE_1_a_PE_trimmed_filtered.fastq.gz
│       ├───SAMPLE_1_b_PE_trimmed_filtered.fastq.gz
│       ├───SAMPLE_2_a_PE_trimmed_filtered.fastq.gz
│       ├───SAMPLE_2_b_PE_trimmed_filtered.fastq.gz
│       └───...
├───6_dereplication_pooling
│   └───data
│       ├───dereplication
│       │   ├───SAMPLE_1_a_PE_trimmed_filtered_dereplicated.fastq.gz
│       │   ├───SAMPLE_1_b_PE_trimmed_filtered_dereplicated.fastq.gz
│       │   ├───SAMPLE_2_a_PE_trimmed_filtered_dereplicated.fastq.gz
│       │   ├───SAMPLE_2_b_PE_trimmed_filtered_dereplicated.fastq.gz
│       │   └───...
│       └───pooling
│           ├───pooled_sequences_dereplicated.fasta.gz
│           └───pooled_sequences.fasta.gz
├───7_otu_clustering
│   └───data
│   ├───tutorial_apscale_OTU_table.parquet.snappy
│   ├───tutorial_apscale_OTU_table.xlsx
│   └───tutorial_apscale_OTUs.fasta
├───8_denoising
│   └───data
│   ├───tutorial_apscale_ESV_table.parquet.snappy
│   ├───tutorial_apscale_ESV_table.xlsx
│   └───tutorial_apscale_ESVs.fasta
└───9_lulu_filtering
    ├───denoising
    │   └───data
    │   ├───tutorial_apscale_ESV_table_filtered.parquet.snappy
    │   ├───tutorial_apscale_ESV_table_filtered.xlsx
    │   └───tutorial_apscale_ESVs_filtered.fasta
    └───otu_clustering
        └───data
        ├───tutorial_apscale_OTU_table_filtered.parquet.snappy
        ├───tutorial_apscale_OTU_table_filtered.xlsx
        └───tutorial_apscale_OTUs_filtered.fasta
APSCALE modules
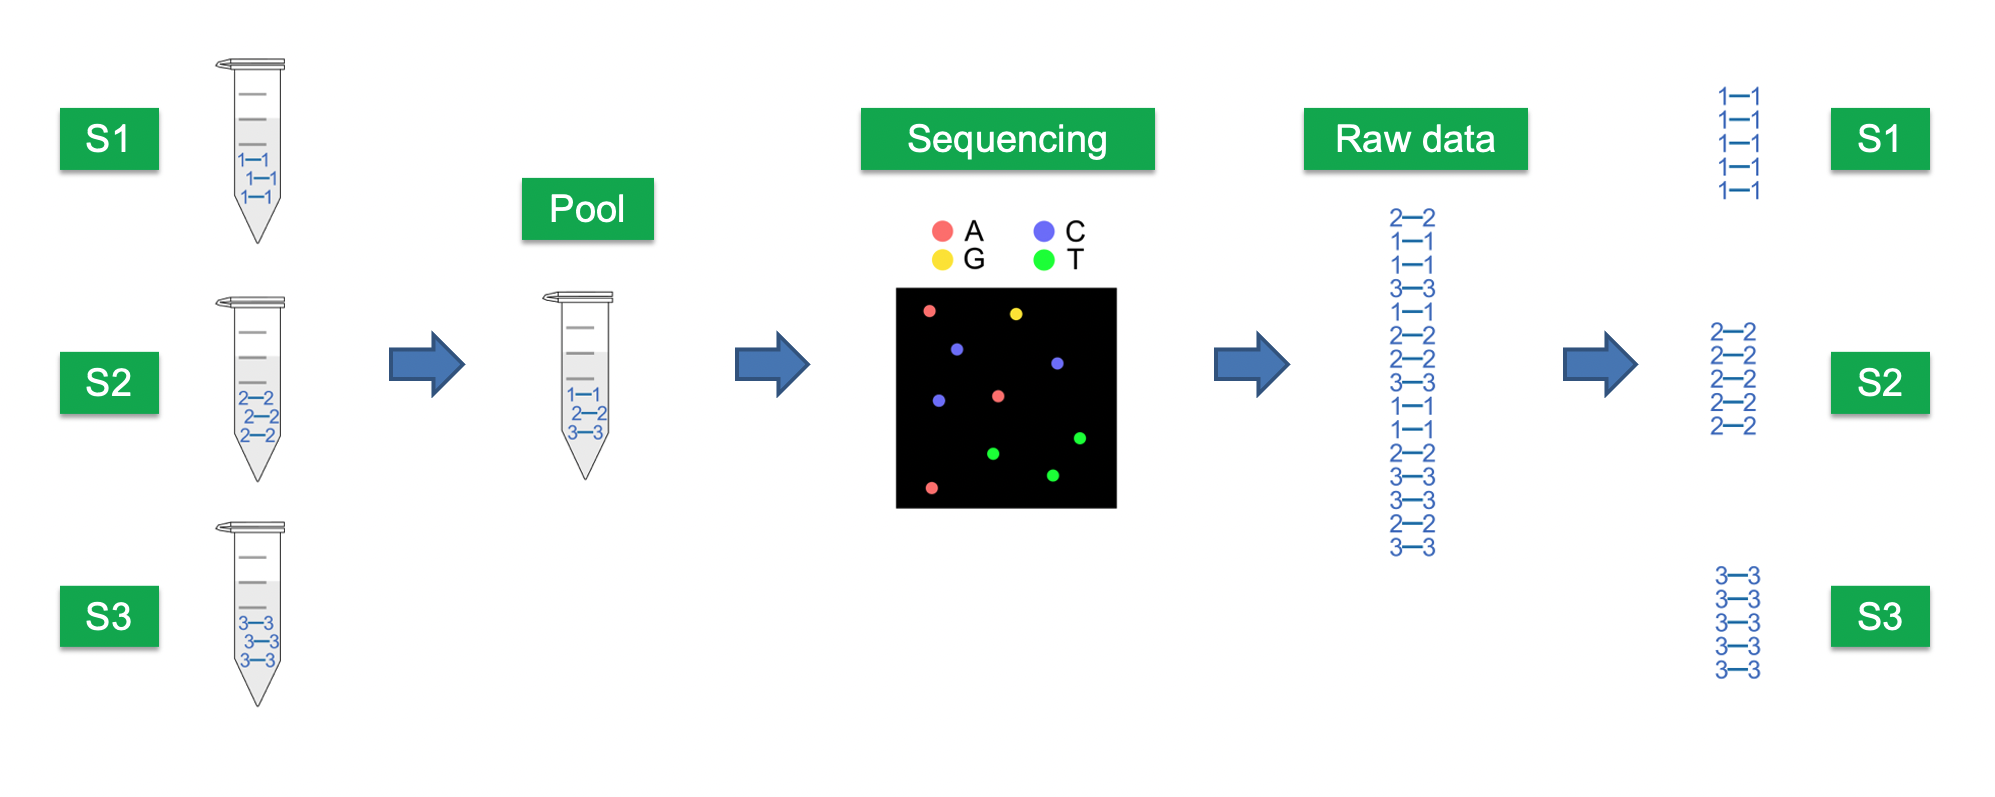
Demultiplexing
Learn more
Raw reads are demultiplexed into individual files, based on indiced and/or tags (see Bohmann et al., 2022 for an overview)
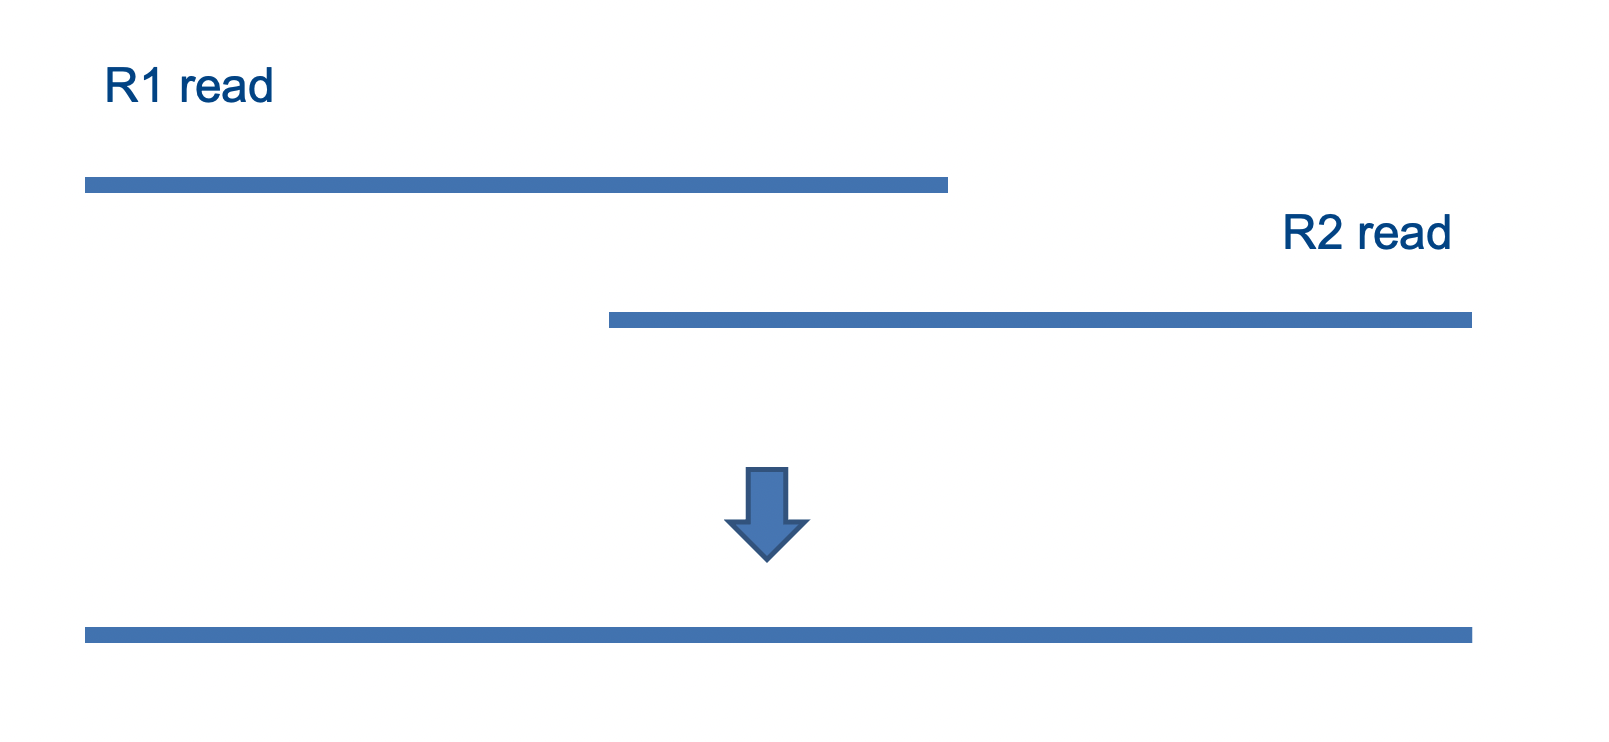
Paired-end merging
Learn more
Paired-end reads are merged into a single read.
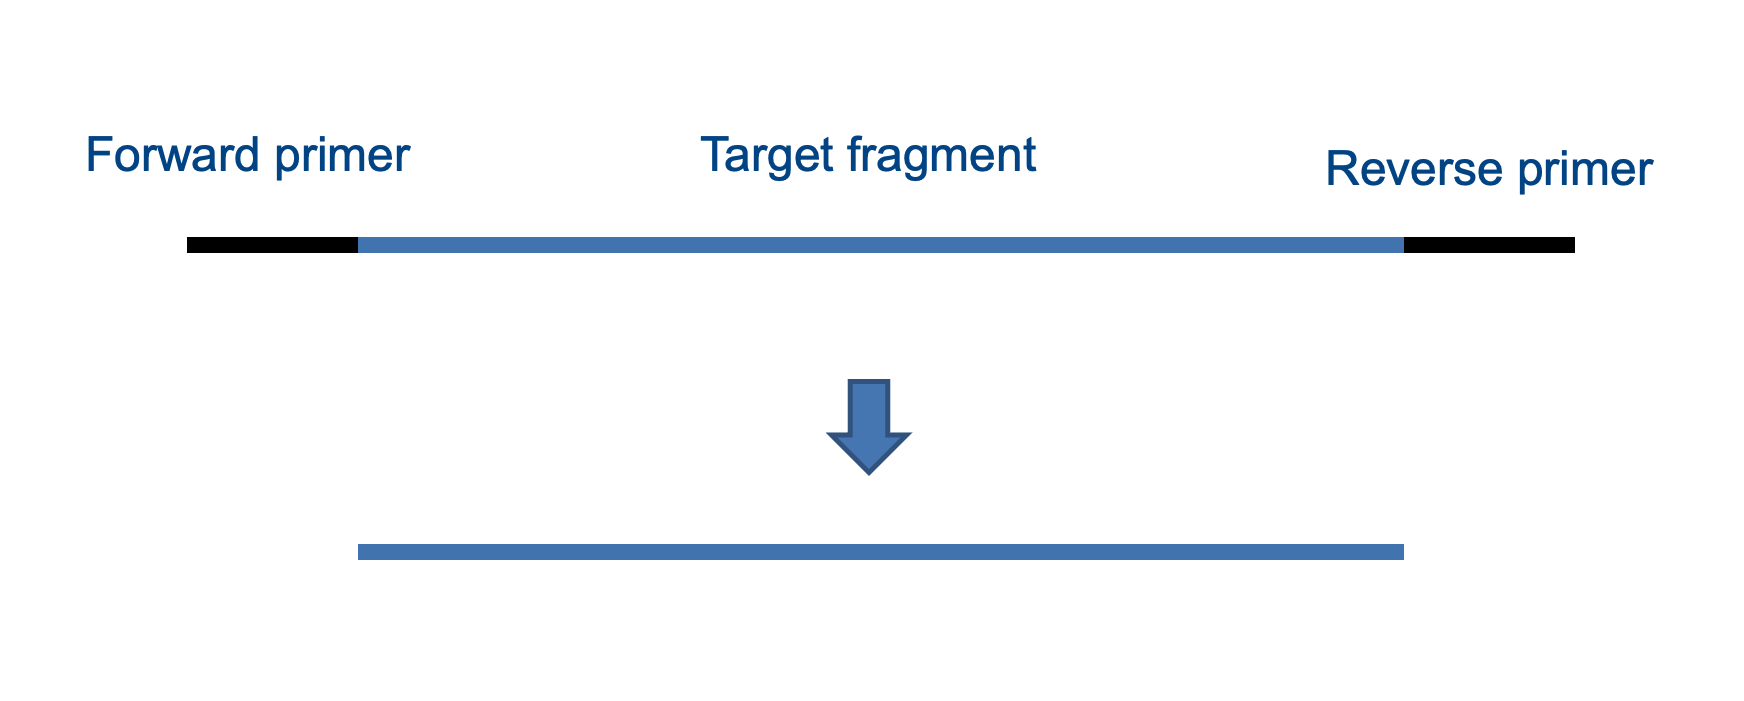
Primer trimming
Learn more
Adapter or primer sequences are removed from each read.
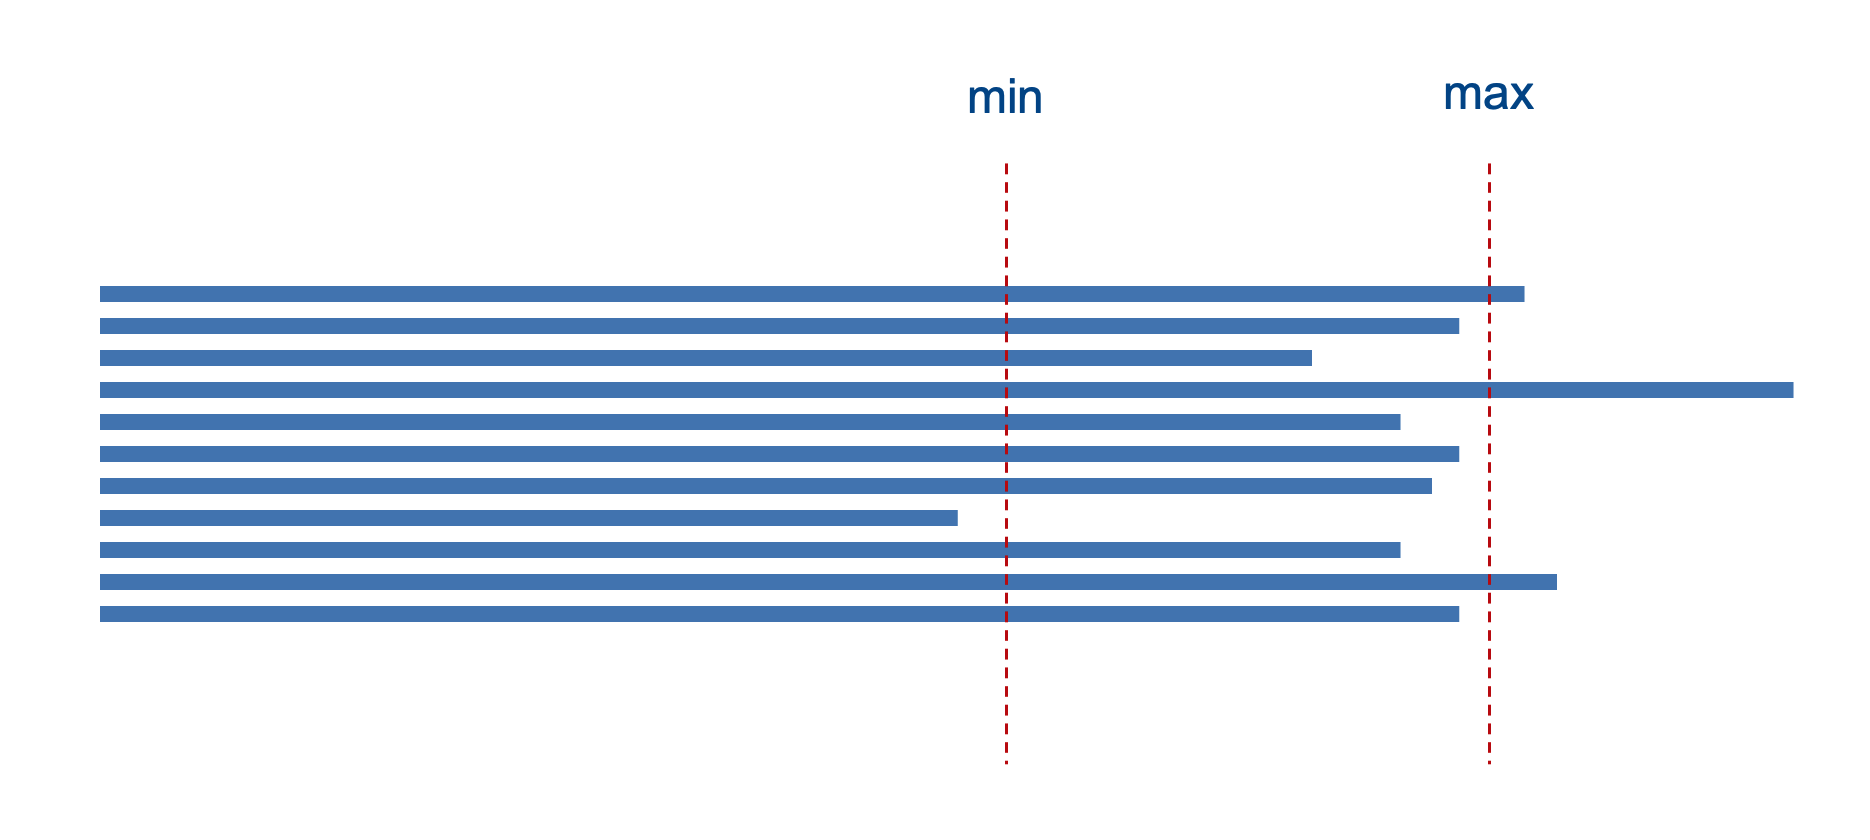
Quality & length filtering
Learn more
Reads are filtered according to the expected length of the target fragment. Usually a certain threshold around the expected length is applied (e.g., +-10 of the target fragment length).
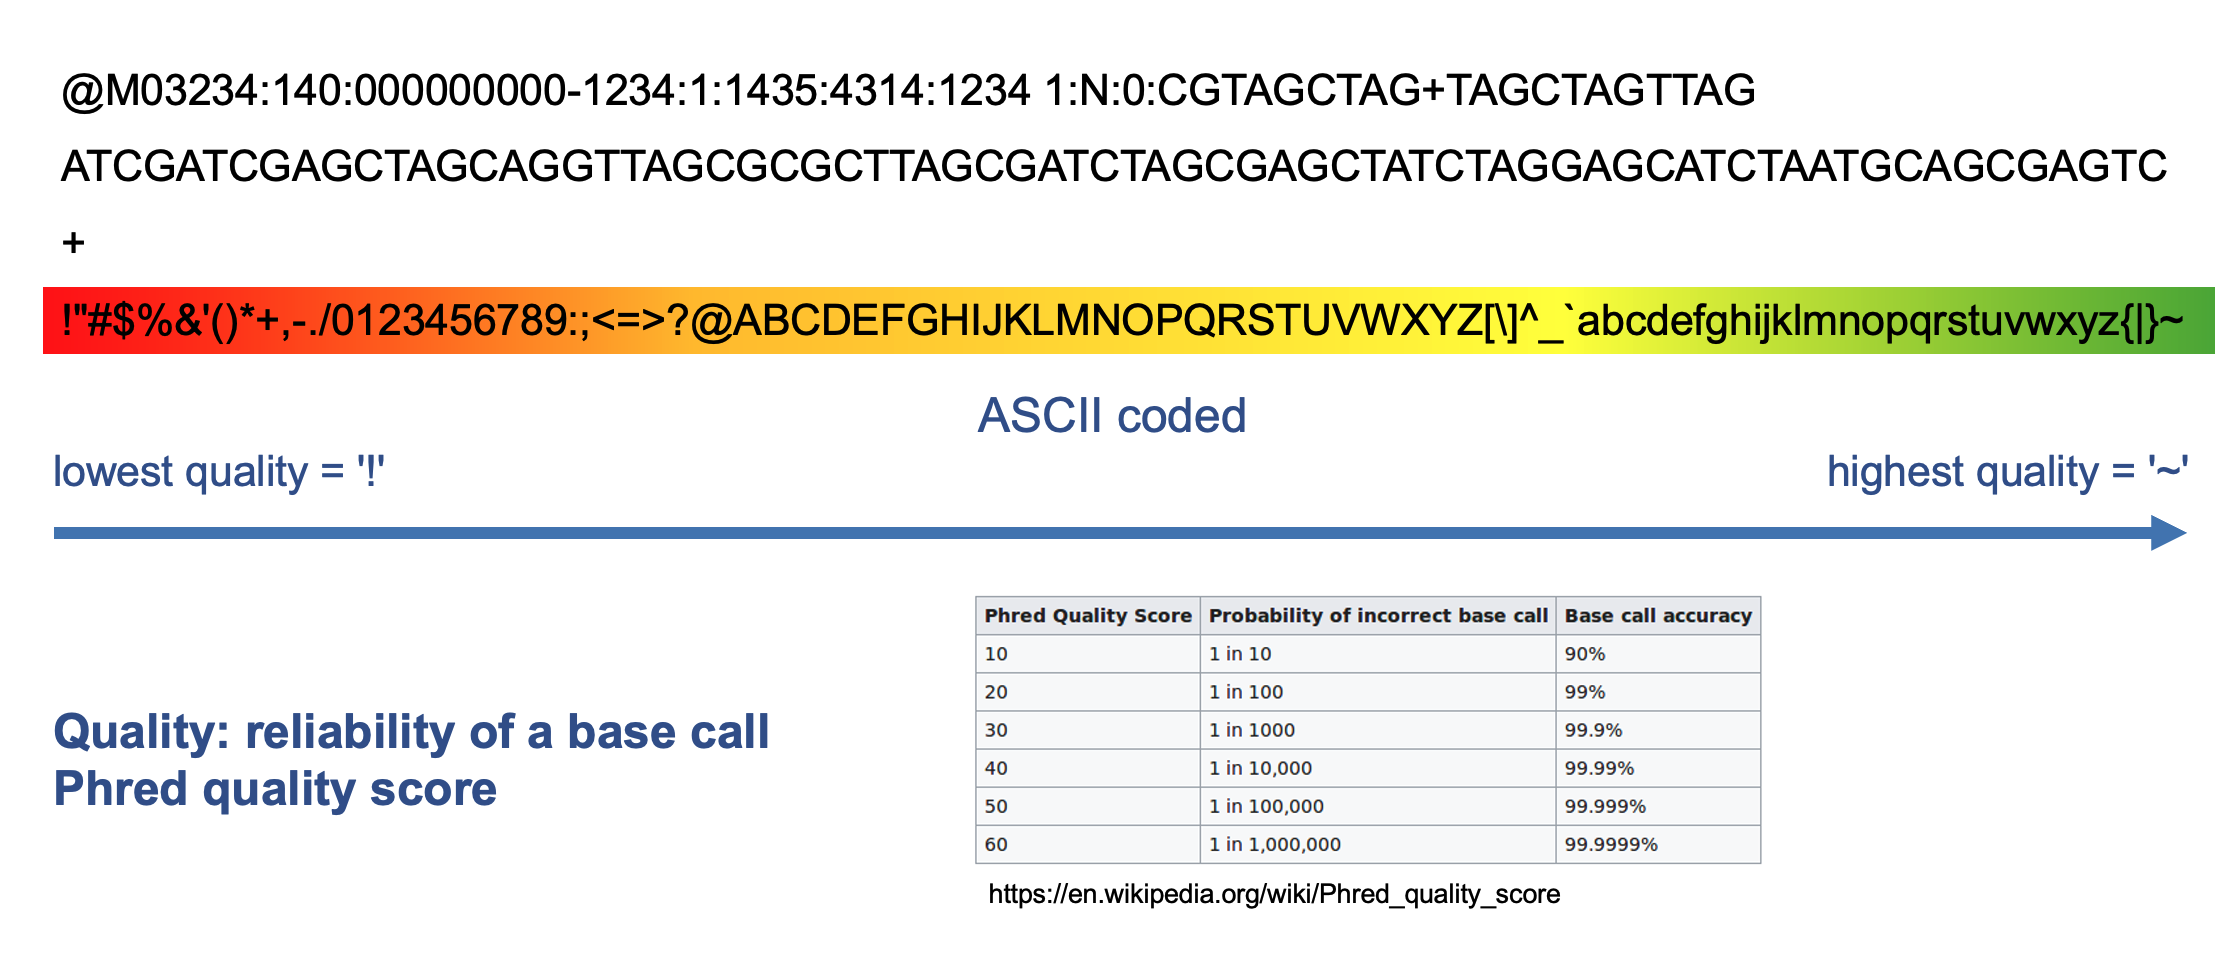
Additionally reads are filtered by quality. APSCALE uses the 'maximum expected error' value for quality filtering, which is calculated based on Phred quality score. You can learn more about quality filtering in the usearch documentation.
Dereplication & pooling
Learn more
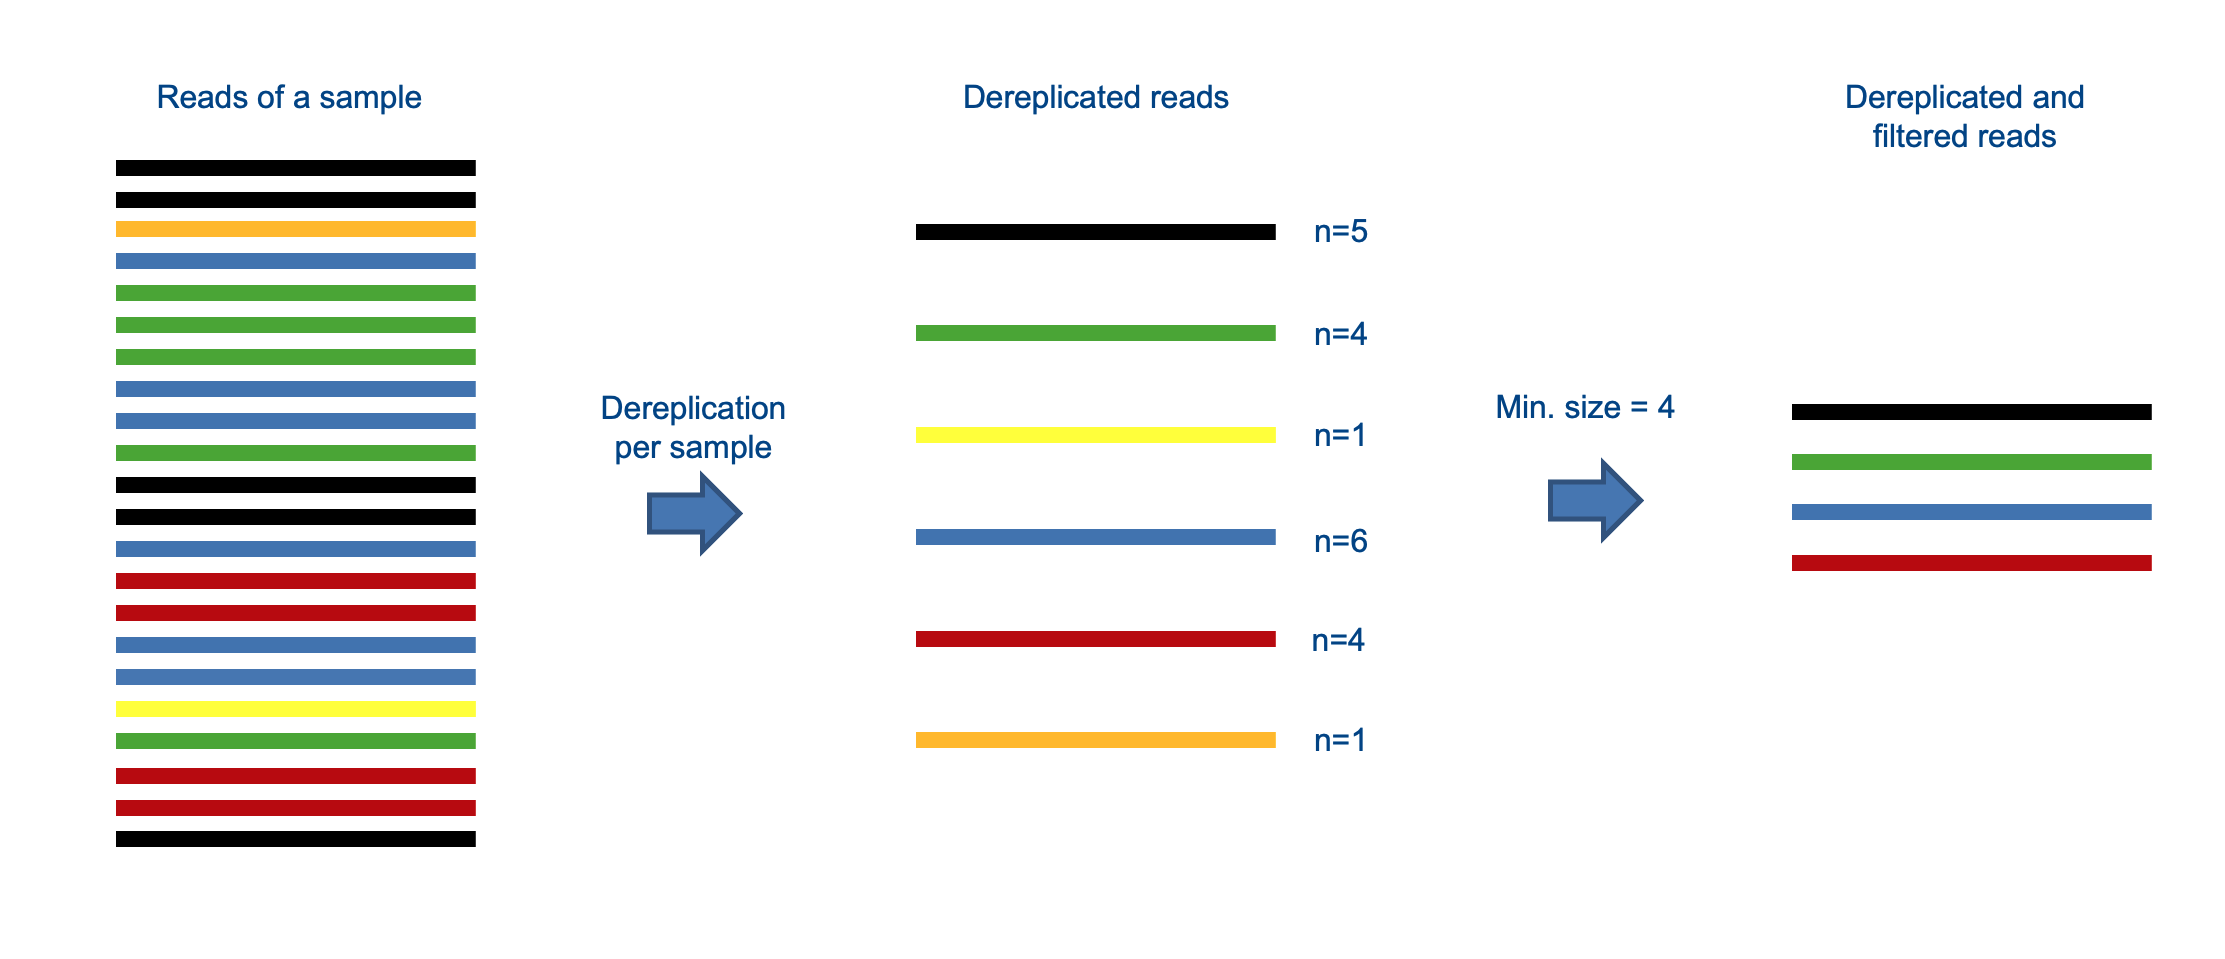
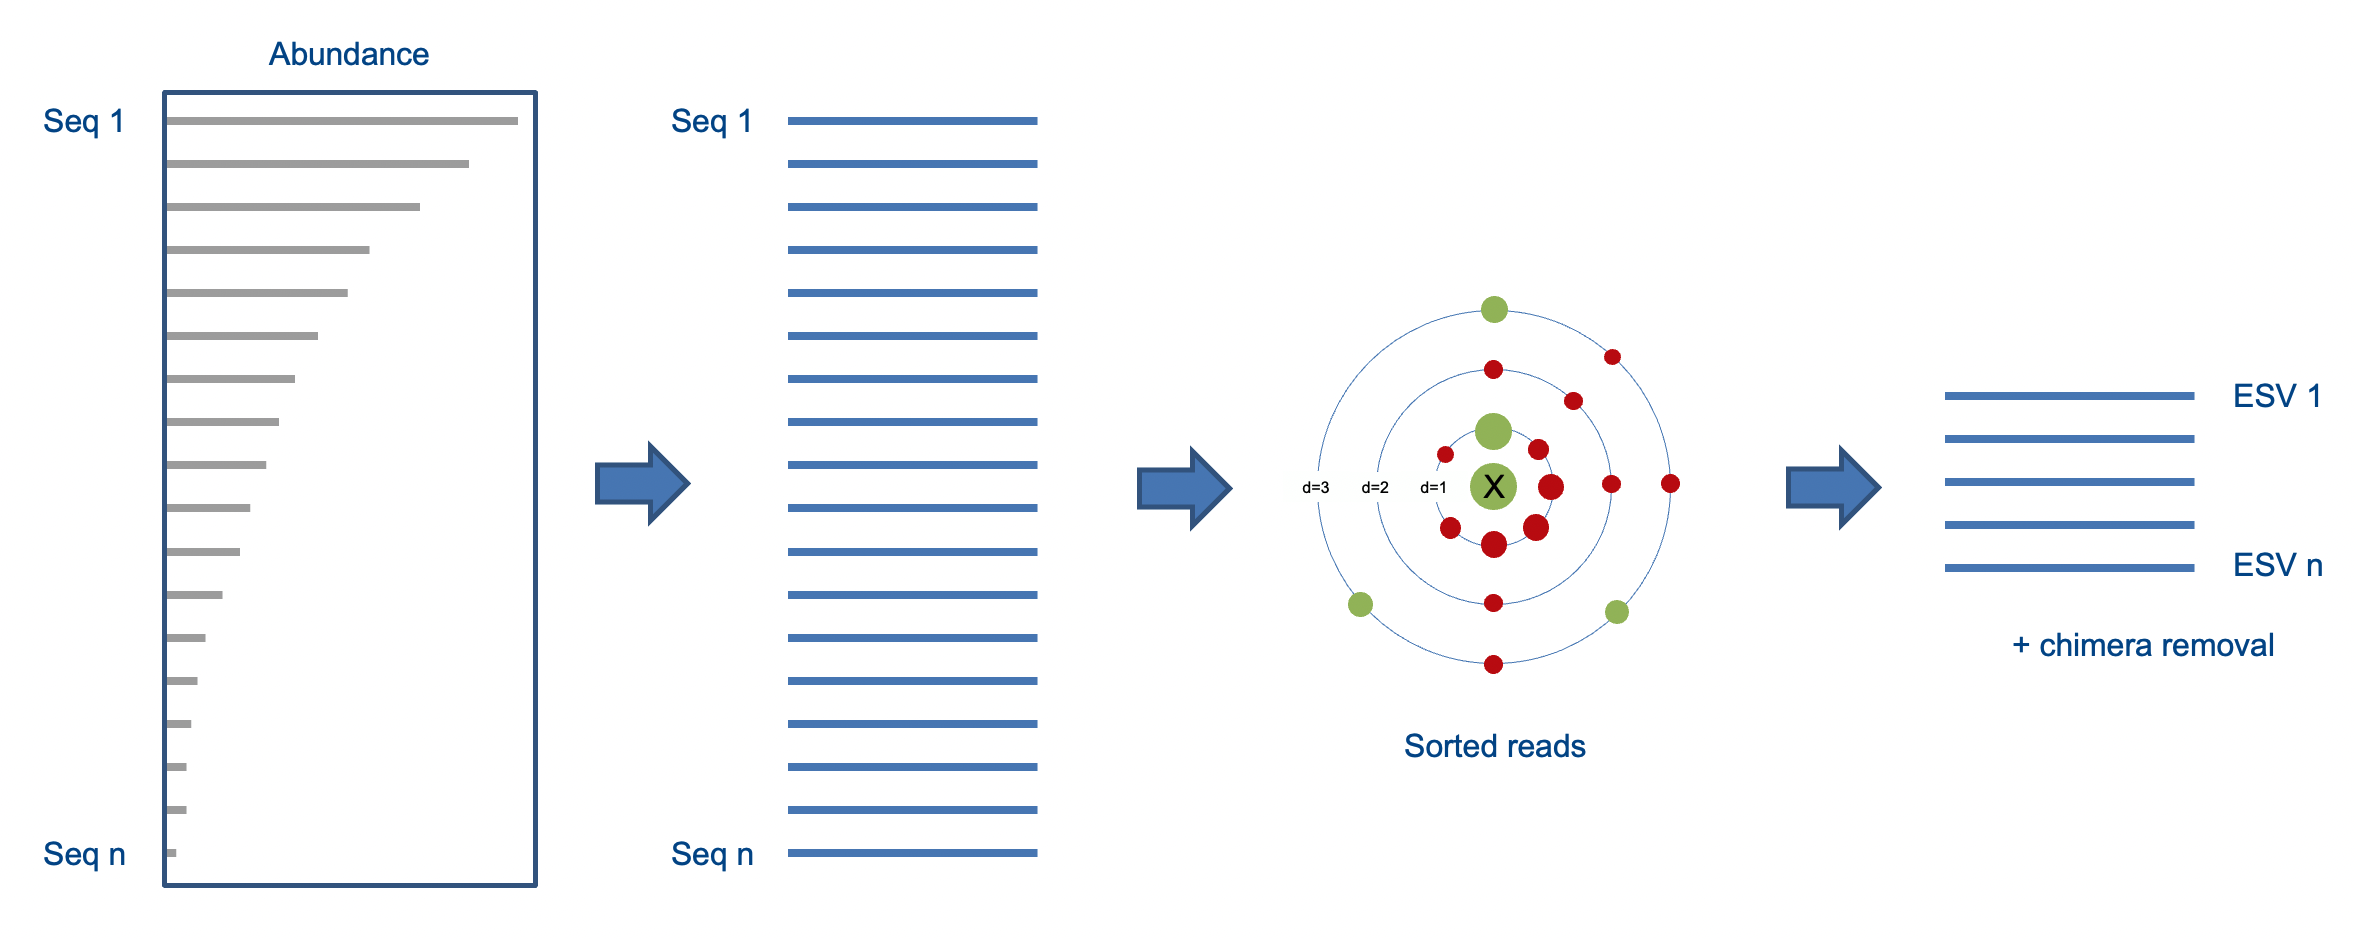
Initially, reads are dereplicated per sample. Only reads with an abundance of at least 4 (default value) are kept.
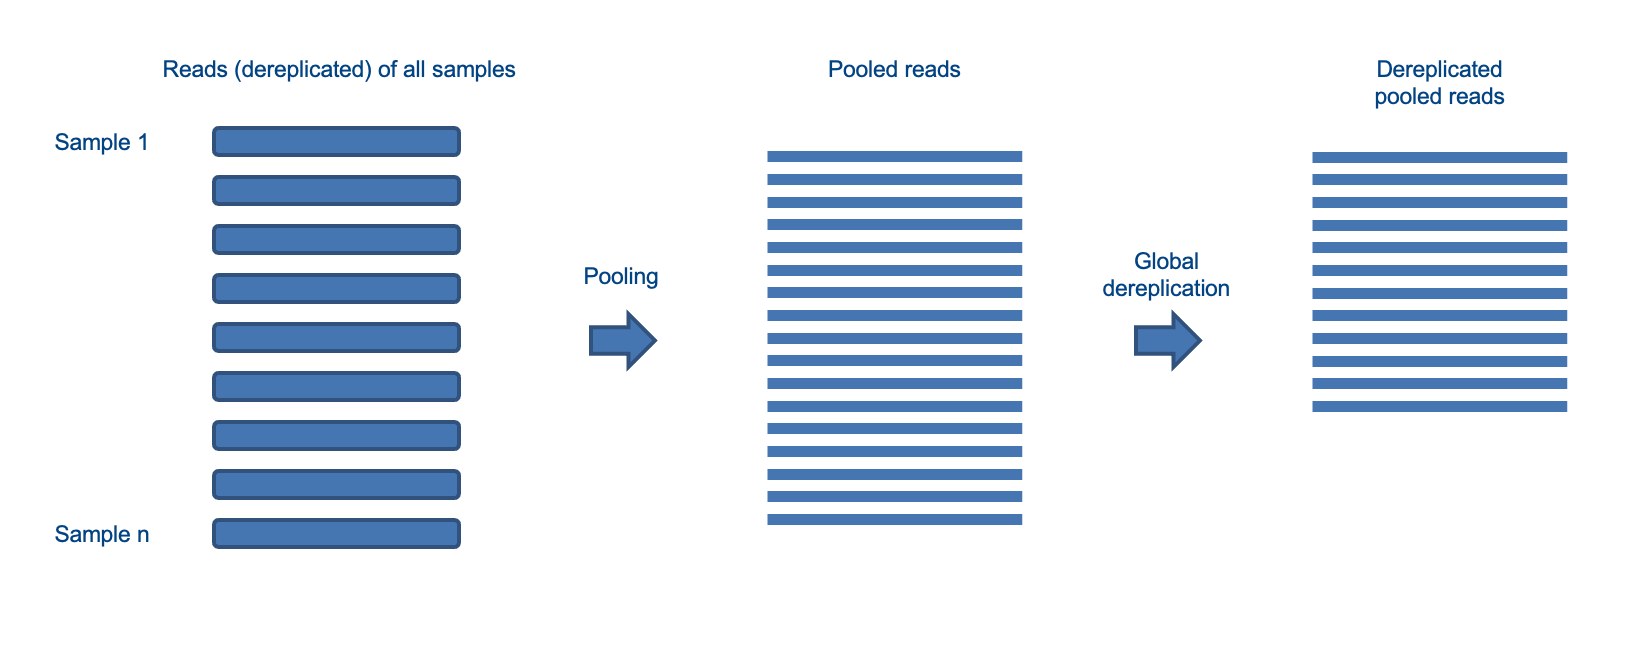
Then, reads are pooled into a single file and globally dereplicated. The pooled and dereplicated reads are used for clustering and denoising.
OTU clustering
Learn more
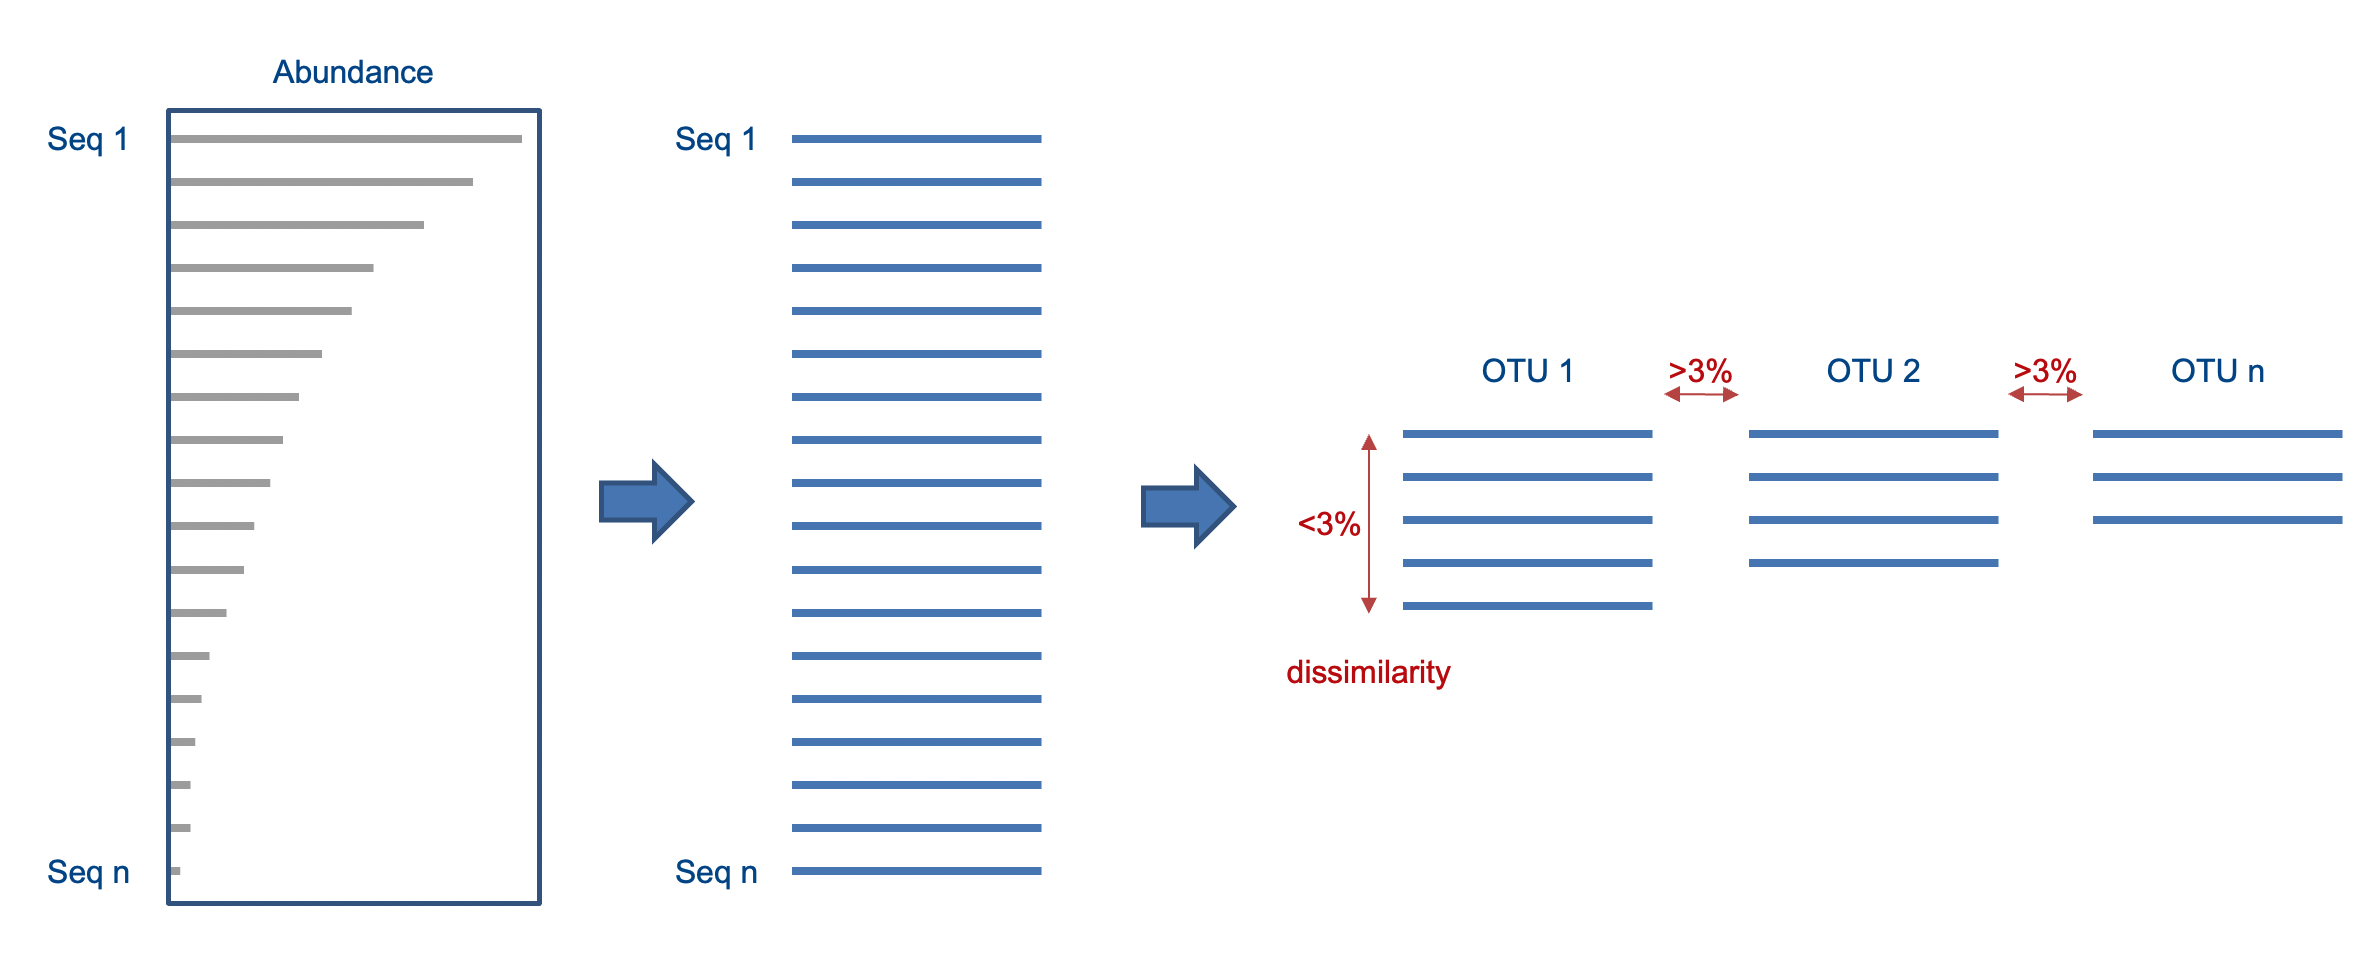
Reads are clustered into Operational Taxonomic Units (OTUs), based on a similarity threshold (e.g., 97% similarity).
Denoising (ESVs)
Learn more
Reads are denoised into Exact Sequence Variants (ESVs). Here, neighbours with small numbers of differences and small abundance compared to X are predicted to be bad reads of X (see Edgar 2016 for more details). Denoising is an error removal step.
Chimera removal (both for OTUs and ESVs)
Learn more
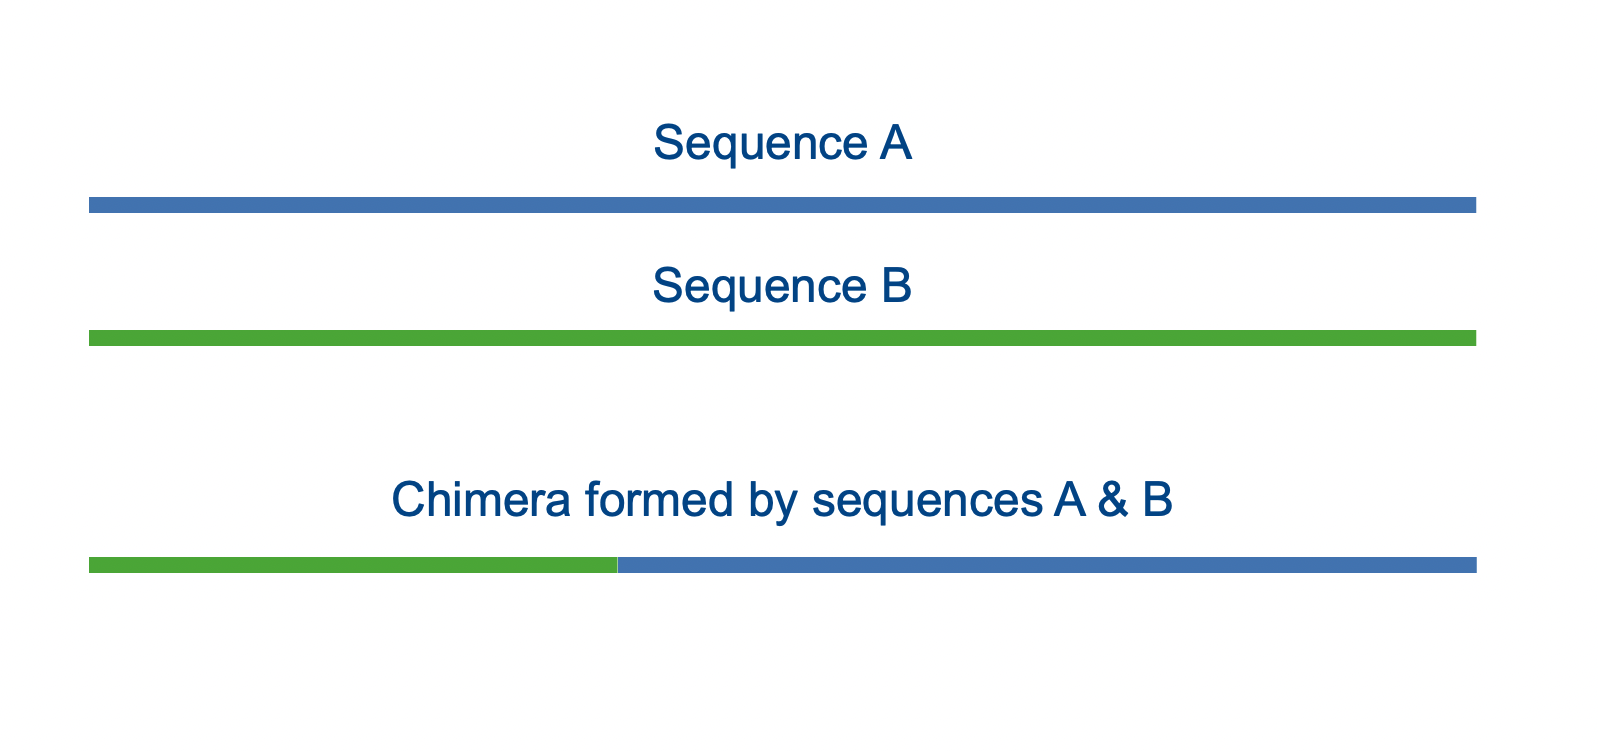
Chimeras are artificial products derived from two biological sequences. They can occur through incomplete extension during PCR. You can learn more about chimeras in the usearch documentation. Chimeras are removed from the OTUs and ESVs.
LULU filtering
Learn more
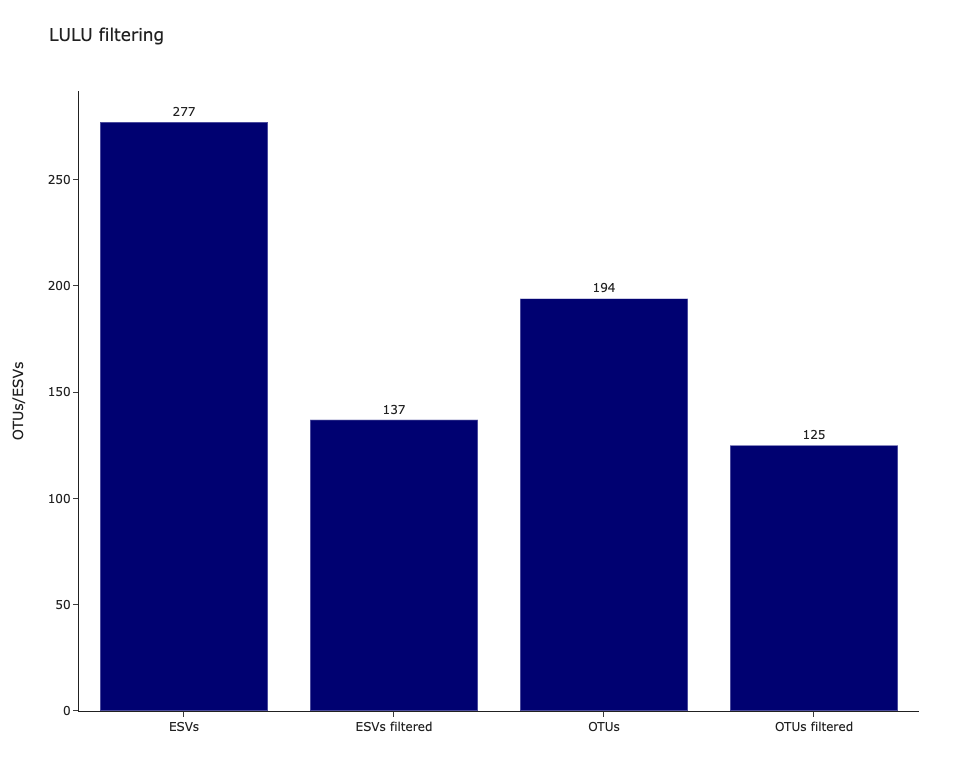
The LULU filtering algorithm is used to reduce the number of erroneous OTUs/ESVs to achieve more realistic biodiversity metrics. More details can be found in Frøslev et al., 2017.
Re-mapping
Learn more
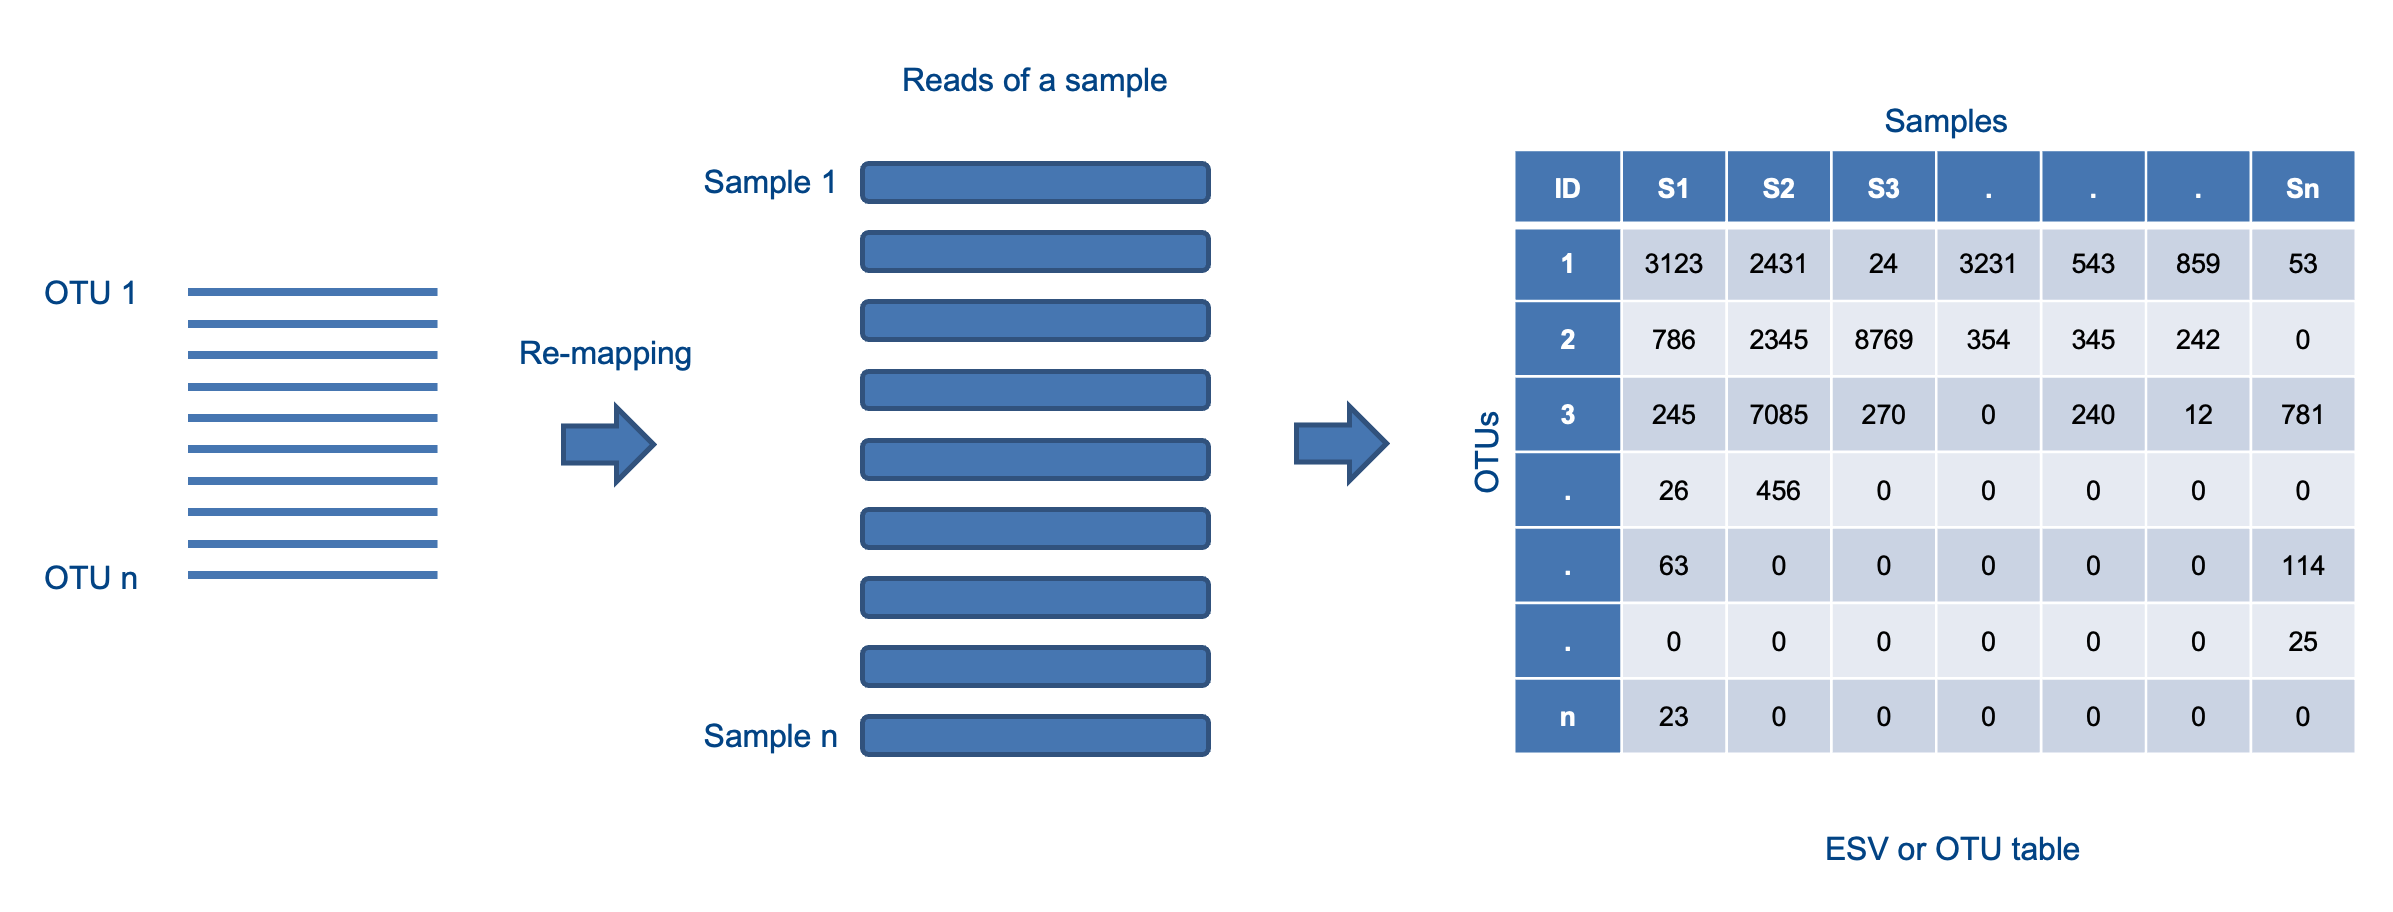
Lastly, OTUs and ESVs are re-mapped to the sequences of each sample and read tables are created.
Summary statistics
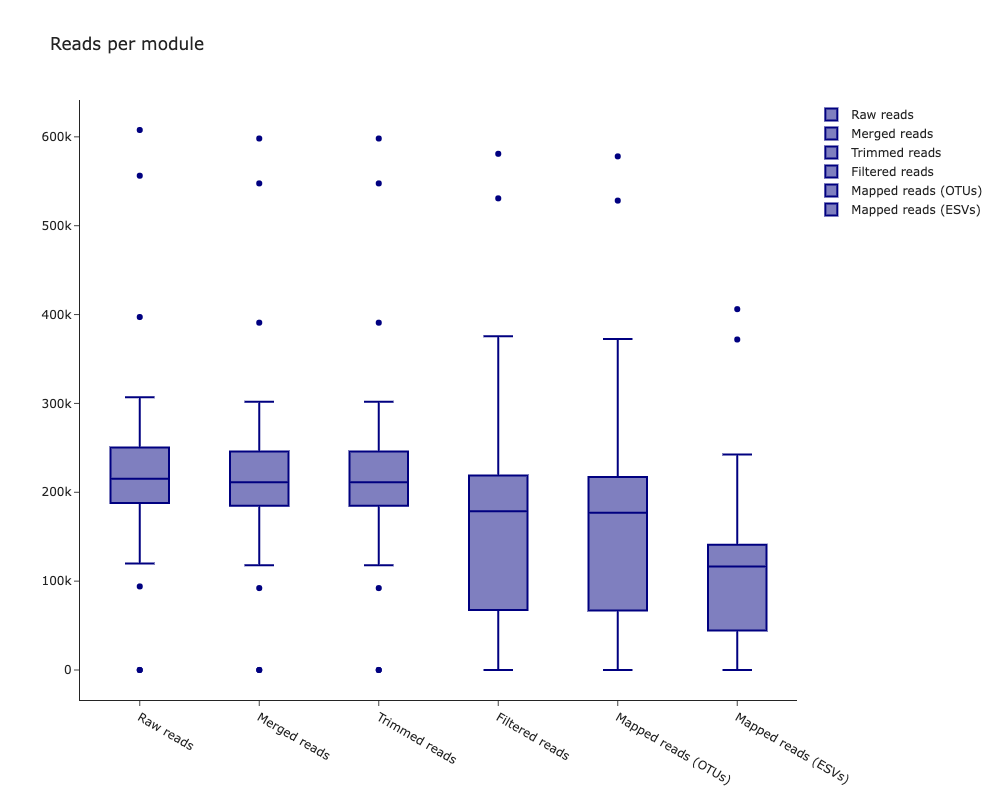
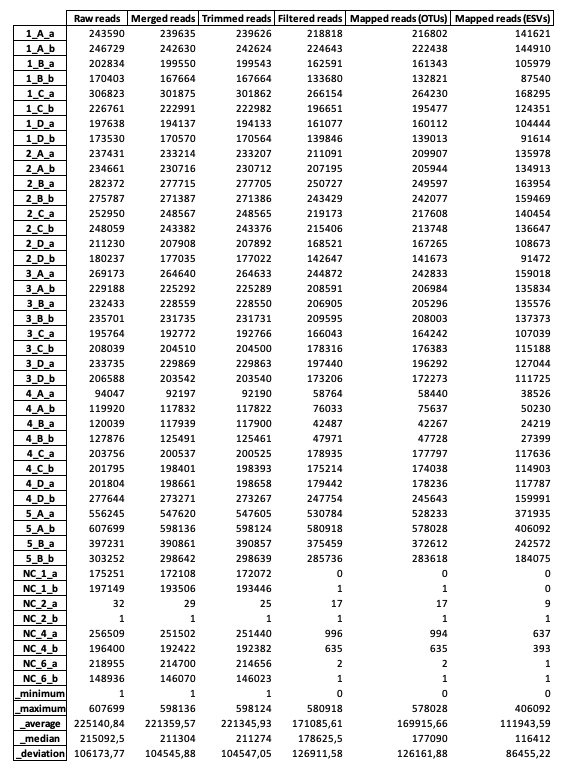
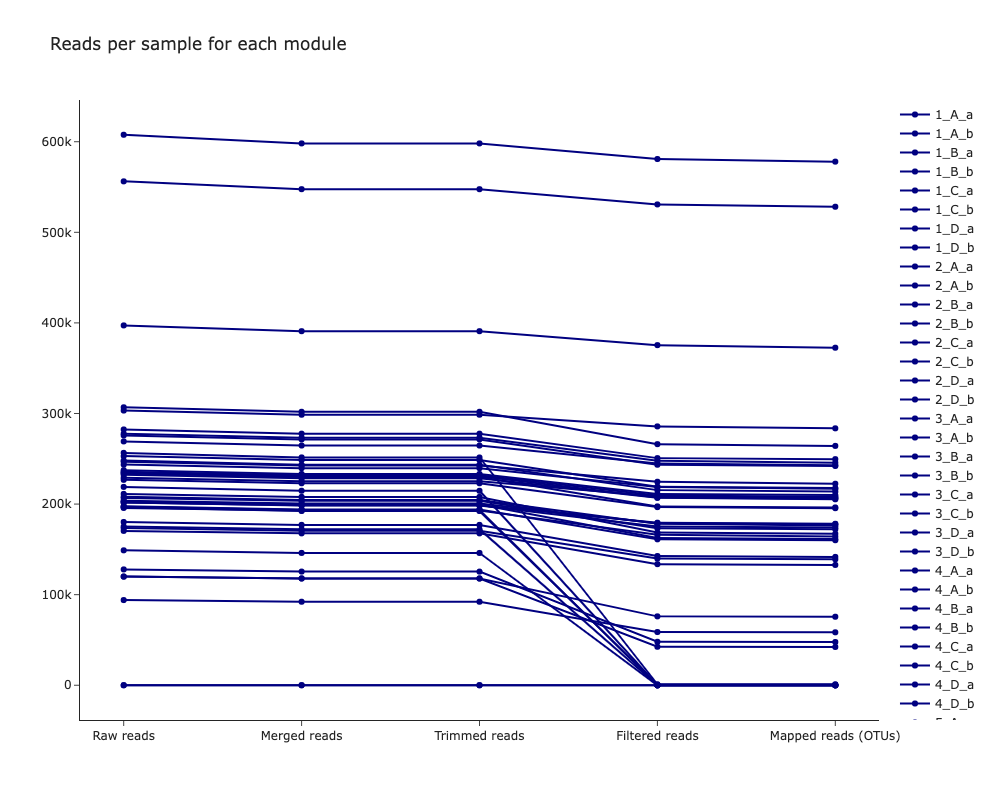
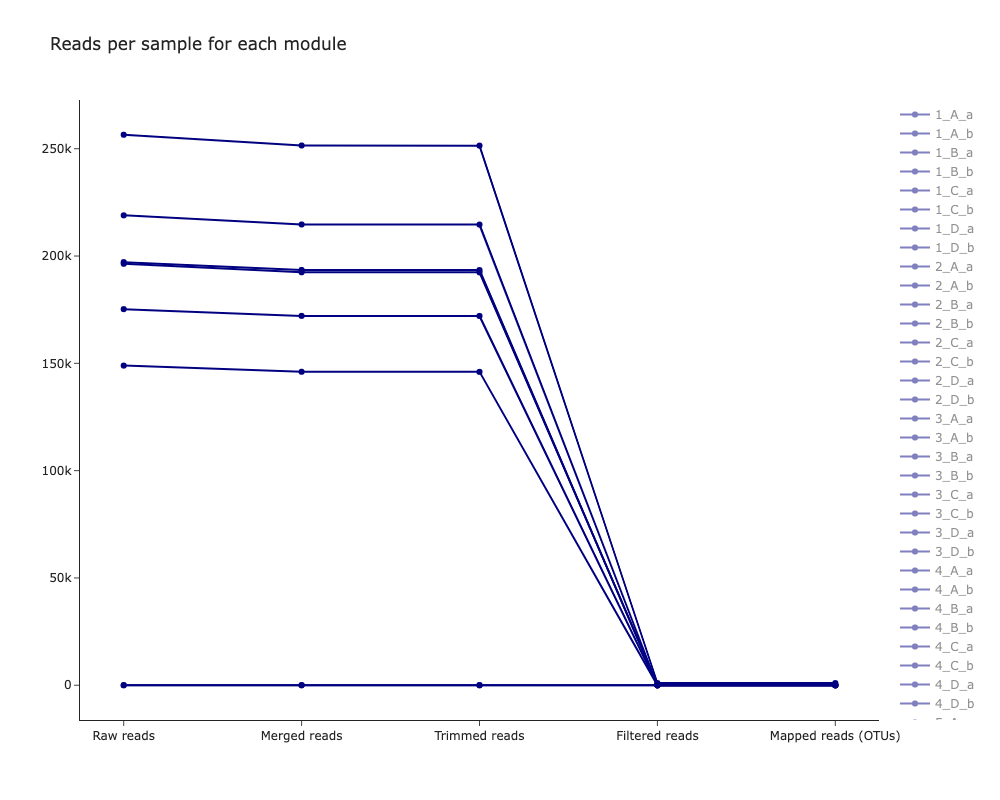
APSCALE will write all relevant statistics for each module to a project report file. In the ASPCALE-GUI version one can additionally calculate many relevant statistics for the processed dataset. All plots are stored as .pdf and interactive .html charts.
You can check out some examples below:
Boxplot of reads per sample for each module
Summary of reads per sample for each module (excel table)
OTU summary (all samples)
OTU summary (negative controls)
OTU summary (sample 1 consisting of 4 extraktion replicates with each 2 PCR replicates)
OTU heatmap (all samples; log of reads)
LULU filtering
Local BLAST
The local BLAST tool is really simple to use.
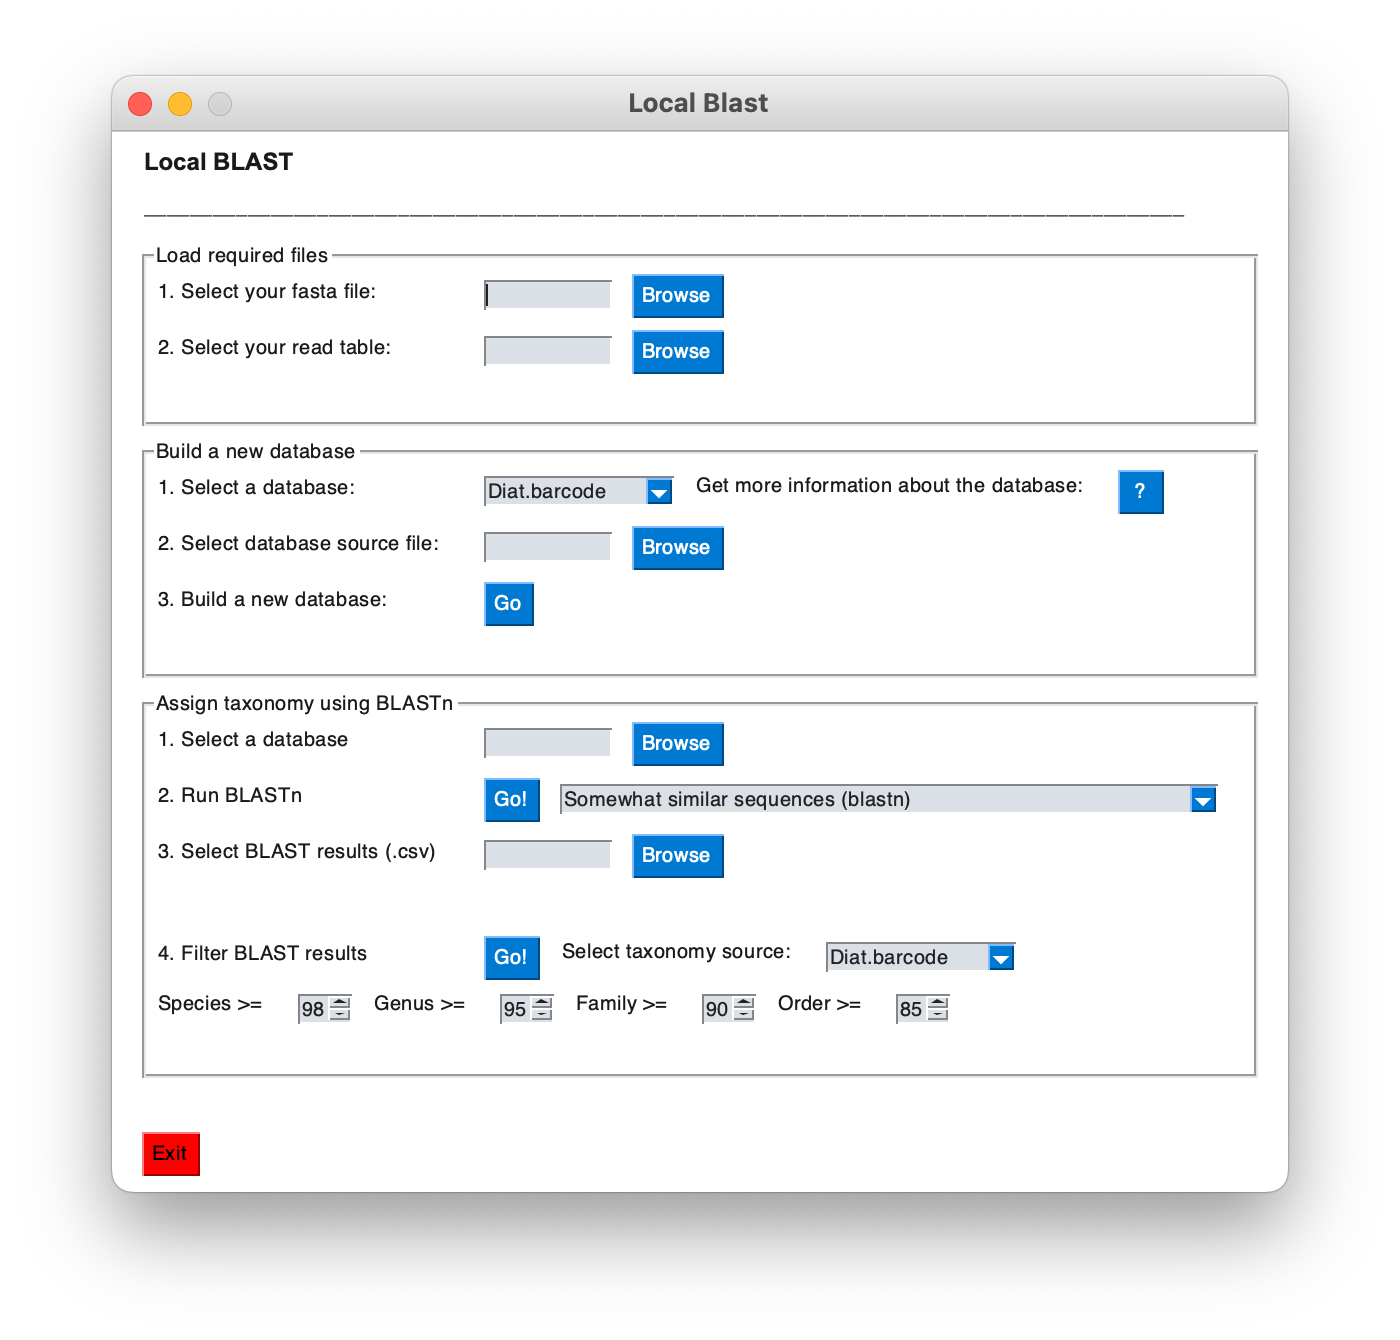
- Select your sequences (.fasta) and OTU table (.xlsx).
- Build a new database from a source file (see available dabases below). This only needs to be done once.
- Select your database to perform the BLAST against.
- Run the BLAST (blastn is recommended)
- Filter the BLAST results. The hits per OTU will be filtered as follows:
- By e-value (the e-value is the number of expected hits of similar quality which could be found just by chance):
- The hit(s) with the lowest e-value are kept (the lower the e-value the better).
- By taxonomy:
- Hits with the same taxonomy are dereplicated.
- Hits are adjusted according to thresholds (default: species >=98%, genus >=95%, family >=90%, order >=85%) and dereplicated.
- Hits with still conflicting taxonomy are set back to the most recent common taxonomy
- OTU without matches are collected from the OTU table
The following exemplary BLAST results...
| ID | Hit | Phylum | Class | Order | Family | Genus | Species | Similarity (%) | E-Value |
|---|---|---|---|---|---|---|---|---|---|
| OTU_1 | Hit_1 | Chordata | Actinopteri | Esociformes | Esocidae | Esox | Esox lucius | 100 | 3.33e-68 |
| OTU_1 | Hit_2 | Chordata | Actinopteri | Esociformes | Esocidae | Esox | Esox lucius | 100 | 3.33e-68 |
| OTU_2 | Hit_1 | Chordata | Actinopteri | Cypriniformes | Leuciscidae | Leuciscus | Leuciscus aspius | 100 | 3.43e-59 |
| OTU_2 | Hit_2 | Chordata | Actinopteri | Cypriniformes | Leuciscidae | Squalius | Squalius cephalus | 100 | 3.43e-59 |
| OTU_3 | Hit_1 | Chordata | Actinopteri | Cypriniformes | Leuciscidae | Rutilus | Rutilus rutilus | 95 | 4.77e-35 |
| OTU_3 | Hit_2 | Chordata | Actinopteri | Cypriniformes | Leuciscidae | Rutilus | Rutilus rutilus | 95 | 4.77e-35 |
| OTU_4 | Hit_1 | Chordata | Actinopteri | Cypriniformes | Leuciscidae | Leuciscus | Leuciscus aspius | 100 | 1.05e-46 |
| OTU_4 | Hit_2 | Chordata | Actinopteri | Cypriniformes | Leuciscidae | Squalius | Squalius cephalus | 99 | 9.27e-16 |
| OTU_4 | Hit_3 | Chordata | Actinopteri | Cypriniformes | Leuciscidae | Barbus | Barbus barbus | 98 | 1.68e-12 |
... would be filtered into a taxonomy table like this:
| ID | Phylum | Class | Order | Family | Genus | Species | Similarity (%) |
|---|---|---|---|---|---|---|---|
| OTU_1 | Chordata | Actinopteri | Esociformes | Esocidae | Esox | Esox lucius | 100 |
| OTU_2 | Chordata | Actinopteri | Cypriniformes | Leuciscidae | 100 | ||
| OTU_3 | Chordata | Actinopteri | Cypriniformes | Leuciscidae | Rutilus | 95 | |
| OTU_4 | Chordata | Actinopteri | Cypriniformes | Leuciscidae | Leuciscus | Leuciscus aspius | 100 |
Available databases for local BLAST
Diat.barcode database
Available from here: https://www6.inrae.fr/carrtel-collection_eng/Barcoding-database/Database-download
Please download the latest .xlsx file!
Midori2 database
Available from here: http://www.reference-midori.info/download.php#
Please download the latest .fasta file!
The PATH should be as follows: GenBank2xx/BLAST/longest/fasta/*.fasta.zip
For example: Databases/GenBank249/BLAST_AA_sp/fasta/MIDORI_LONGEST_AA_GB249_CO1_BLAST.fasta.zip
Unzip it to recieve the .fasta file!
Custom NCBI database
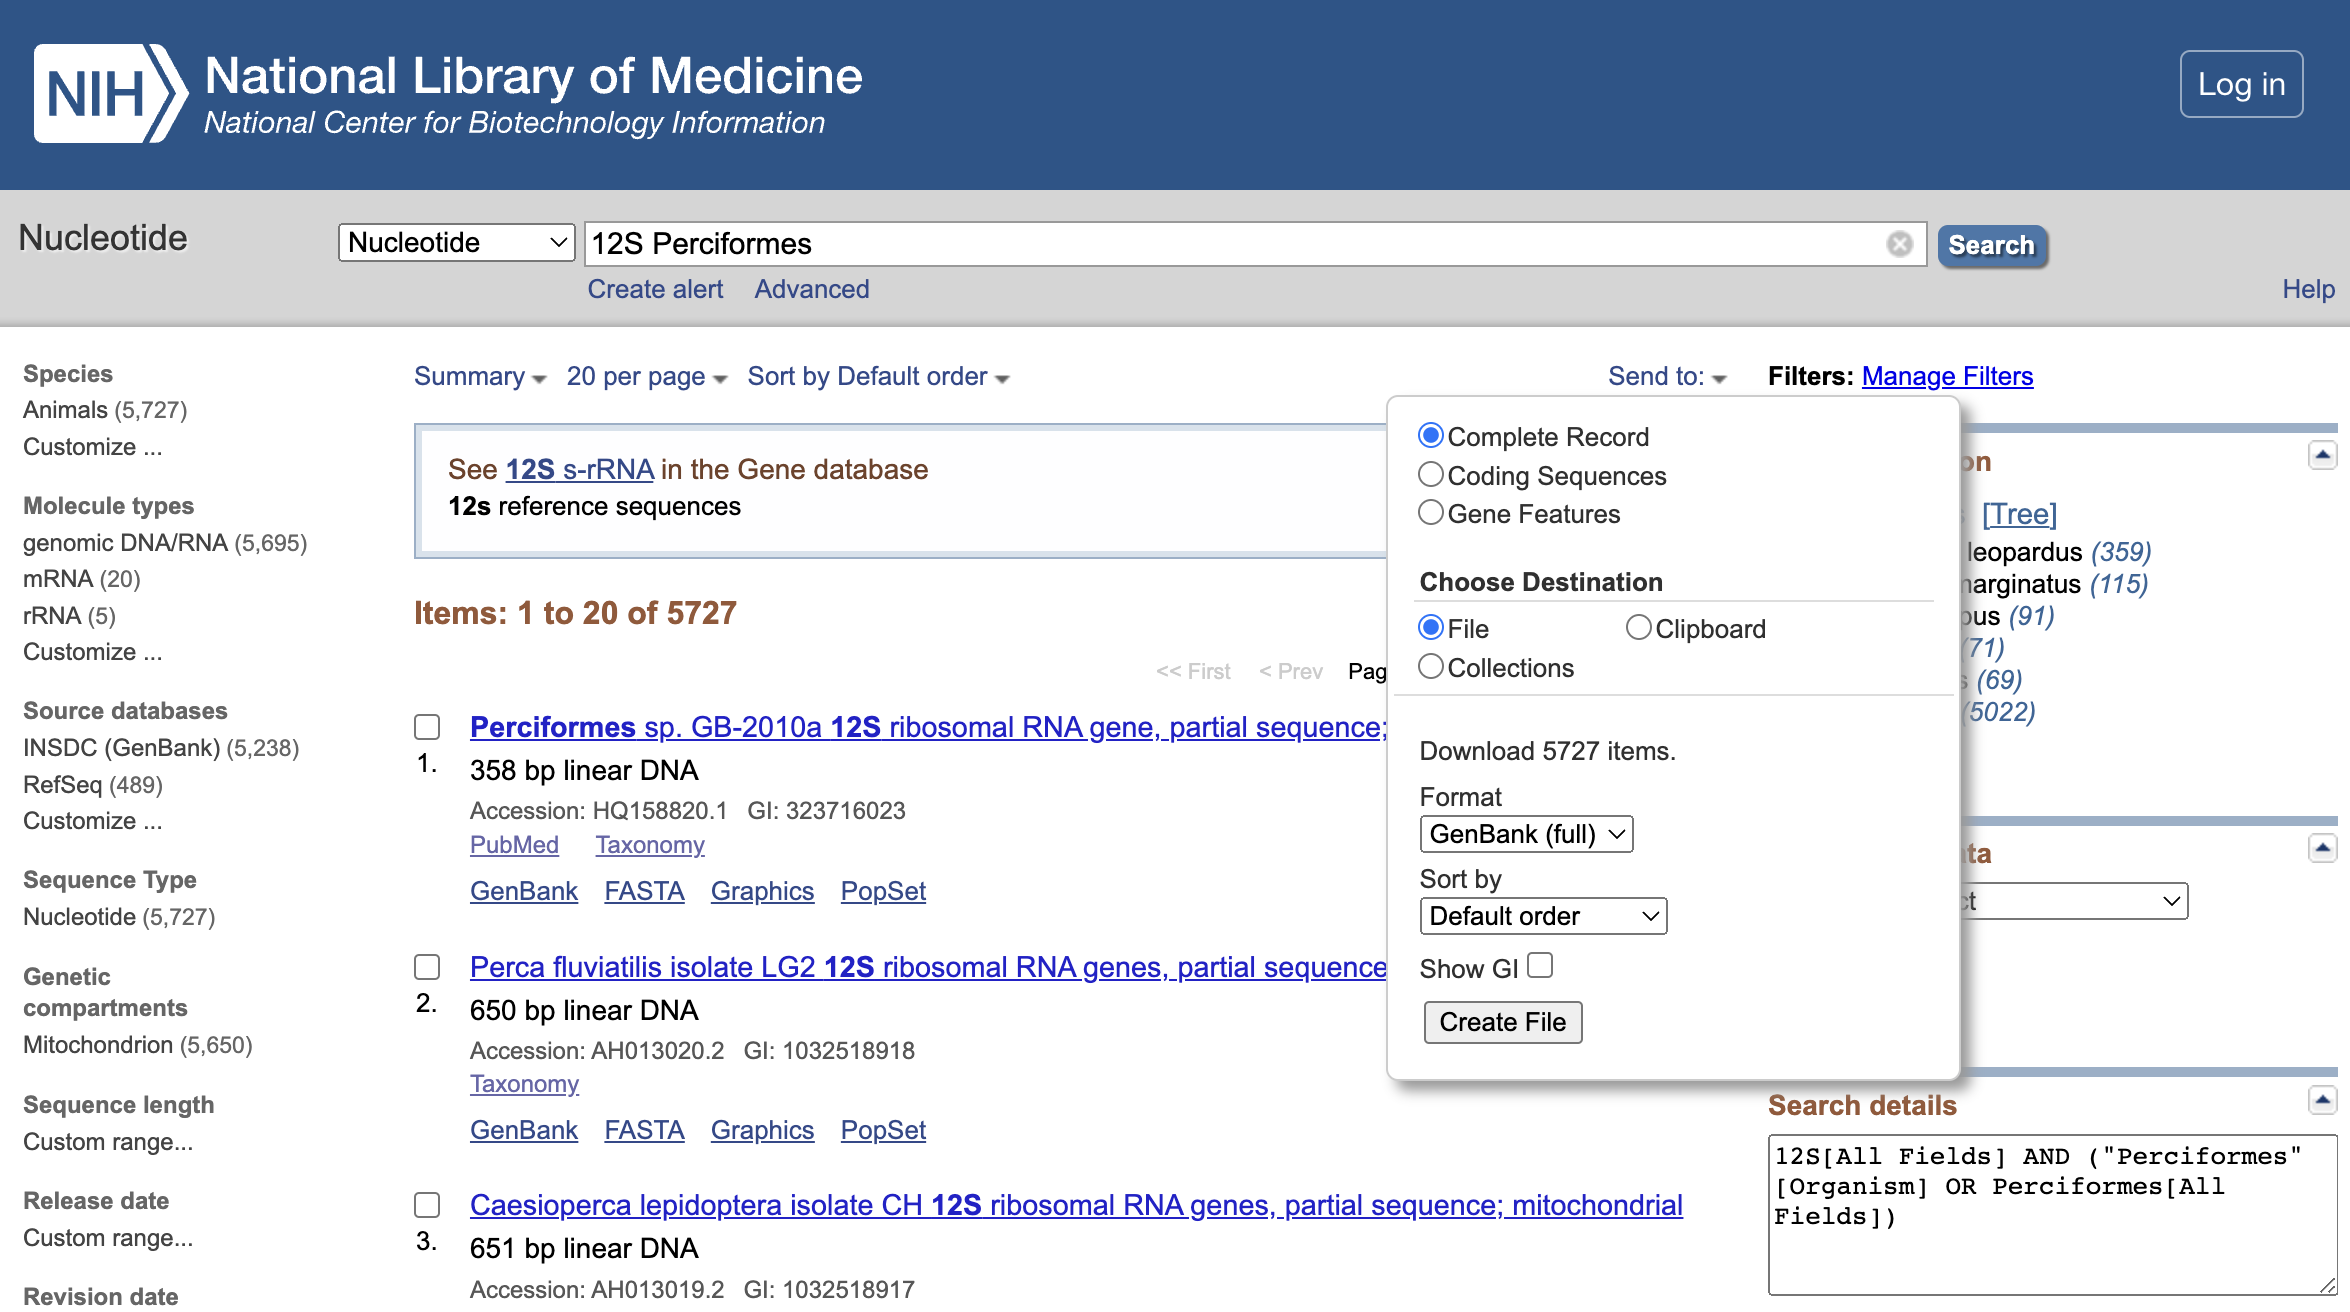
Visit the Genbank homepage (https://www.ncbi.nlm.nih.gov/) and search for sequences to add to your database.
Then select
- Send to:
- Complete record
- File
- GenBank (full)
Then download the .gb file!
Click here to see an example
Alternatively (for large datasets) one can use the Entrez-Direct tool: https://www.ncbi.nlm.nih.gov/books/NBK179288/
The easiest way to construct a query is by using the the Genbank browser and copying the search details:
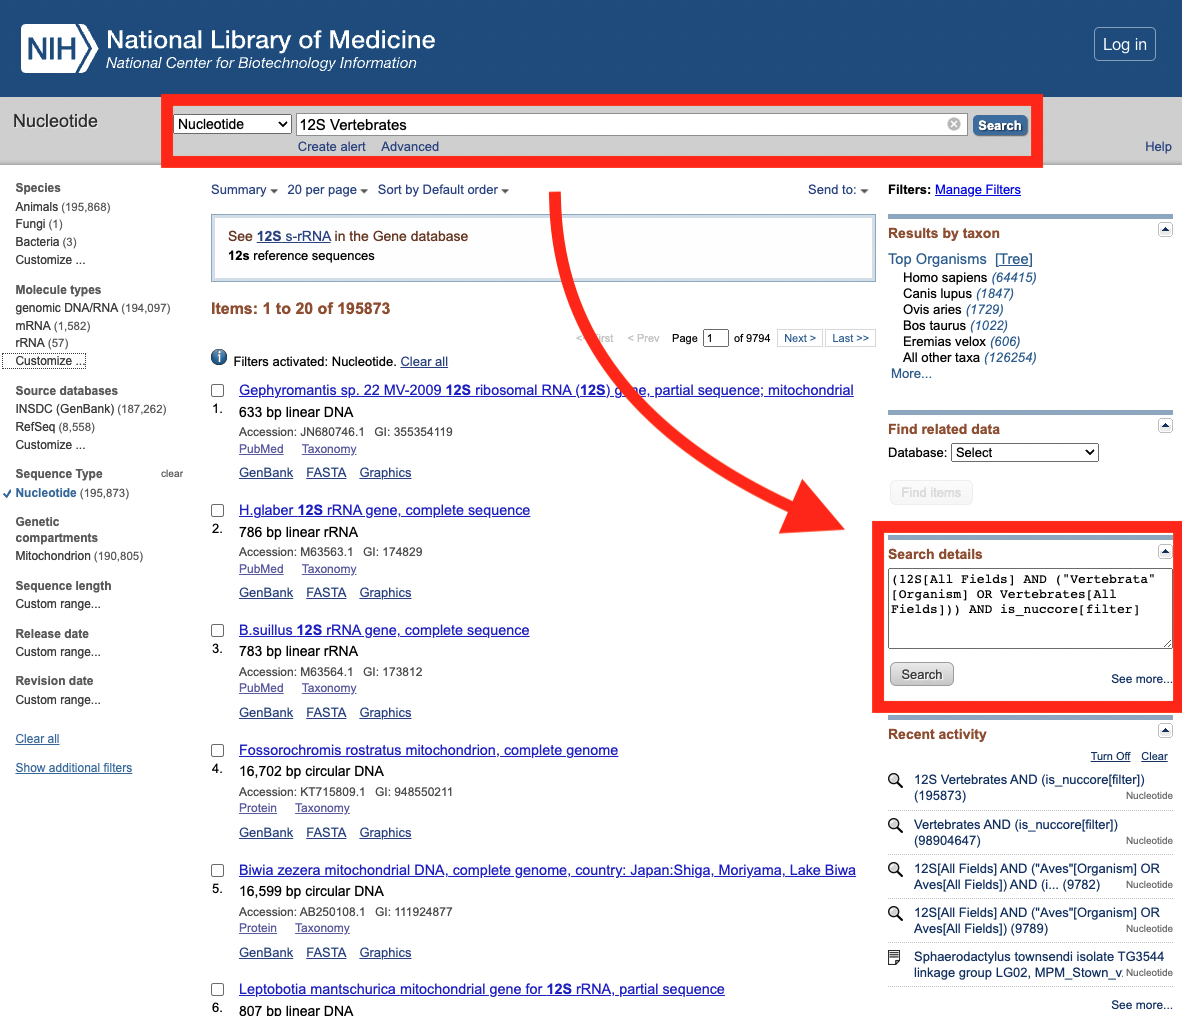
The following command will download all 12S reference sequences for vertebrates:
esearch -db nuccore -query '12S[All Fields] AND ("Vertebrata"[Organism] OR "Vertebrata"[Organism] OR Vertebrata[All Fields]) AND is_nuccore[filter]' | efetch -format gb > Desktop/vertebrate_sequences.gb
My database is missing!
Just let us know if there is need for further databases and we will try to add them.
Citation
Please cite:
Project details
Release history Release notifications | RSS feed
Download files
Download the file for your platform. If you're not sure which to choose, learn more about installing packages.
Source Distribution
Built Distribution
Hashes for apscale_gui-1.2.1-py3-none-any.whl
| Algorithm | Hash digest | |
|---|---|---|
| SHA256 | 9d8c2cfab05914c8be33e7f398b644aa48567f8b56d880e876c57b733fcb1963 |
|
| MD5 | 8d17267b8626072d60ca2034f7fc1ac2 |
|
| BLAKE2b-256 | f5b7aa70ddf2e113c02382d93480fb88ba9e0cf11af093e8ebff75ae84da0f6b |


