arcplot is a library based on matplotlib for seamless creation of custom arc diagrams.

Project description
arcplot


arcplot is a library based on matplotlib for seamless creation of custom arc diagrams.
arcplot is also presented in Python Graph Gallery's Arc diagram section. huge thanks for this to Yan Holtz and Joseph Barbier!
usage
custom colors
from arcplot import ArcDiagram
nodes = [
"Rome",
"Naples",
"Florence",
"Bari",
"Taranto",
"Verona",
"Venice",
"Bologna",
"Bolzano",
"Milan",
"Turin",
"Genoa",
]
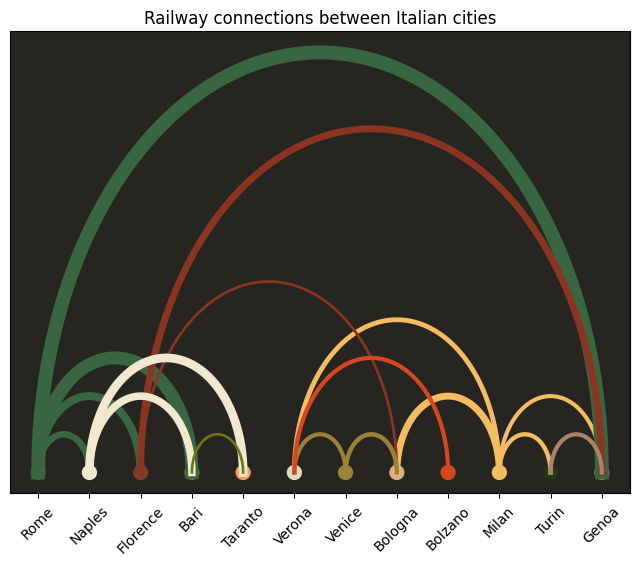
title = "Railway connections between Italian cities"
arc_diagram = ArcDiagram(nodes, title)
custom_colors = [
"#386641",
"#f2e8cf",
"#8b3422",
"#6f7714",
"#ff9b54",
"#e2d9c5",
"#9a8237",
"#dbab85",
"#d64620",
"#f6bd60",
"#283618",
"#a98467",
]
arc_diagram.set_custom_colors(custom_colors)
arc_diagram.set_background_color("#262522")
arc_diagram.set_label_rotation_degree(45)
arc_diagram.connect(
"Milan", "Genoa", linewidth=119
) # passing the distance in km between the two cities as arc linewidth
arc_diagram.connect("Milan", "Verona", linewidth=140)
arc_diagram.connect("Milan", "Turin", linewidth=126)
arc_diagram.connect("Milan", "Bologna", linewidth=201)
arc_diagram.connect("Rome", "Genoa", linewidth=403)
arc_diagram.connect("Rome", "Florence", linewidth=232)
arc_diagram.connect("Rome", "Naples", linewidth=189)
arc_diagram.connect("Rome", "Bari", linewidth=375)
arc_diagram.connect("Florence", "Genoa", linewidth=200)
arc_diagram.connect("Florence", "Bologna", linewidth=80)
arc_diagram.connect("Naples", "Taranto", linewidth=252)
arc_diagram.connect("Naples", "Bari", linewidth=219)
arc_diagram.connect("Venice", "Verona", linewidth=120)
arc_diagram.connect("Venice", "Bologna", linewidth=131)
arc_diagram.connect("Bolzano", "Verona", linewidth=122)
arc_diagram.connect("Bari", "Taranto", linewidth=78)
arc_diagram.connect("Genoa", "Turin", linewidth=122)
arc_diagram.show_plot()
custom line widths
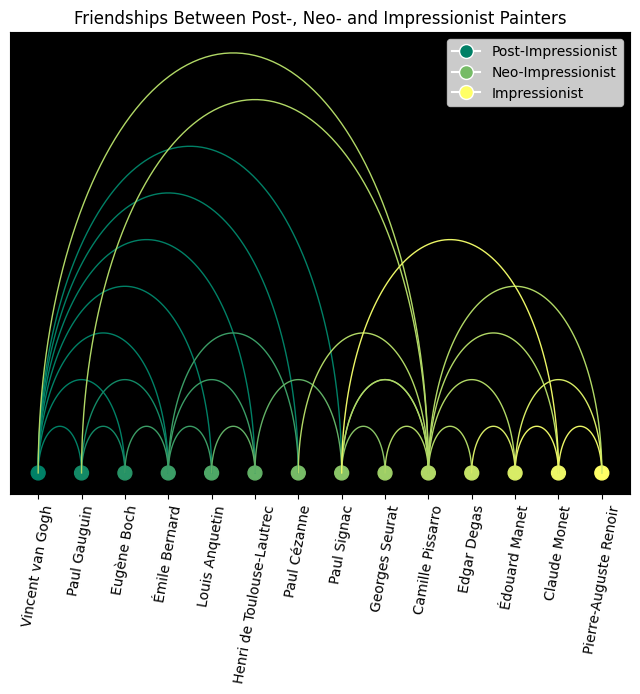
title = "Friendships Between Post-, Neo- and Impressionist Painters"
nodes = [
    "Vincent van Gogh",
    "Paul Gauguin",
    "Eugène Boch",
    "Émile Bernard",
    "Louis Anquetin",
    "Henri de Toulouse-Lautrec",
    "Paul Cézanne",
    "Paul Signac",
    "Georges Seurat",
    "Camille Pissarro",
    "Edgar Degas",
    "Édouard Manet",
    "Claude Monet",
    "Pierre-Auguste Renoir",
]

connections = [
    ("Vincent van Gogh", "Paul Gauguin"),
    ("Vincent van Gogh", "Émile Bernard"),
    ("Vincent van Gogh", "Eugène Boch"),
    ("Vincent van Gogh", "Paul Signac"),
    ("Vincent van Gogh", "Henri de Toulouse-Lautrec"),
    ("Vincent van Gogh", "Louis Anquetin"),
    ("Vincent van Gogh", "Paul Cézanne"),
    ("Paul Gauguin", "Émile Bernard"),
    ("Paul Gauguin", "Eugène Boch"),
    ("Émile Bernard", "Eugène Boch"),
    ("Émile Bernard", "Henri de Toulouse-Lautrec"),
    ("Émile Bernard", "Louis Anquetin"),
    ("Émile Bernard", "Paul Cézanne"),
    ("Henri de Toulouse-Lautrec", "Louis Anquetin"),
    ("Henri de Toulouse-Lautrec", "Paul Signac"),
    ("Paul Signac", "Georges Seurat"),
    ("Paul Signac", "Camille Pissarro"),
    ("Camille Pissarro", "Paul Cézanne"),
    ("Camille Pissarro", "Paul Gauguin"),
    ("Camille Pissarro", "Vincent van Gogh"),
    ("Camille Pissarro", "Georges Seurat"),
    ("Camille Pissarro", "Paul Signac"),
    ("Camille Pissarro", "Édouard Manet"),
    ("Camille Pissarro", "Claude Monet"),
    ("Camille Pissarro", "Pierre-Auguste Renoir"),
    ("Camille Pissarro", "Edgar Degas"),
    ("Claude Monet", "Paul Signac"),
    ("Claude Monet", "Pierre-Auguste Renoir"),
    ("Claude Monet", "Édouard Manet"),
    ("Édouard Manet", "Pierre-Auguste Renoir"),
    ("Édouard Manet", "Edgar Degas"),
]
arc_diagram_painters = ArcDiagram(nodes, title)

arc_diagram_painters.set_label_rotation_degree(80)
arc_diagram_painters.set_legend_labels(
    ["Post-Impressionist", "Neo-Impressionist", "Impressionist"]
)

for connection in connections:
    arc_diagram_painters.connect(connection[0], connection[1])

arc_diagram_painters.set_background_color("black")
arc_diagram_painters.set_color_map("summer")
arc_diagram_painters.save_plot_as("painters.png")
custom arc positions
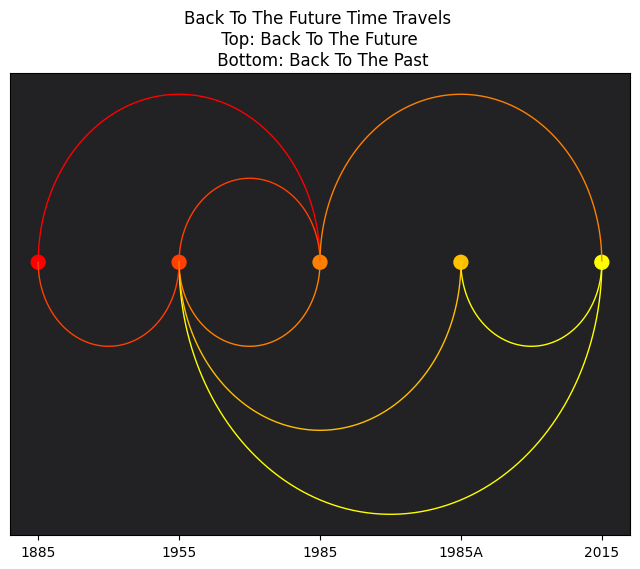
nodes = [
    "1885",
    "1955",
    "1985",
    "1985A",
    "2015",
]

title = "Back To The Future Time Travels \n Top: Back To The Future \n Bottom: Back To The Past"
arc_diagram = ArcDiagram(nodes, title)
arc_diagram.set_background_color("#222124")
arc_diagram.set_color_map("autumn")
arc_diagram.connect("1885", "1985")
arc_diagram.connect("1955", "1985")
arc_diagram.connect("1985", "2015")
arc_diagram.connect("2015", "1985A", arc_position="below")
arc_diagram.connect("2015", "1955", arc_position="below")
arc_diagram.connect("1985", "1955", arc_position="below")
arc_diagram.connect("1985A", "1955", arc_position="below")
arc_diagram.connect("1955", "1885", arc_position="below")
arc_diagram.save_plot_as("back_to_the_future.png")
wrapper around ArcDiagram which uses pandas DataFrame
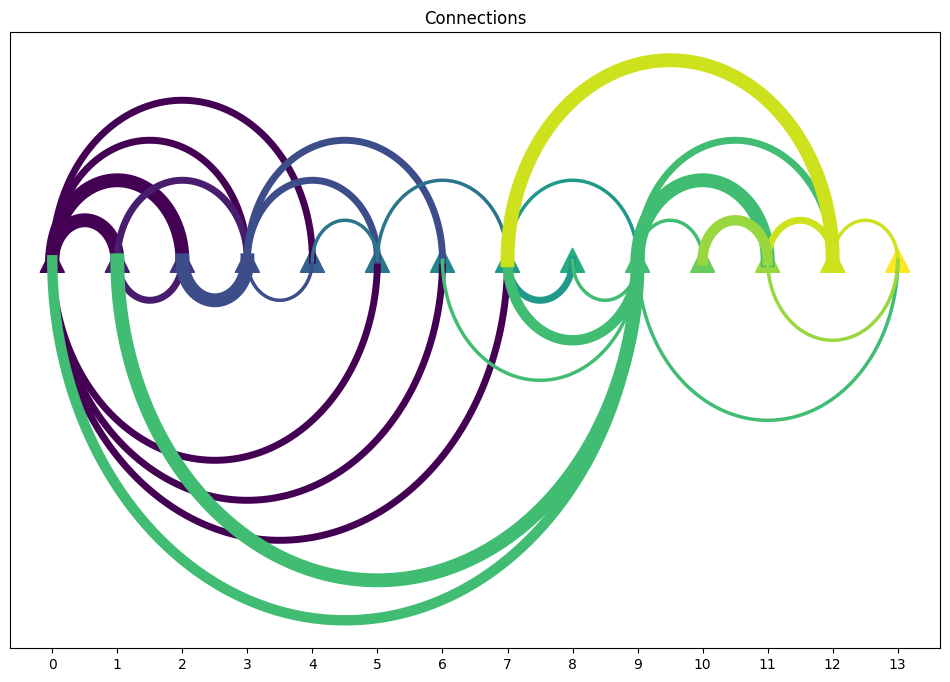
from arcplot import show_arc_plot, save_arc_plot_as
import pandas as pd

df = pd.read_csv("./data/connections-dataset.csv")
show_arc_plot(
    df,
    start_node="from",
    end_node="to",
    weights="weights",
    positions="position",
    title="Connections",
    node_type="^",
    node_size=300,
    width=12,
    height=8,
)
save_arc_plot_as(
    df,
    start_node="from",
    end_node="to",
    weights="weights",
    positions="position",
    title="Connections",
    file_name="./img/connections.png",
    node_type="^",
    node_size=300,
    resolution=100,
    width=19.2,
    height=10.8,
)
function list
### ArcDiagram class methods
ArcDiagram(nodes, title) # for initializing an ArcDiagram the entities to connect and the title is required.
.set_background_color(string) # for setting background color of the matplotlib figure.
.set_color_map(string) # for setting color map, choose from: https://matplotlib.org/stable/users/explain/colors/colormaps.html
.set_custom_colors(color_list) # for setting colors of nodes from a custom color list,
# the length of the color list must be the same as the length of the node list.
.set_label_rotation_degree(45) # rotates the labels in 45 degree, default is 0.
.set_legend_labels(list_of_labels) # adds a legend to the plot with configurable labels.
.connect(start, end, linewidth=100, arc_position="below") # for creating an arc between two entities
# optional parameter linewidth sets linewidth proportionally to other arc linewidths.
# arc_position="below" draws arc below the x axis, default is "above".
.show_plot(node_type="o", node_size=100, width=8, height=6) # for checking the results of the data visualization process.
.save_plot_as(file_name,
        resolution="figure",
        node_type="o",
        node_size=100,
        width=8,
        height=6) # for saving file as an image with an optional resolution setting for higher-quality images.
.help() # to get function list.

### wrapper functions built on ArcDiagram

create_arc_plot(
    df: pd.DataFrame,
    start_node: str,
    end_node: str,
    weights=None,
    positions=None,
    invert_positions: bool = False,
    bg_color="white",
    cmap="viridis",
    title="My Diagram",
) # returns ArcDiagram

show_arc_plot(
    df: pd.DataFrame,
    start_node: str,
    end_node: str,
    weights=None,
    positions=None,
    invert_positions: bool = False,
    bg_color="white",
    cmap="viridis",
    title="My Diagram",
) # for checking the results of the data visualization process.

save_arc_plot_as(
    df: pd.DataFrame,
    start_node: str,
    end_node: str,
    file_name: str,
    weights=None,
    positions=None,
    invert_positions: bool = False,
    bg_color="white",
    cmap="viridis",
    title="My Diagram",
    resolution="figure"
) # for saving file as an image with an optional resolution setting for higher-quality images.
installation
pip install arcplot==1.0.0


Download files
Download the file for your platform. If you're not sure which to choose, learn more about installing packages.
Source Distribution
arcplot-1.0.0.tar.gz
(6.2 kB
view details)
Built Distribution
Filter files by name, interpreter, ABI, and platform.
If you're not sure about the file name format, learn more about wheel file names.
Copy a direct link to the current filters
File details
Details for the file arcplot-1.0.0.tar.gz.
File metadata
- Download URL: arcplot-1.0.0.tar.gz
- Upload date:
- Size: 6.2 kB
- Tags: Source
- Uploaded using Trusted Publishing? No
- Uploaded via: poetry/2.1.1 CPython/3.10.5 Linux/5.18.3-arch1-1
File hashes
| Algorithm | Hash digest | |
|---|---|---|
| SHA256 |
2da8edf5095d3d70c3231bd96656c24b942435af934cae894df3907d69ed93c7
|
|
| MD5 |
90261d3234b78807ddd799629a0991f1
|
|
| BLAKE2b-256 |
f7c10cd195dc8c14573e19feffc8e7448ddd25208996a2b232de1c05c2f5a352
|
File details
Details for the file arcplot-1.0.0-py3-none-any.whl.
File metadata
- Download URL: arcplot-1.0.0-py3-none-any.whl
- Upload date:
- Size: 7.1 kB
- Tags: Python 3
- Uploaded using Trusted Publishing? No
- Uploaded via: poetry/2.1.1 CPython/3.10.5 Linux/5.18.3-arch1-1
File hashes
| Algorithm | Hash digest | |
|---|---|---|
| SHA256 |
d1aea4da59dc81ef63762cedd26b9035a6563e2c2e34f2e1cd9c38fa72b73cd9
|
|
| MD5 |
46ea578ce505dda722299680e4cf04c3
|
|
| BLAKE2b-256 |
465d73f3ac9265fb441287c13ac76206d0ff75b7aae7b260f69efc6bd1ca34dd
|


