
arduplot
No Serial Plotter for PlatformIO/VSCode ???
The following picture shows the Arduino IDE's serial plotter which plots the data coming through the serial port.
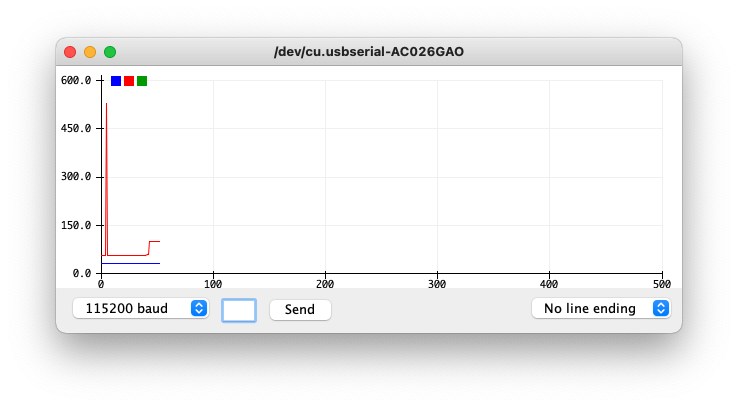
But there is no built-in equivalent tool for the PlatformIO and/or VSCode. Hence arduplot(Arduino Plot) is made to support the equivalent funcitionality.
This tool can be run stand alone with the usage below. This needs to be started in the PIO Terminal Panel, specifically in the PIO bundled python venv.
Usage: arduplot [OPTIONS] [LABELS]...As an example, you can build and run https://github.com/iotlab101/pio_filter_dht22 on an esp8266 and run the following command.Options: -w, --width INTEGER Plotter Width -i, --width INTEGER Plotter Y Axis Min -x, --width INTEGER Plotter Y Axis Max -e, --period INTEGER Plotter sample period (ms), default=1000" -t, --title TEXT Plotter Title -s, --socket INTEGER TCP Socket Port number -n, --stdin Standard input pipe -p, --port TEXT Serial Port, a number or a device name -b, --baud INTEGER Set baudrate, default=115200 --help Show this message and exit.
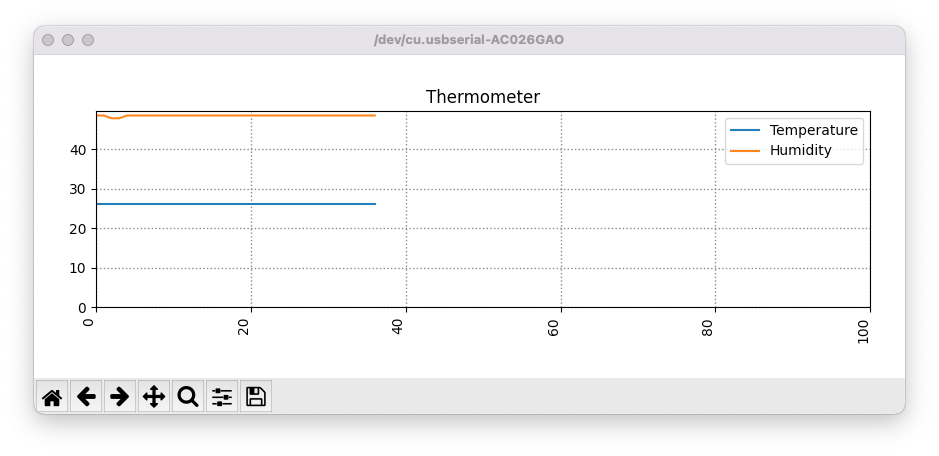
arduplot -p COM5 -t Thermometer -w 100 Temperature Humidity
Here -t Thermometer is the title of the plot chart, -w 100 is the width of the plot, and Temperature and the Humidity are the labels of the plotting data. And you'll see see the plot like this
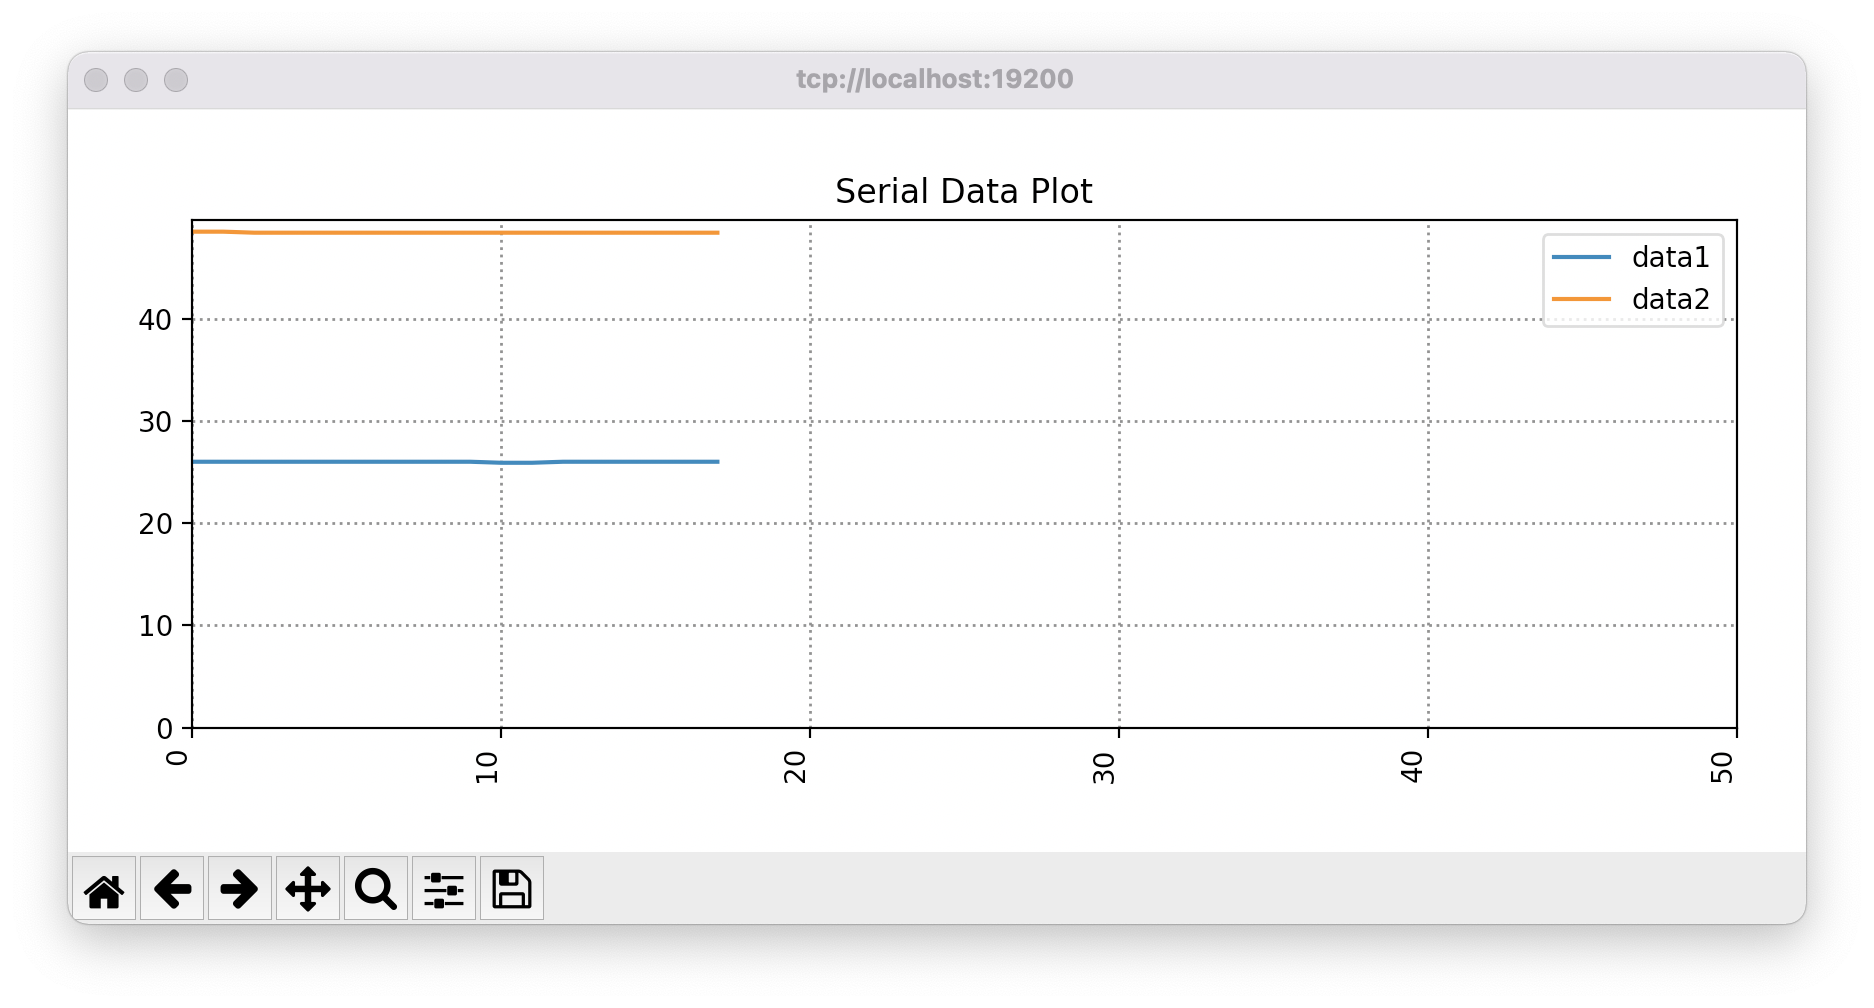
(And you can plot the data from a TCP connection as well instead of the serial port if you use the -s option. Use the -s option to open and wait on a socket, then feed the data to the socket. The data format should be the same as the Serial port case)
Optional Plot Configuration
There is an optional configuration file where you can set the setting for the plotting for the project. If you create a json file named 'plotcfg.json' under the the PIO project directory, you don't have to pass the parameters every time you invoke the tool.
{
    "label": [
        "temperature",
        "humidity"
    ],
    "title": "Thermmeter",
    "width": 100
}
This configuration would be helpful, if you want to run this tool over the TCP port via some other tool where it's not easy to pass-through the setting information.
Installation and Prerequisite
- This plotter uses the following dependancies, and they will be installed when you install this tool..
         matplotlib
         click
         pyserial
You can install this tool with the pip as follows
pip install arduplot
Running it as part of PlatformIO monitor filter
1. Install the arduplot first
pip install arduplot2. Configure the tool. There are three ways to configure.
- configure every time you create a pio project
- configure your platform wise like esp8266 or esp32
- or you just configure globally by setting an environment variable.
For i), you create a folder 'monitor' under your pio project folder, and copy ~/.platformio/penv/lib/python3.9/site-packages/arduplot/filter_plotter.py script to that folder.
<Project>/monitor
For ii), you create the ~/.platformio/platform/espressif8266/monitor folder and copy ~/.platformio/penv/lib/python3.9/site-packages/arduplot/filter_plotter.py to that folder. If you're using other platform like esp32, then create the ~/.platformio/platform/espressif32/monitor folder and copy to that folder.
~/.platformio/platform/espressif8266/monitor (or ~/.platformio/platform/espressif32/monitor for esp32)
And for iii), you can just set the environment variable as below and run this without copying. For Windows, you set the environment variable as such in the Windows way.
export PLATFORMIO_MONITOR_DIR=${HOME}/.platformio/penv/lib/python3.9/site-packages/arduplot/
3. With the above steps done, run
pio device monitor -f plotterAnd you will get this plot.
Windows usage with Version Core 6.1.5·Home 3.4.3
In GUI go to PlatformIO sidebar
-> Select New Terminal in quick access at the bottom
In the Terminal window run the following
-> pip install arduplot
Close the terminal or type exit
Edit the platform.ini file (with VS or your preference)
add or ammend (add ,plotter if the entry line already exists) plotter to the monitor filter flag
-> monitor_filters = plotter
Happy hunting guide addition compliments of @cybertza (please note the process will stay not responding in windows until data has been recieved from the serial)
New Features for arduplot 0.2.8
Thanks to Antonio(@ancebfer), arduplot has two new features. That is -e and -n option.
-e is for the rendering time interval in milli seconds unit
and
The original arduplot takes the input from either a serial port or some tcp port(this is used in pio device monitor -f plotter command). Now
-n introduce another input, that is the standard input. What we can do with it is to pipe some data into the arduplot.
For example, here is an example python code named 'wave.py' that generates the data.
#!/usr/bin/env python3
import math
import time

freq = 1  # Hz
period = 0.01  # s

t = 0
while True:
    x = 2 * math.pi * freq * t
    y1 = math.sin(x)
    y2 = math.cos(x)
    print(y1, y2)
    t += period
    time.sleep(period)
And we can use the arduplot to plot the graph with the fed data by
python waves.py | arduplot -n -w 500 -e 10
This sample is also taken from Antoino's work in the pull request. And thank you @thijstriemstra and @cybertza for your contribution as well.
1 maintainer

Metadata
1 maintainer
Release files for arduplot 0.3.3
For a detailed explanation of source distributions (sdists) and built distributions (wheels), please see the package formats documentation.
Source distribution (sdist)
| File | Size | Uploaded | |
|---|---|---|---|
| arduplot-0.3.3.tar.gz | 11.0 kB | Details |
Built distribution (wheel)
| File | Interpreter | ABI | Platform | Reset |
|---|---|---|---|---|
| arduplot-0.3.3-py3-none-any.whl | Python 3 | none | any | Details |
Total release size: 23.0 kB
Release files / arduplot-0.3.3.tar.gz
| Download URL | arduplot-0.3.3.tar.gz |
|---|---|
| Size | 11.0 kB |
| Tags | Source |
|
SHA-256 checksum How to use checksums |
ae952fcaa00a4173eeee3cb64e08f6550865d53156dd560e7527b98b73408108
|
|
BLAKE2b-256 checksum How to use checksums |
b177b0d8babbfb171ddb265f44640f455bd971605a27c67f9ab66d8ea6f68b3e
|
| Upload date | |
|
Uploaded using Trusted Publishing? What is trusted publishing? |
No |
| Uploaded via |
twine/6.0.1 CPython/3.12.8
|
Release files / arduplot-0.3.3-py3-none-any.whl
| Download URL | arduplot-0.3.3-py3-none-any.whl |
|---|---|
| Size | 12.1 kB |
| Tags | Python 3 |
|
SHA-256 checksum How to use checksums |
88ea34fa5d5ad559f45df5b3f2878012fc6572c1076590260901e2935818baf4
|
|
BLAKE2b-256 checksum How to use checksums |
04d5e0b0a1fa53689dc017adfac20d72990ef5303194bc75ad9f62d9204927f4
|
| Upload date | |
|
Uploaded using Trusted Publishing? What is trusted publishing? |
No |
| Uploaded via |
twine/6.0.1 CPython/3.12.8
|














