Production readiness platform for AI agent pipelines — detects silent failures, captures full state, enables step-level replay.
Verified details
These details have been verified by PyPIProject links
GitHub Statistics
Maintainers

Project description


Production readiness platform for AI agent pipelines.
Your LangGraph pipeline runs. No exception. But three nodes later something crashes with a KeyError. The node that crashed didn't cause it — some node upstream returned a dict with a missing field, and nothing caught it.
ARGUS sits between your nodes and catches silent failures, semantic degradation, and contract violations before they reach production.
Install
pip install argus-agents
Setup — pick whichever fits your code
Option A — pass graph to constructor (recommended):
from argus import ArgusWatcher

watcher = ArgusWatcher(graph)      # attaches monitoring automatically
app = graph.compile()
result = app.invoke(initial_state) # run auto-saves when the last node finishes
print(watcher.run_id)              # access the run ID directly
Option B — separate watch call:
from argus import ArgusWatcher

watcher = ArgusWatcher()
watcher.watch(graph)       # before graph.compile()
app = graph.compile()
result = app.invoke(initial_state)
Option C — after compile:
from argus import ArgusWatcher

watcher = ArgusWatcher()
app = graph.compile(checkpointer=memory)
app = watcher.watch_compiled(app)   # works on already-compiled graphs
result = app.invoke(initial_state)
All three work. No changes to your node functions. Runs are saved automatically for linear and fan-out/fan-in graphs. Only cyclic graphs (with back-edges) need a manual watcher.finalize() call.
ArgusWatcher parameters
| Parameter | Type | Default | Description |
|---|---|---|---|
graph |
StateGraph |
None |
LangGraph graph to monitor. If passed, watch() is called automatically. |
max_field_size |
int |
50_000 |
Max characters per field before truncation in stored outputs. |
validators |
dict |
None |
Per-node semantic validators. Use "*" as key to run on every node. Each validator is a (bool, str) callable. |
strict |
bool |
False |
Enable extra checks: nested error keys, rate-limit responses, empty lists, type mismatches. Recommended for CI/staging. |
investigate |
bool | str |
True |
LLM root-cause investigation. True = on failure only, "always" = every node, False = off. |
redact_keys |
set[str] |
None |
Field names to redact from stored outputs (e.g. {"password", "api_key"}). |
persist_state |
bool |
True |
Save run records to .argus/runs/. Set False for ephemeral monitoring. |
record_http |
bool |
True |
Record all external HTTP/API calls for deterministic replay. |
semantic_judge |
bool |
False |
LLM-powered quality judge on every node output. Requires OPENAI_API_KEY. |
judge_model |
str |
"gpt-4o" |
Model for the semantic judge and investigation. |
# Example with multiple options
watcher = ArgusWatcher(
    graph,
    semantic_judge=True,
    judge_model="gpt-4o-mini",
    strict=True,
    record_http=True,
    redact_keys={"api_key", "token"},
    validators={
        "summarize": lambda o: (len(o.get("summary", "")) > 10, "Summary too short"),
    },
)
What it catches
Silent failures — a node returns {} or drops a required field. No exception, pipeline keeps running. ARGUS compares each node's output against the next node's type annotations and flags it before the crash happens downstream.
Semantic failures — structure is fine but the value is wrong. Pass a validator:
watcher = ArgusWatcher(graph, validators={
    "classify": lambda o: (o.get("label") in ["yes", "no"], "unexpected label"),
    "*":        lambda o: ("error" not in o, "error key present"),
})
"*" runs on every node.
Crashes — full traceback captured per node, with a one-line root cause:
└─  KeyError: 'score'
└─  at pipeline.py:47  →  result = state["score"] * weight
└─  Field 'score' was absent from the incoming state
Strict mode — additional patterns: nested error keys, rate limit responses, empty required lists, list[int] vs list[str] type mismatches. Use in staging/CI:
watcher = ArgusWatcher(graph, strict=True)
Detection layers
ARGUS doesn't throw everything at an LLM. Detection runs in four layers, each more expensive than the last, and each only fires when needed:
-
Heuristic engine — pattern matching against 150+ known failure signatures (placeholder outputs, empty results, error keys, semantic degradation markers) plus embedding-based semantic similarity that catches paraphrased failures even when wording differs. Deterministic patterns are zero cost; semantic matching uses OpenAI embeddings with SQLite caching.
-
Anomaly detector — statistical checks for suspicious patterns (unexpected field types, output size anomalies, timing outliers). Still deterministic.
-
Correlator — traces failure propagation across nodes. If node 3 dropped a field and node 5 crashed because of it, the correlator builds the causal chain and points you at node 3, not node 5.
-
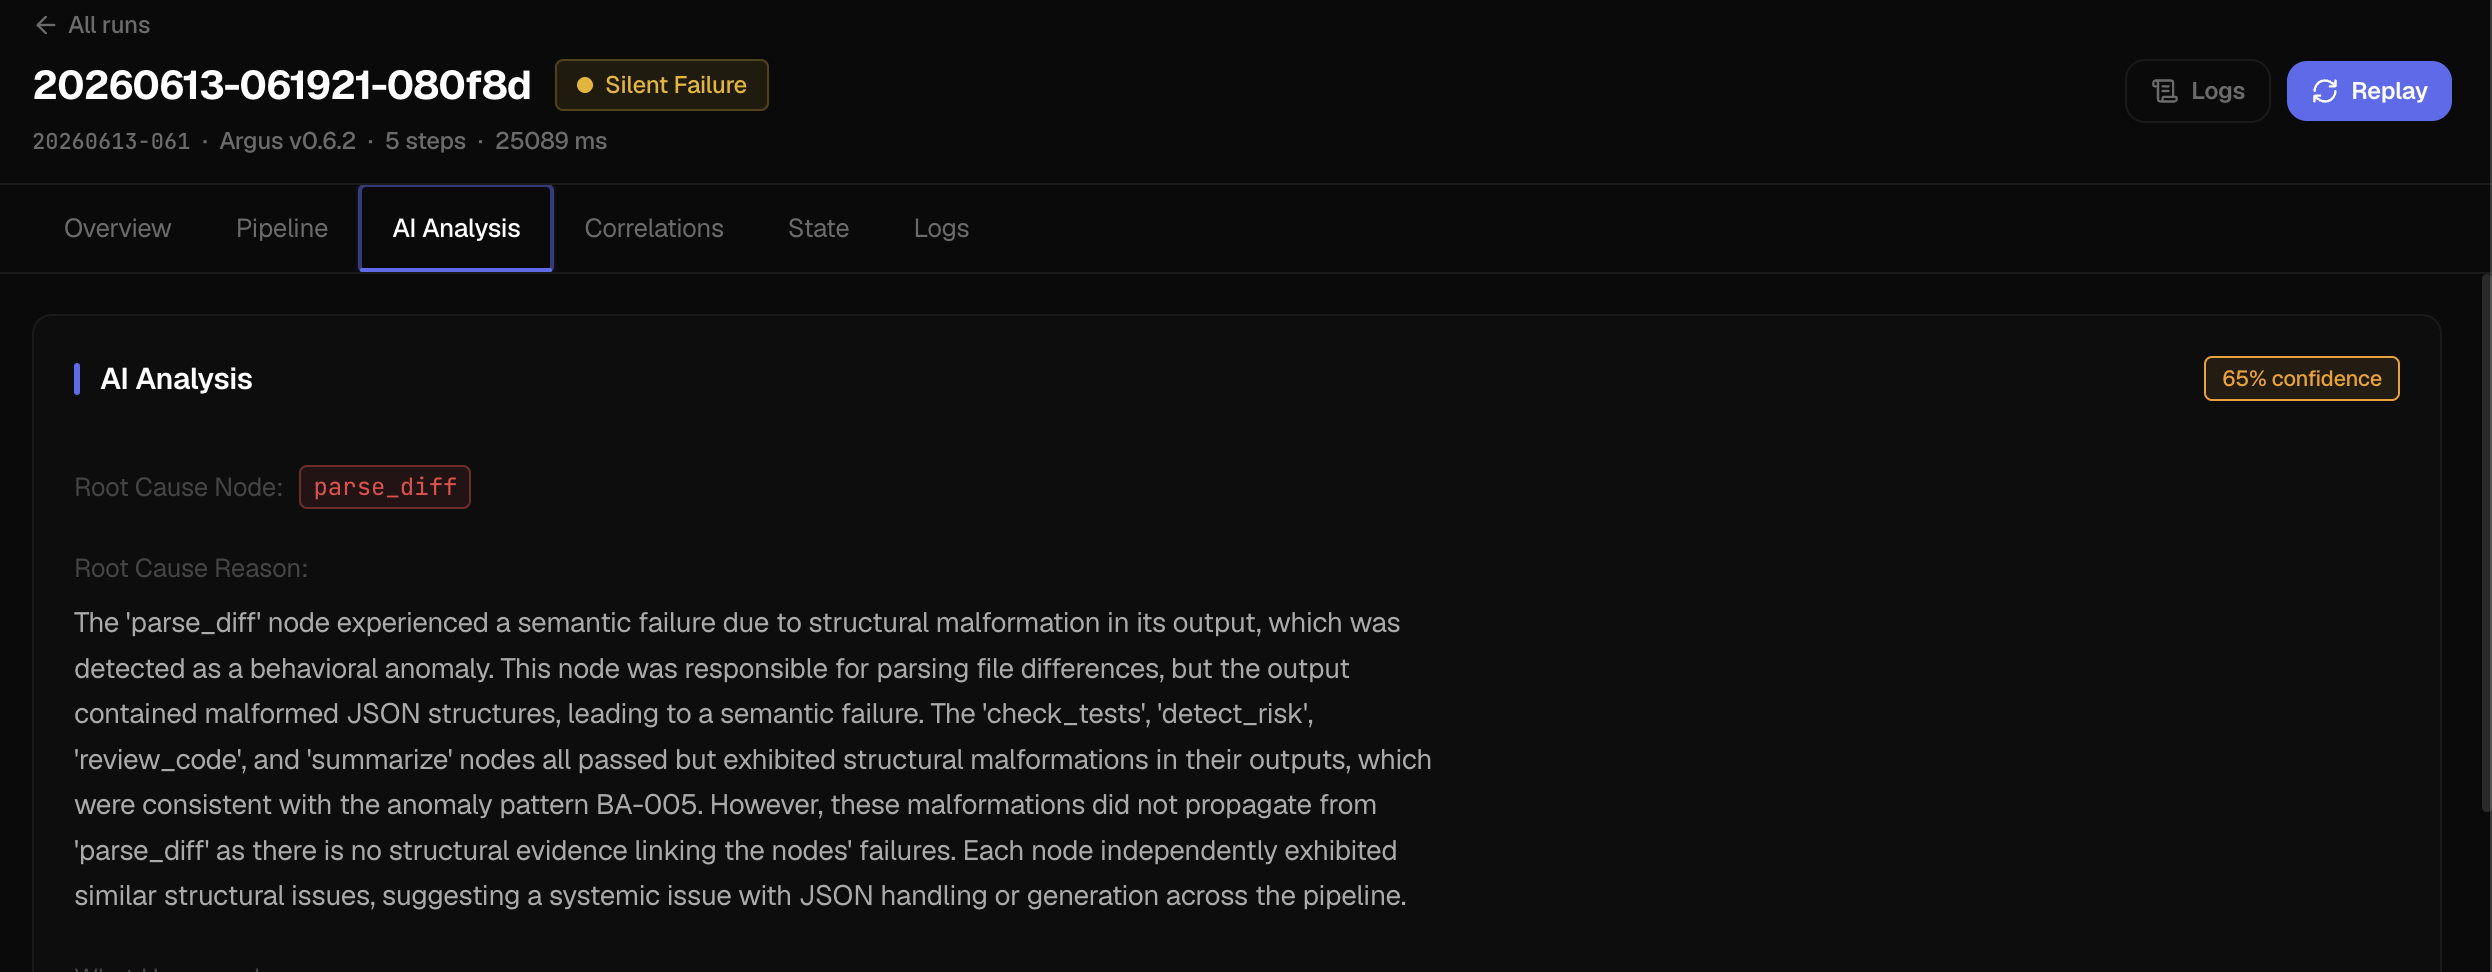
LLM investigator — only triggers on ambiguous failures or when explicitly enabled. Generates root cause explanations, causal hypotheses, and debugging suggestions. Also proposes new heuristic signatures so the same failure gets caught deterministically next time.
Output
argus  run-abc12345  ·  2024-04-05 12:30  ·  1243 ms
status  ●  silent_failure

   1  fetch       43 ms    ✓  pass
   2  validate    12 ms    ⚠  silent failure
      └─  Field "score" is missing
      └─  process received bad state
   3  process    891 ms    ✗  crashed
      └─  KeyError: 'score'
      └─  Field 'score' was absent from the incoming state

root cause   validate
Parallel nodes shown as a grouped panel. Cyclic graphs show each iteration separately. Human interrupt chains stitched into one trace on resume.
Replay
A 10-node pipeline fails at node 7. You fix the bug. Instead of re-running nodes 1–6 and burning API credits:
argus replay <run-id> node_7
ARGUS restores the exact state at node 7 from disk and runs from there. Upstream outputs stay frozen. Only node 7 onward re-executes with your fixed code.
Run just one node in isolation:
argus replay <run-id> node_7 --only
From the web UI — hover any step, click ↺ Rerun From Here. After rerun, the diff view opens automatically.
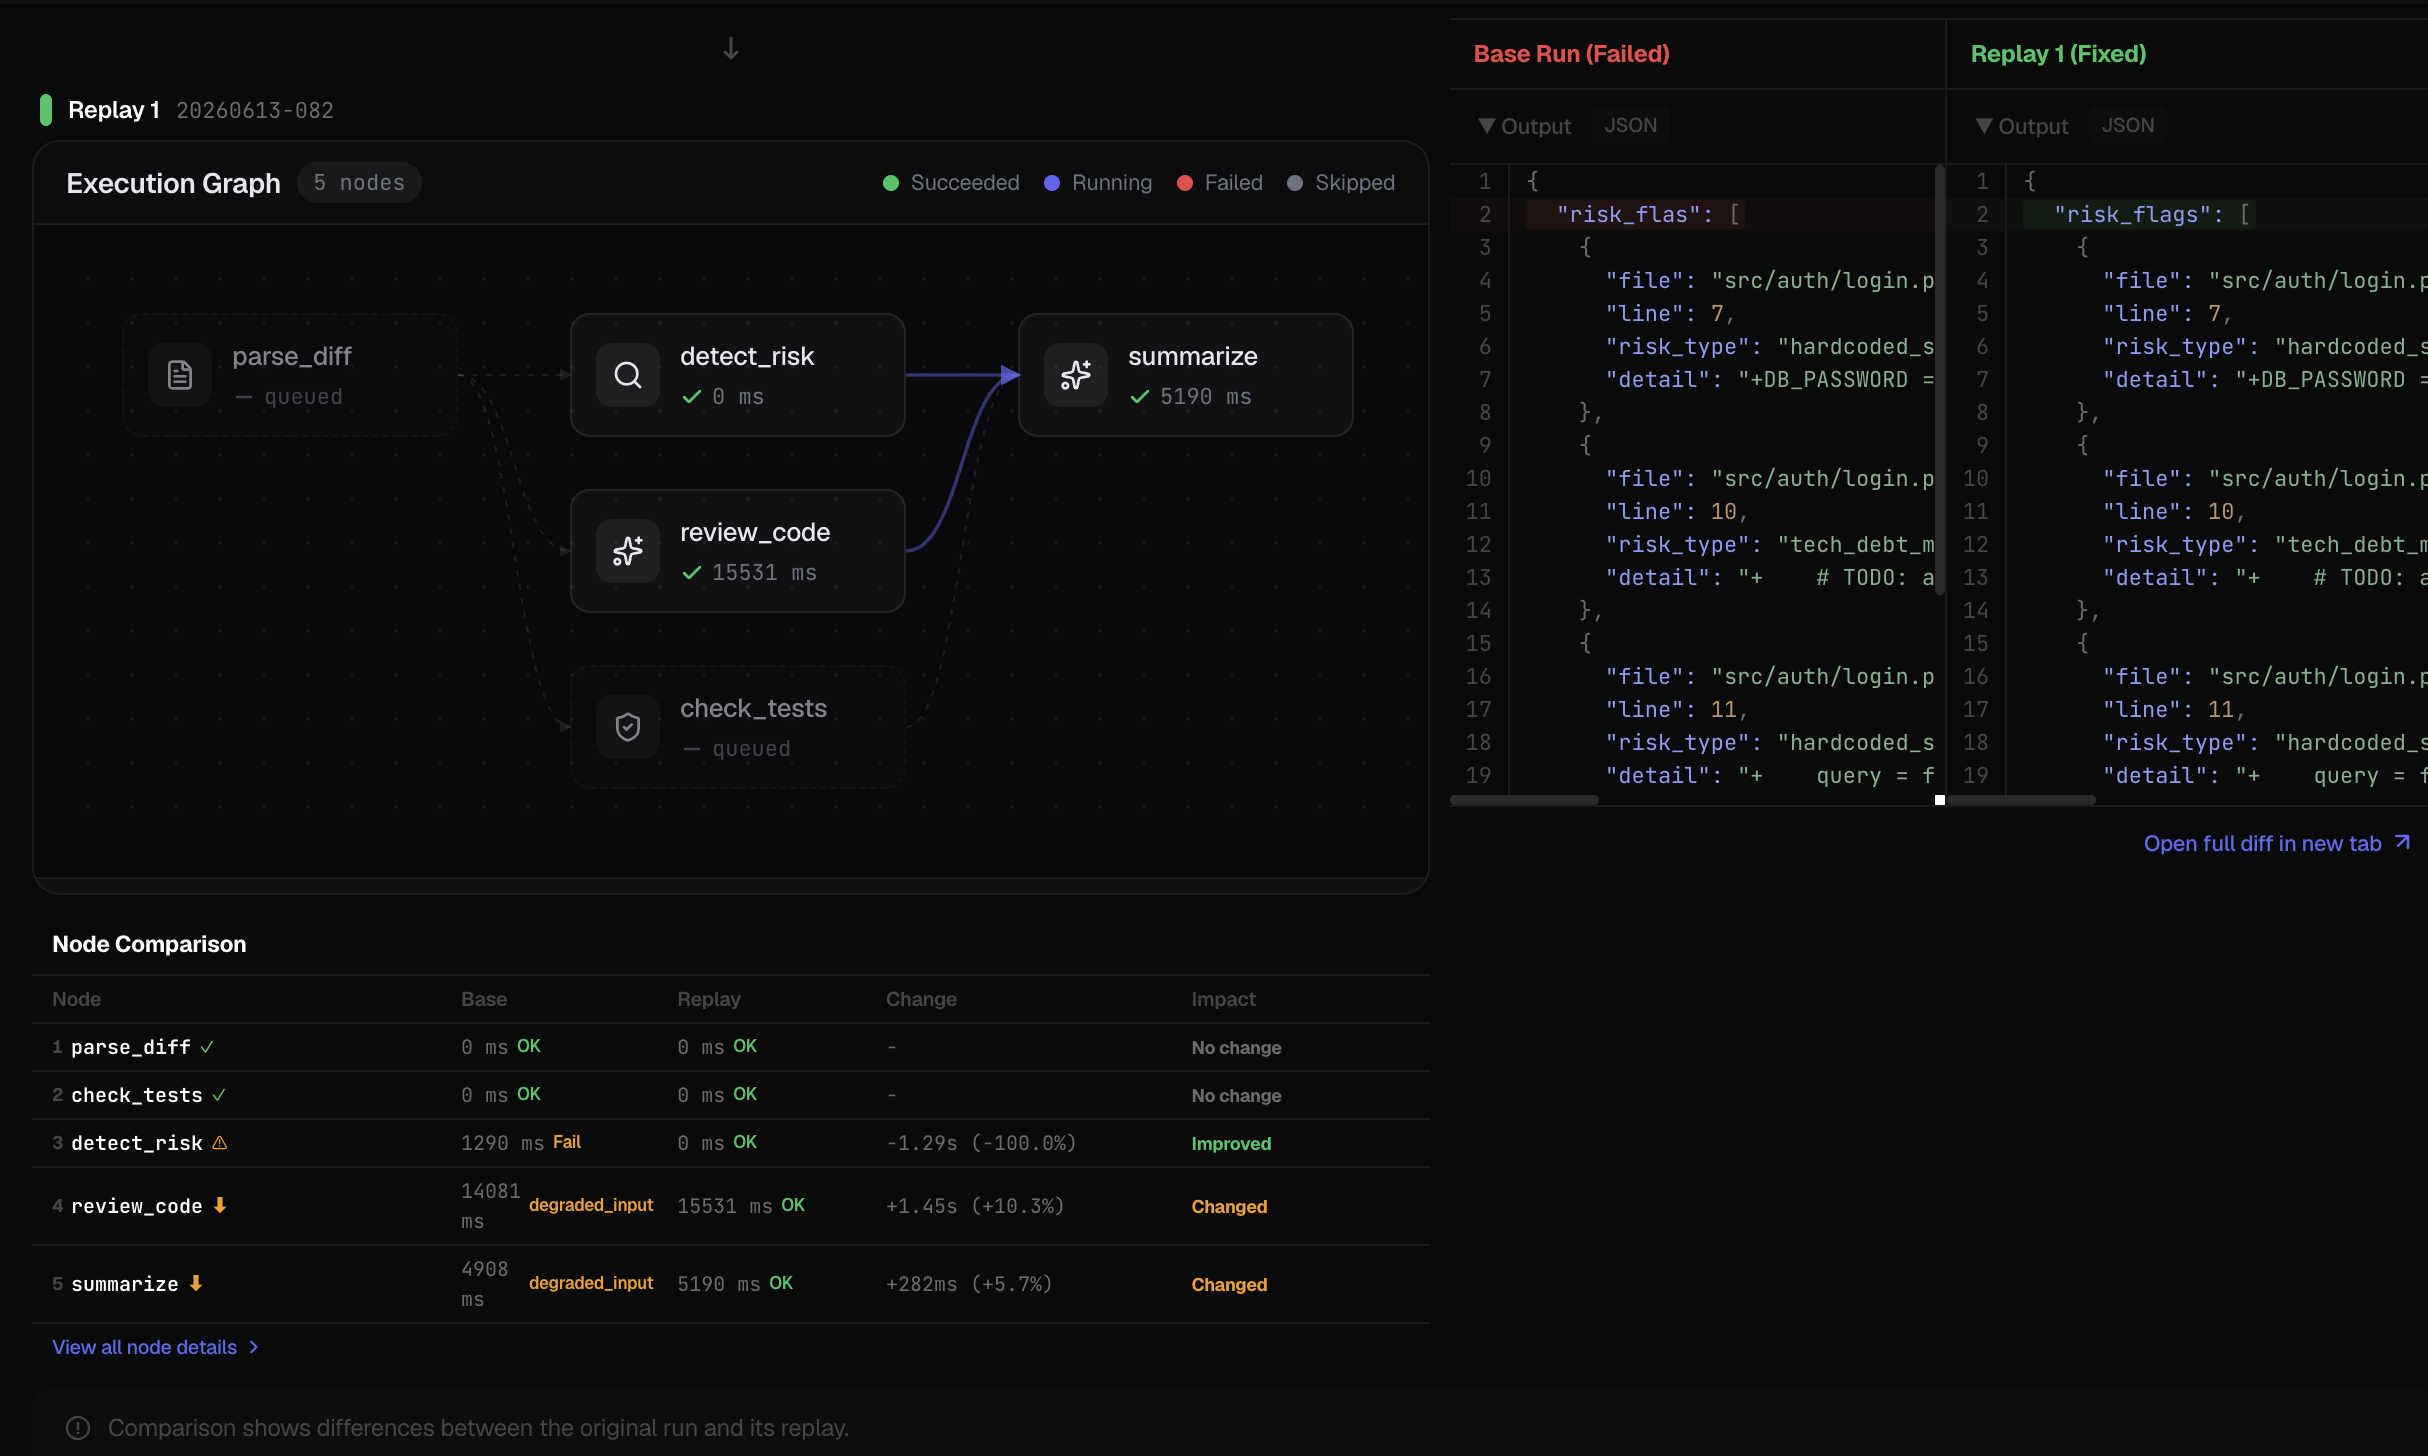
argus diff <rerun-id> # compare rerun vs original
External API calls
All external HTTP calls (OpenAI, search tools, databases) are recorded by default. Every API response is saved to disk alongside the run. During replay, the recorded responses are served back — same data, zero extra cost, fully reproducible.
To disable recording (e.g. for lightweight monitoring without replay):
watcher = ArgusWatcher(graph, record_http=False)
Auto-comparison
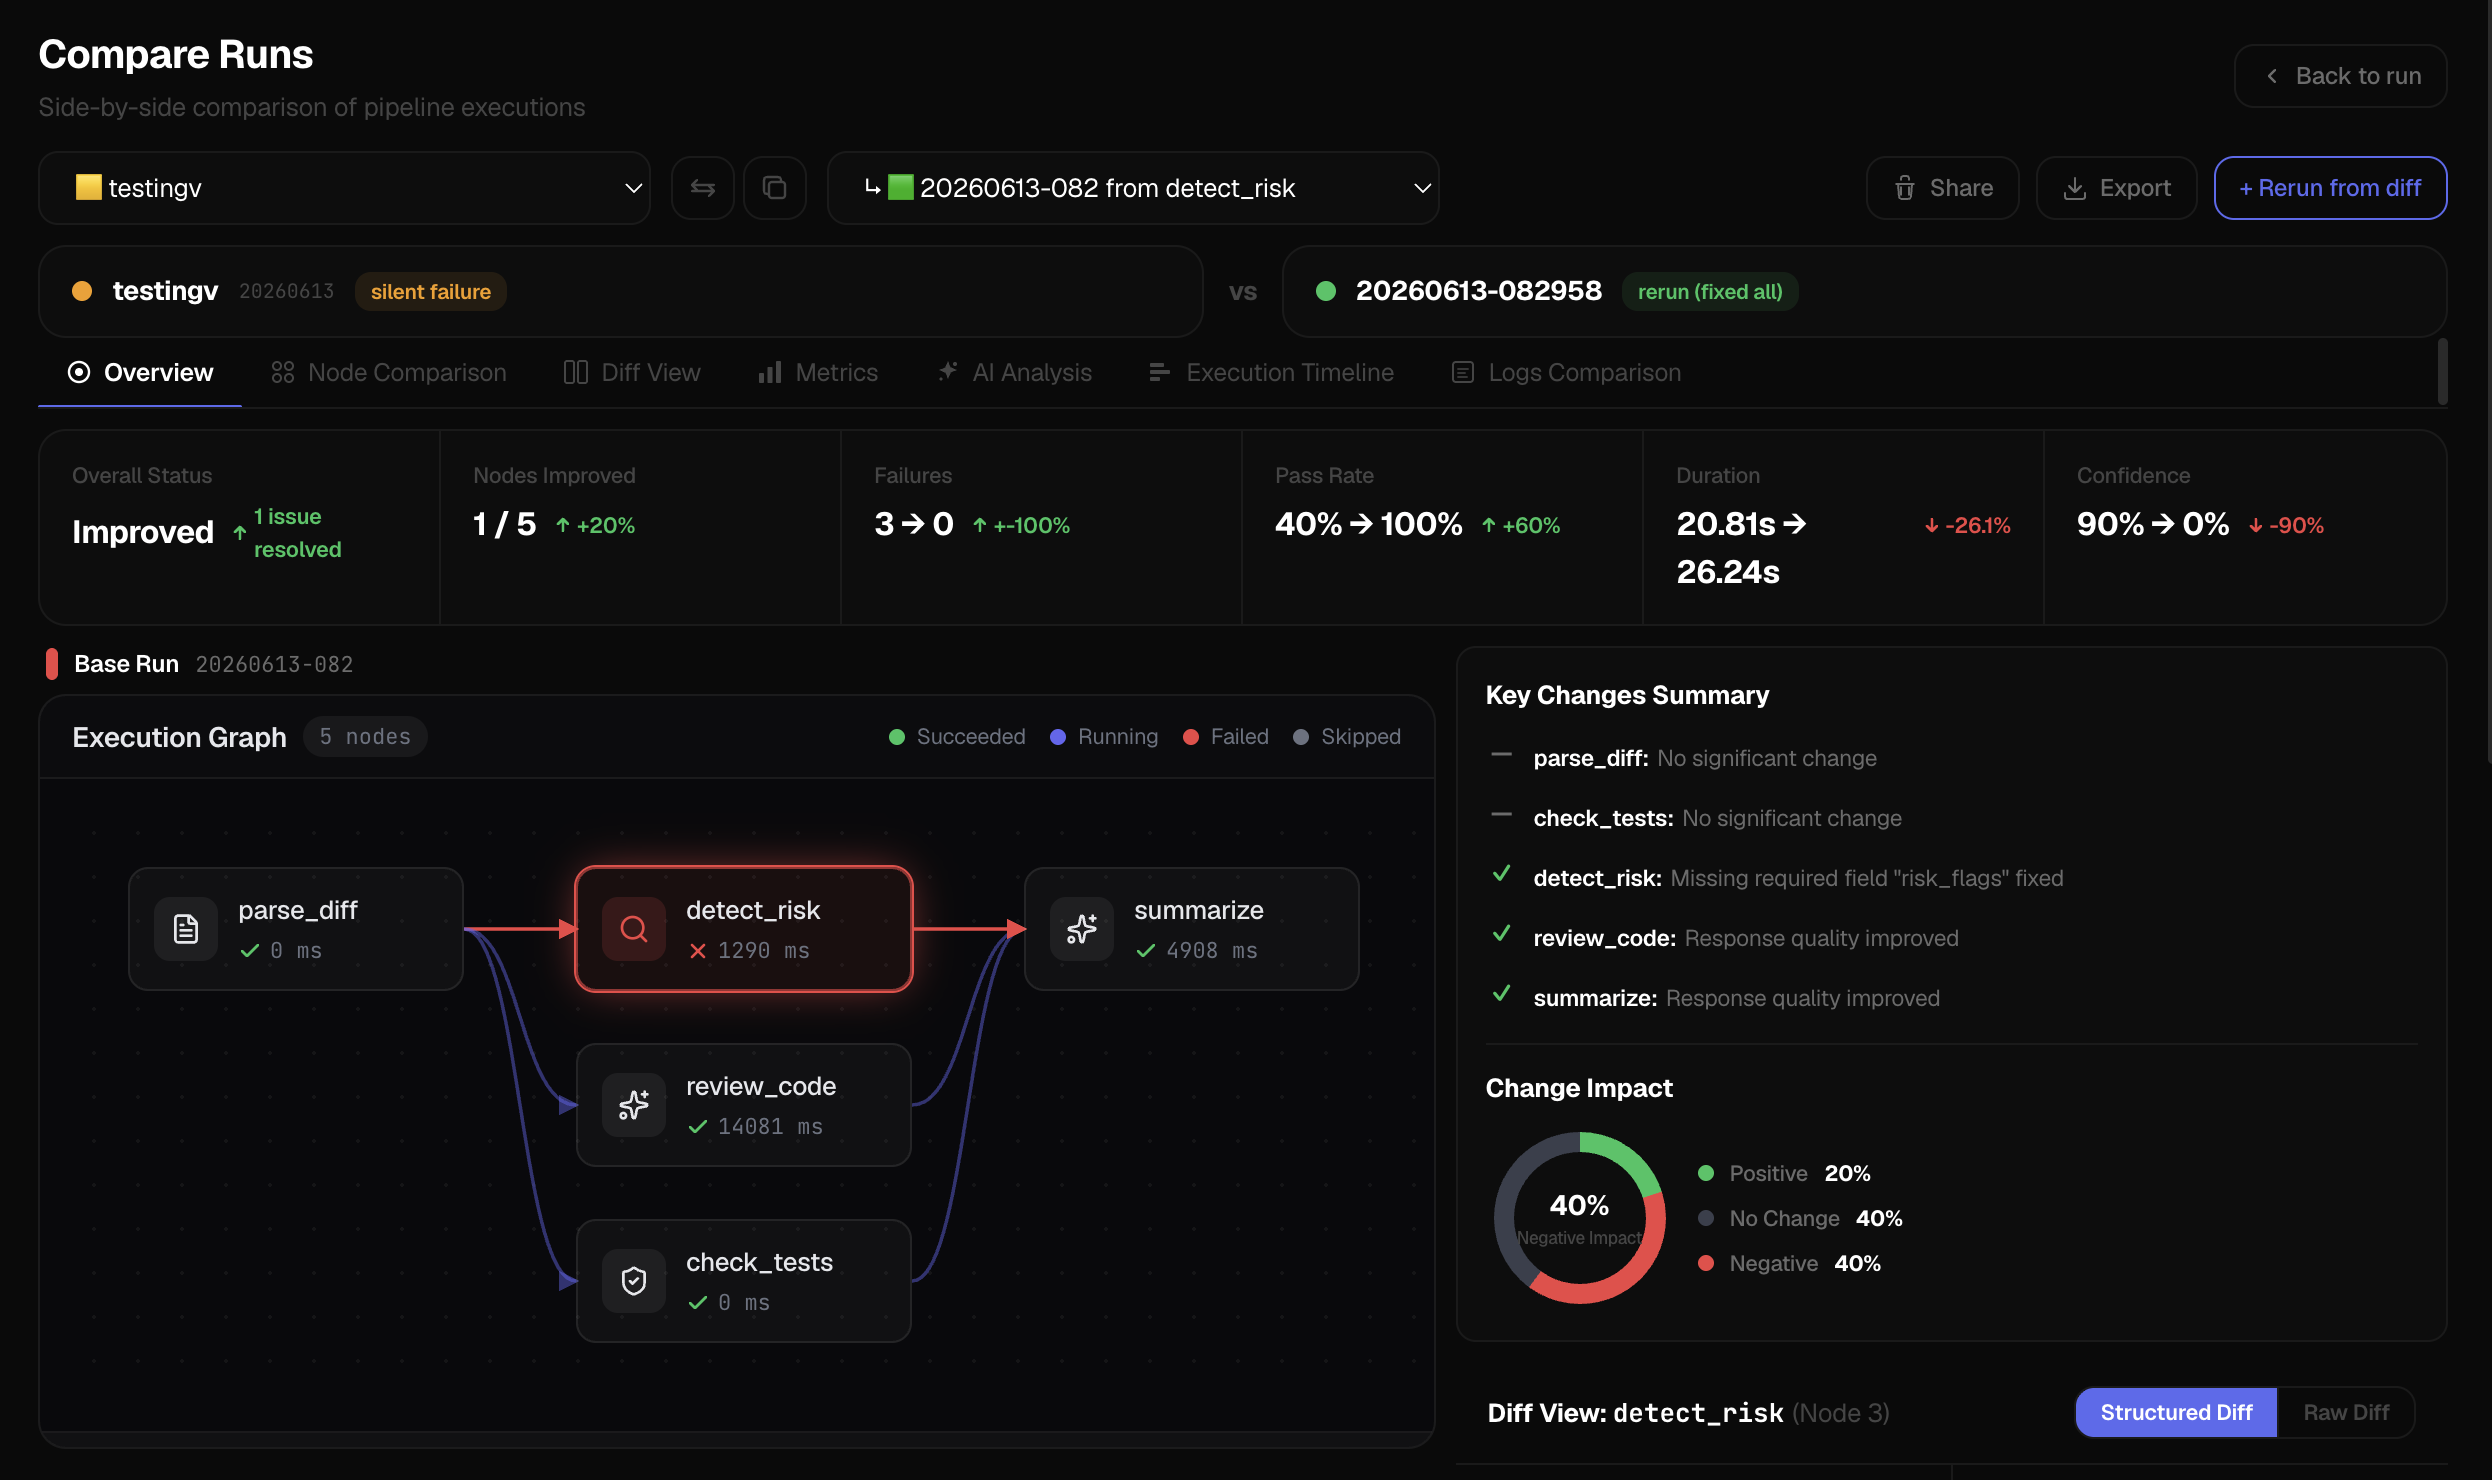
When a replay finishes, ARGUS automatically compares it against the original run using an LLM. You get a per-node diff showing what changed, what improved, and whether the fix actually worked — without eyeballing two JSON blobs.
Semantic Judge (LLM-powered)
Deterministic checks catch ~80% of production failures (missing fields, empty results, type mismatches, placeholder outputs). For the remaining 20% — subtle quality issues like wrong tone, unhelpful responses, or outdated information — enable the semantic judge:
watcher = ArgusWatcher(graph, semantic_judge=True)
The judge runs after deterministic checks on every passing node. It evaluates output quality and flags issues that pattern matching can't catch.
The judge will not override a clear heuristic failure — if the heuristic engine already flagged something with high confidence, the LLM won't second-guess it. It only steps in when the picture is ambiguous.
# With a specific model
watcher = ArgusWatcher(graph, semantic_judge=True, judge_model="gpt-4o")
Requires OPENAI_API_KEY in your environment.
When to use: complex multi-agent pipelines, customer-facing outputs, LLM-generated content where quality matters.
When to skip: simple pipelines, CI/CD speed runs, zero-cost monitoring.
Adaptive Learning
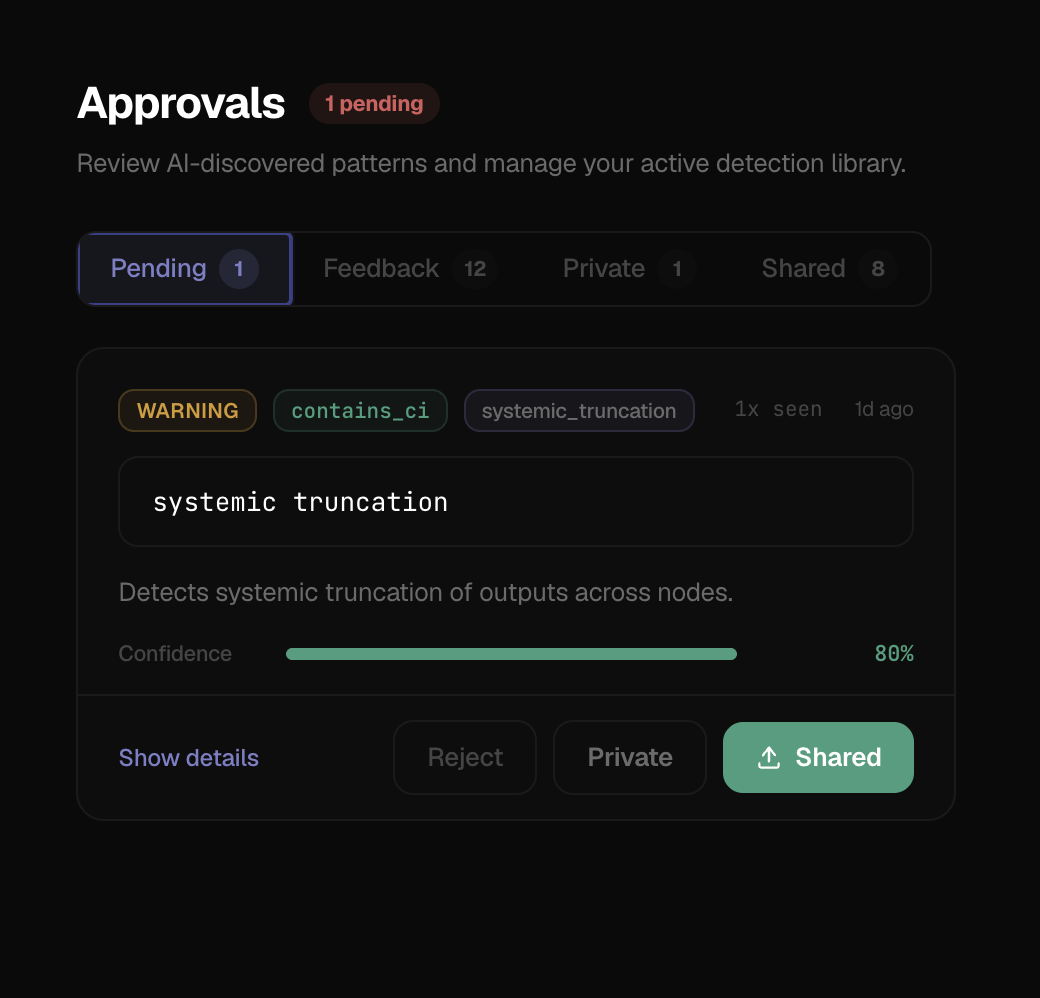
ARGUS learns from your runs. When the semantic judge discovers a new failure pattern, it proposes a candidate signature. You review it in the Approvals page (argus ui) and choose:
- Private — adds to your local heuristic engine only
- Shared — pushes to the cloud so every ARGUS user benefits
The heuristic engine loads from three tiers: bundled (ships with ARGUS) → private (your local patterns) → shared (community-contributed, synced from cloud). All three are merged and deduplicated at startup.
argus ui          # open Approvals page to review candidates
argus login       # required for cloud sync
Semantic Similarity Matching
Lexical pattern matching misses paraphrased failures. "I cannot provide financial advice" won't catch "I'm unable to offer investment guidance" — same meaning, different wording.
ARGUS v0.7.0 adds embedding-based semantic similarity to the heuristic engine. Six built-in signatures detect common LLM failure patterns (refusals, disclaimers, capability hedges, context insufficiency) regardless of exact wording.
How it works:
- Signature patterns and node outputs are converted to vector embeddings via OpenAI
text-embedding-3-small - Cosine similarity is computed between the output and each semantic signature
- If similarity exceeds the threshold (default 0.75, configurable per-signature), the output is flagged
- All embeddings are cached in a local SQLite database — repeat scans are instant
# No config needed — semantic signatures are part of the bundled registry
watcher = ArgusWatcher(graph)  # semantic matching is automatic
Requires OPENAI_API_KEY in your environment. If the key is absent, semantic signatures are silently skipped and all other detection layers continue working.
Diagnostic Reports
Found something weird? Hit Report Issue on any run detail page, or open Report Board from the sidebar.
Pick a category — bug, feature request, improvement, setup issue, or unexpected result — add a description, and ARGUS sends a sanitized diagnostic payload. No input/output data or credentials leave your machine, just system info (Python/LangGraph versions), storage health, and node-level metadata (names, statuses, durations, error messages).
Reports go to:
- Supabase — stored for triage
- Discord — real-time notification with formatted embed
- Linear — optional, creates a labeled issue in your team's board (configure in Settings)
No login required to submit a report.
Linear Integration
Connect your Linear workspace from the Settings page in the web UI:
- Add your Linear API key
- Select a team
- Done — every report you send can optionally create a Linear issue with the right label (Bug, Feature, Improvement, etc.)
Labels are auto-created if they don't exist in your team. Issues include full diagnostics, root cause chain, and step statuses in a readable markdown format.
Diagnose setup issues
argus doctor
✓  python           Python 3.9.6
✓  langgraph        langgraph 0.6.11
✓  storage          312 runs stored, all healthy
✓  replay           all 7 node functions importable for rerun
✓  optional deps    openai (key set), dotenv
5 seconds to know if something is wrong — Python version, LangGraph compatibility, storage health, rerun readiness.
CLI
argus list                          # all runs
argus show last                     # most recent run
argus show run <id>                 # by full id or 8-char prefix
argus replay <id> <node>            # re-run from a node
argus replay <id> <node> --only     # re-run just that one node
argus inspect <id> --step <node>    # raw input/output for a node
argus diff <id>                     # rerun vs original
argus diff <id-a> <id-b>            # any two runs
argus ui                            # open web dashboard
argus doctor                        # check your setup
argus login                         # sign in for cloud sync
argus logout                        # clear credentials
argus whoami                        # check login status
argus update                        # check for new release
Web UI
argus ui
Opens at http://localhost:7842. Serves runs from .argus/runs/ in your current directory — no account needed.
Runs List
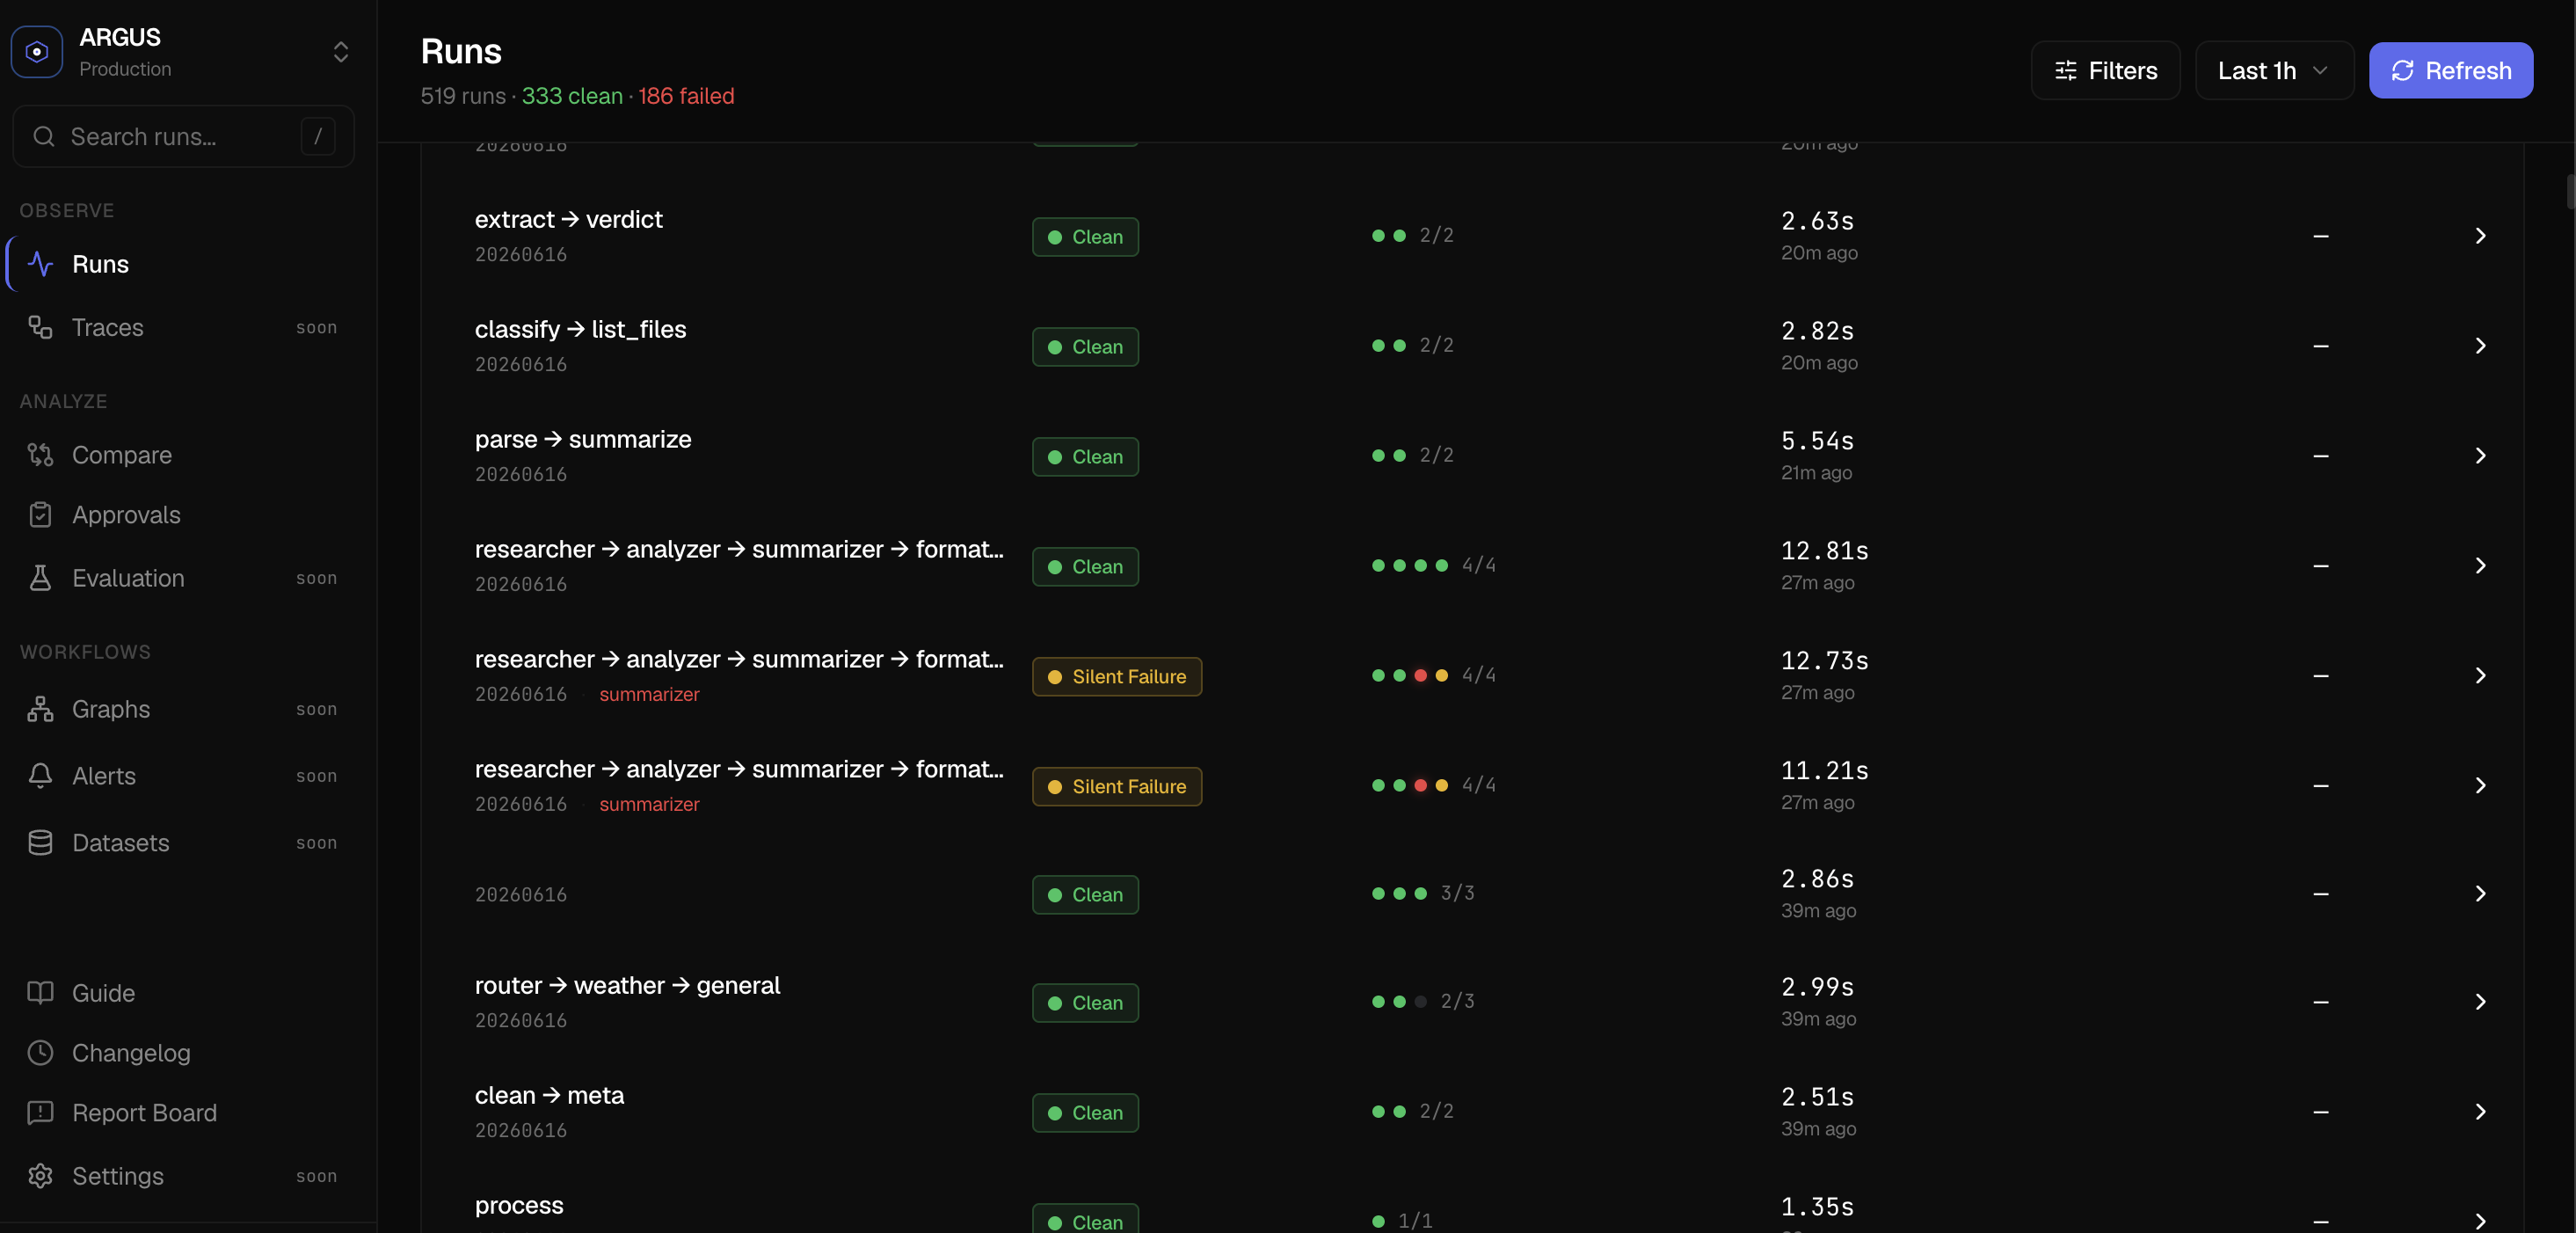
Run Detail
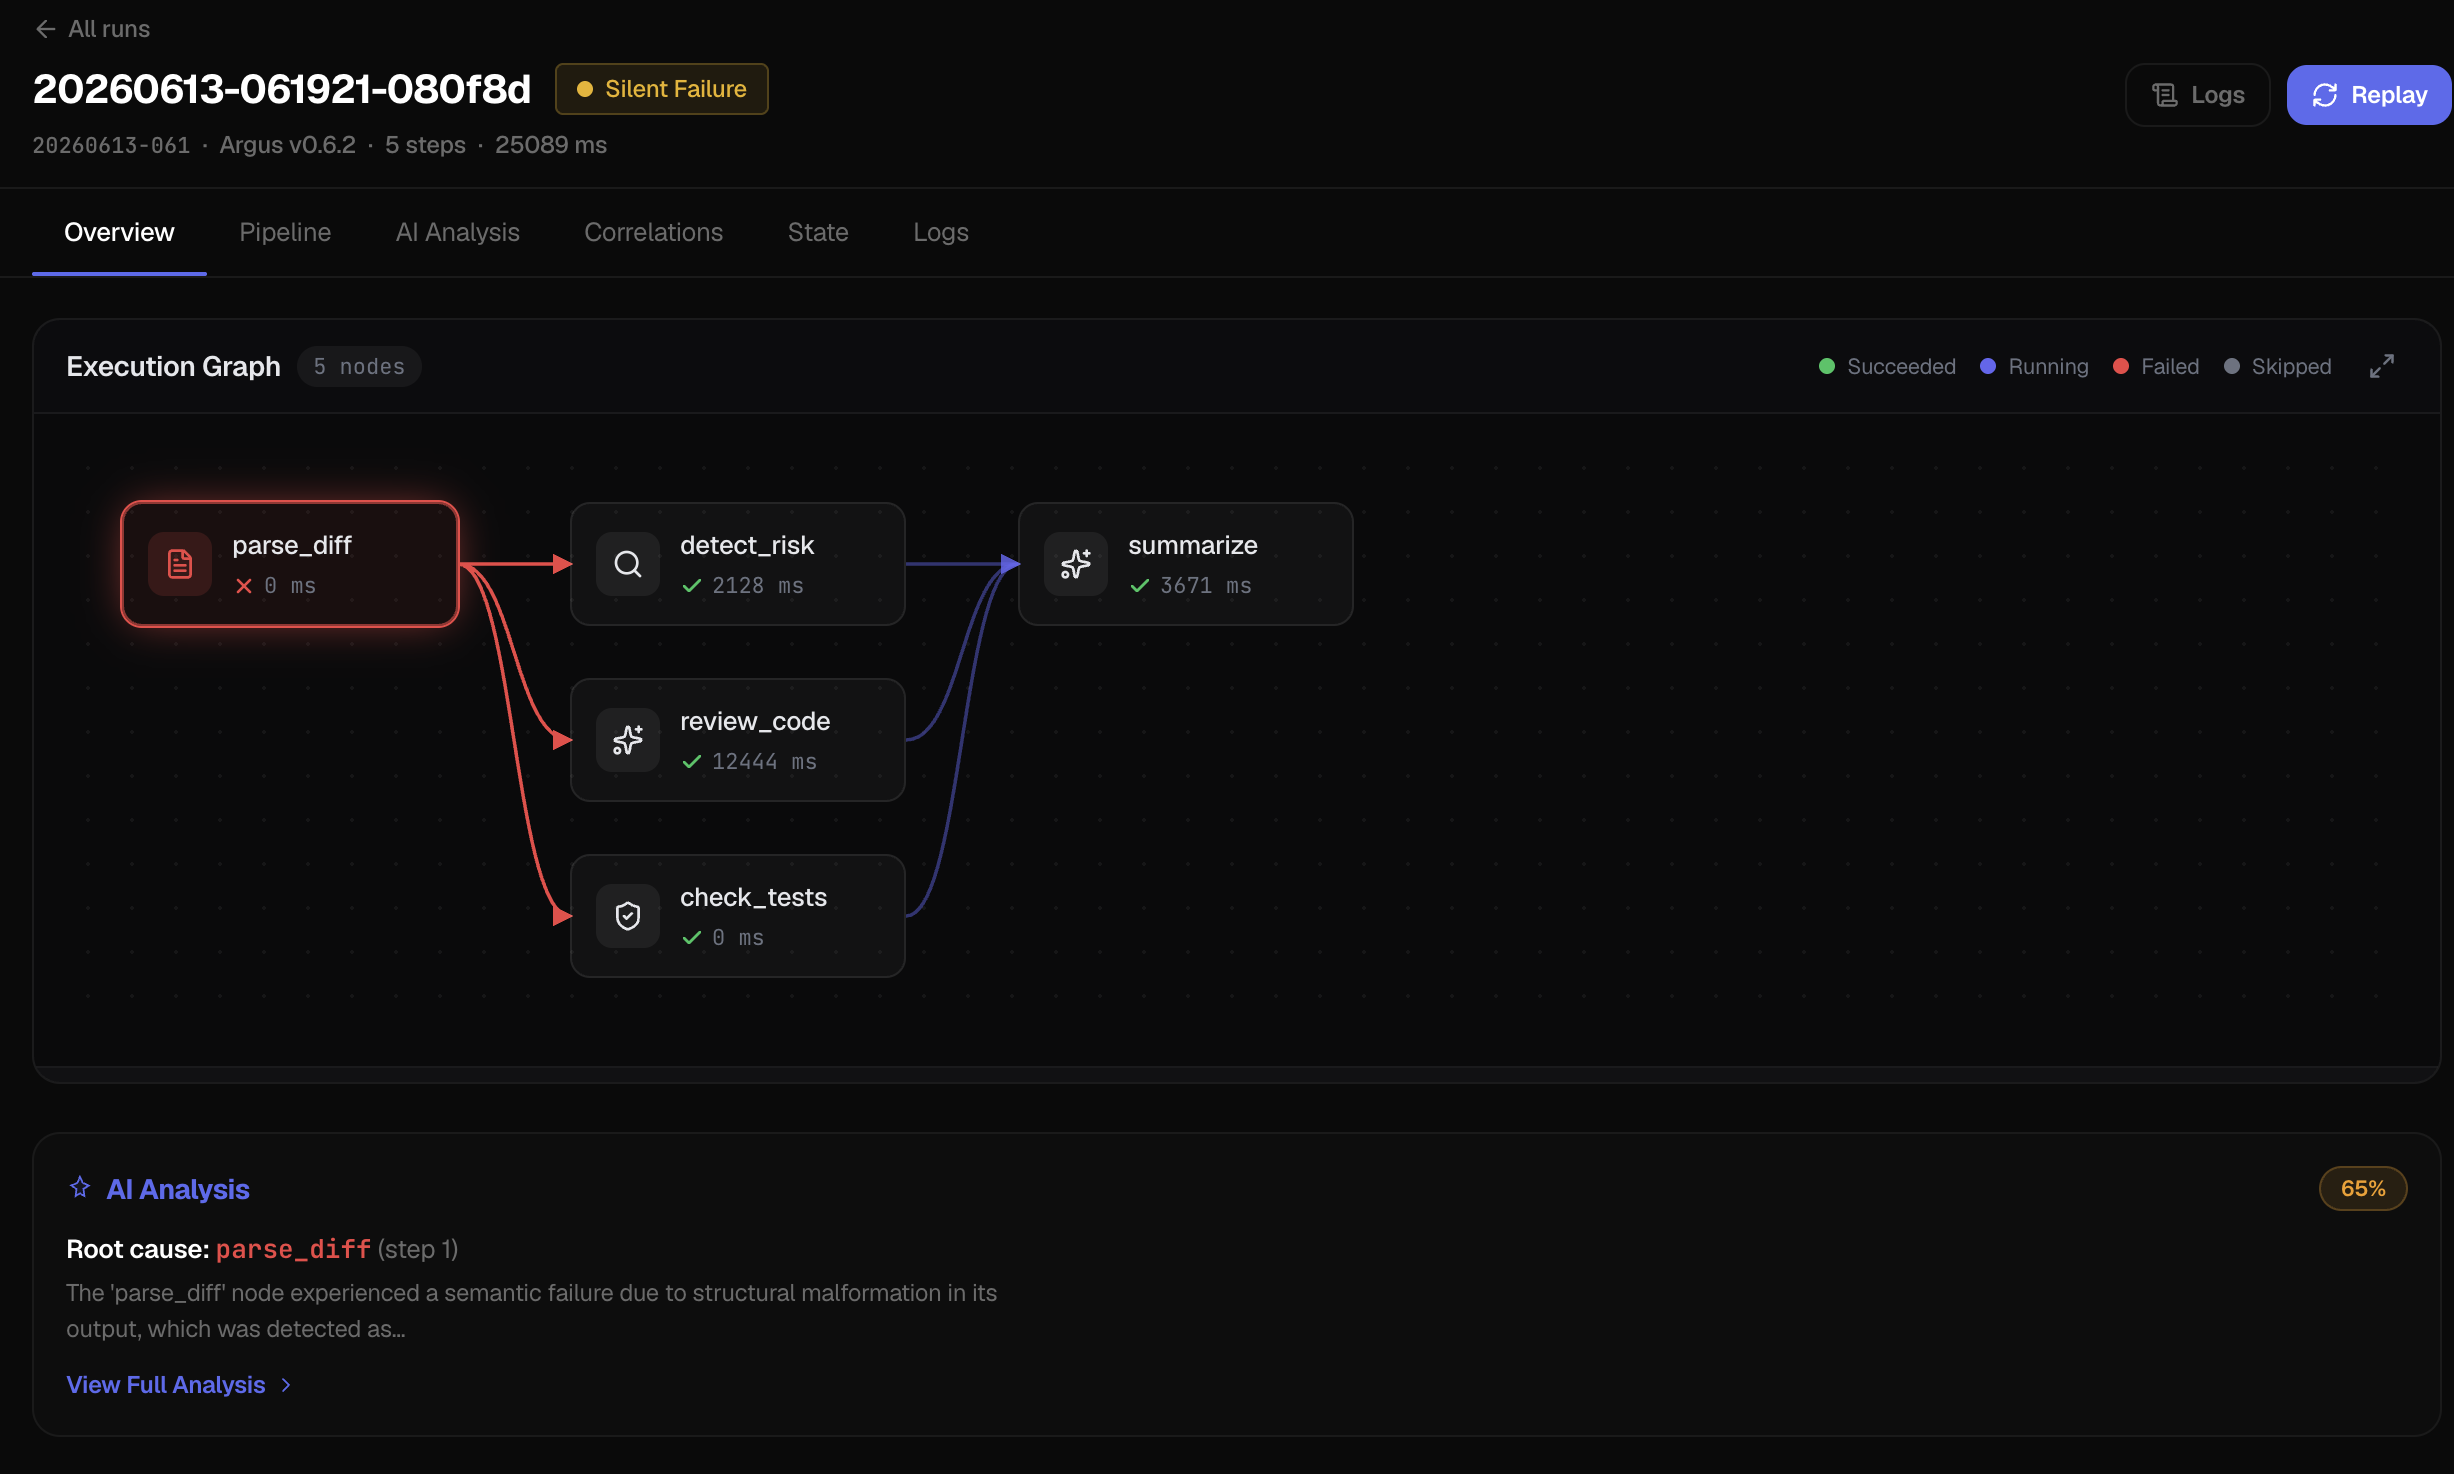 |
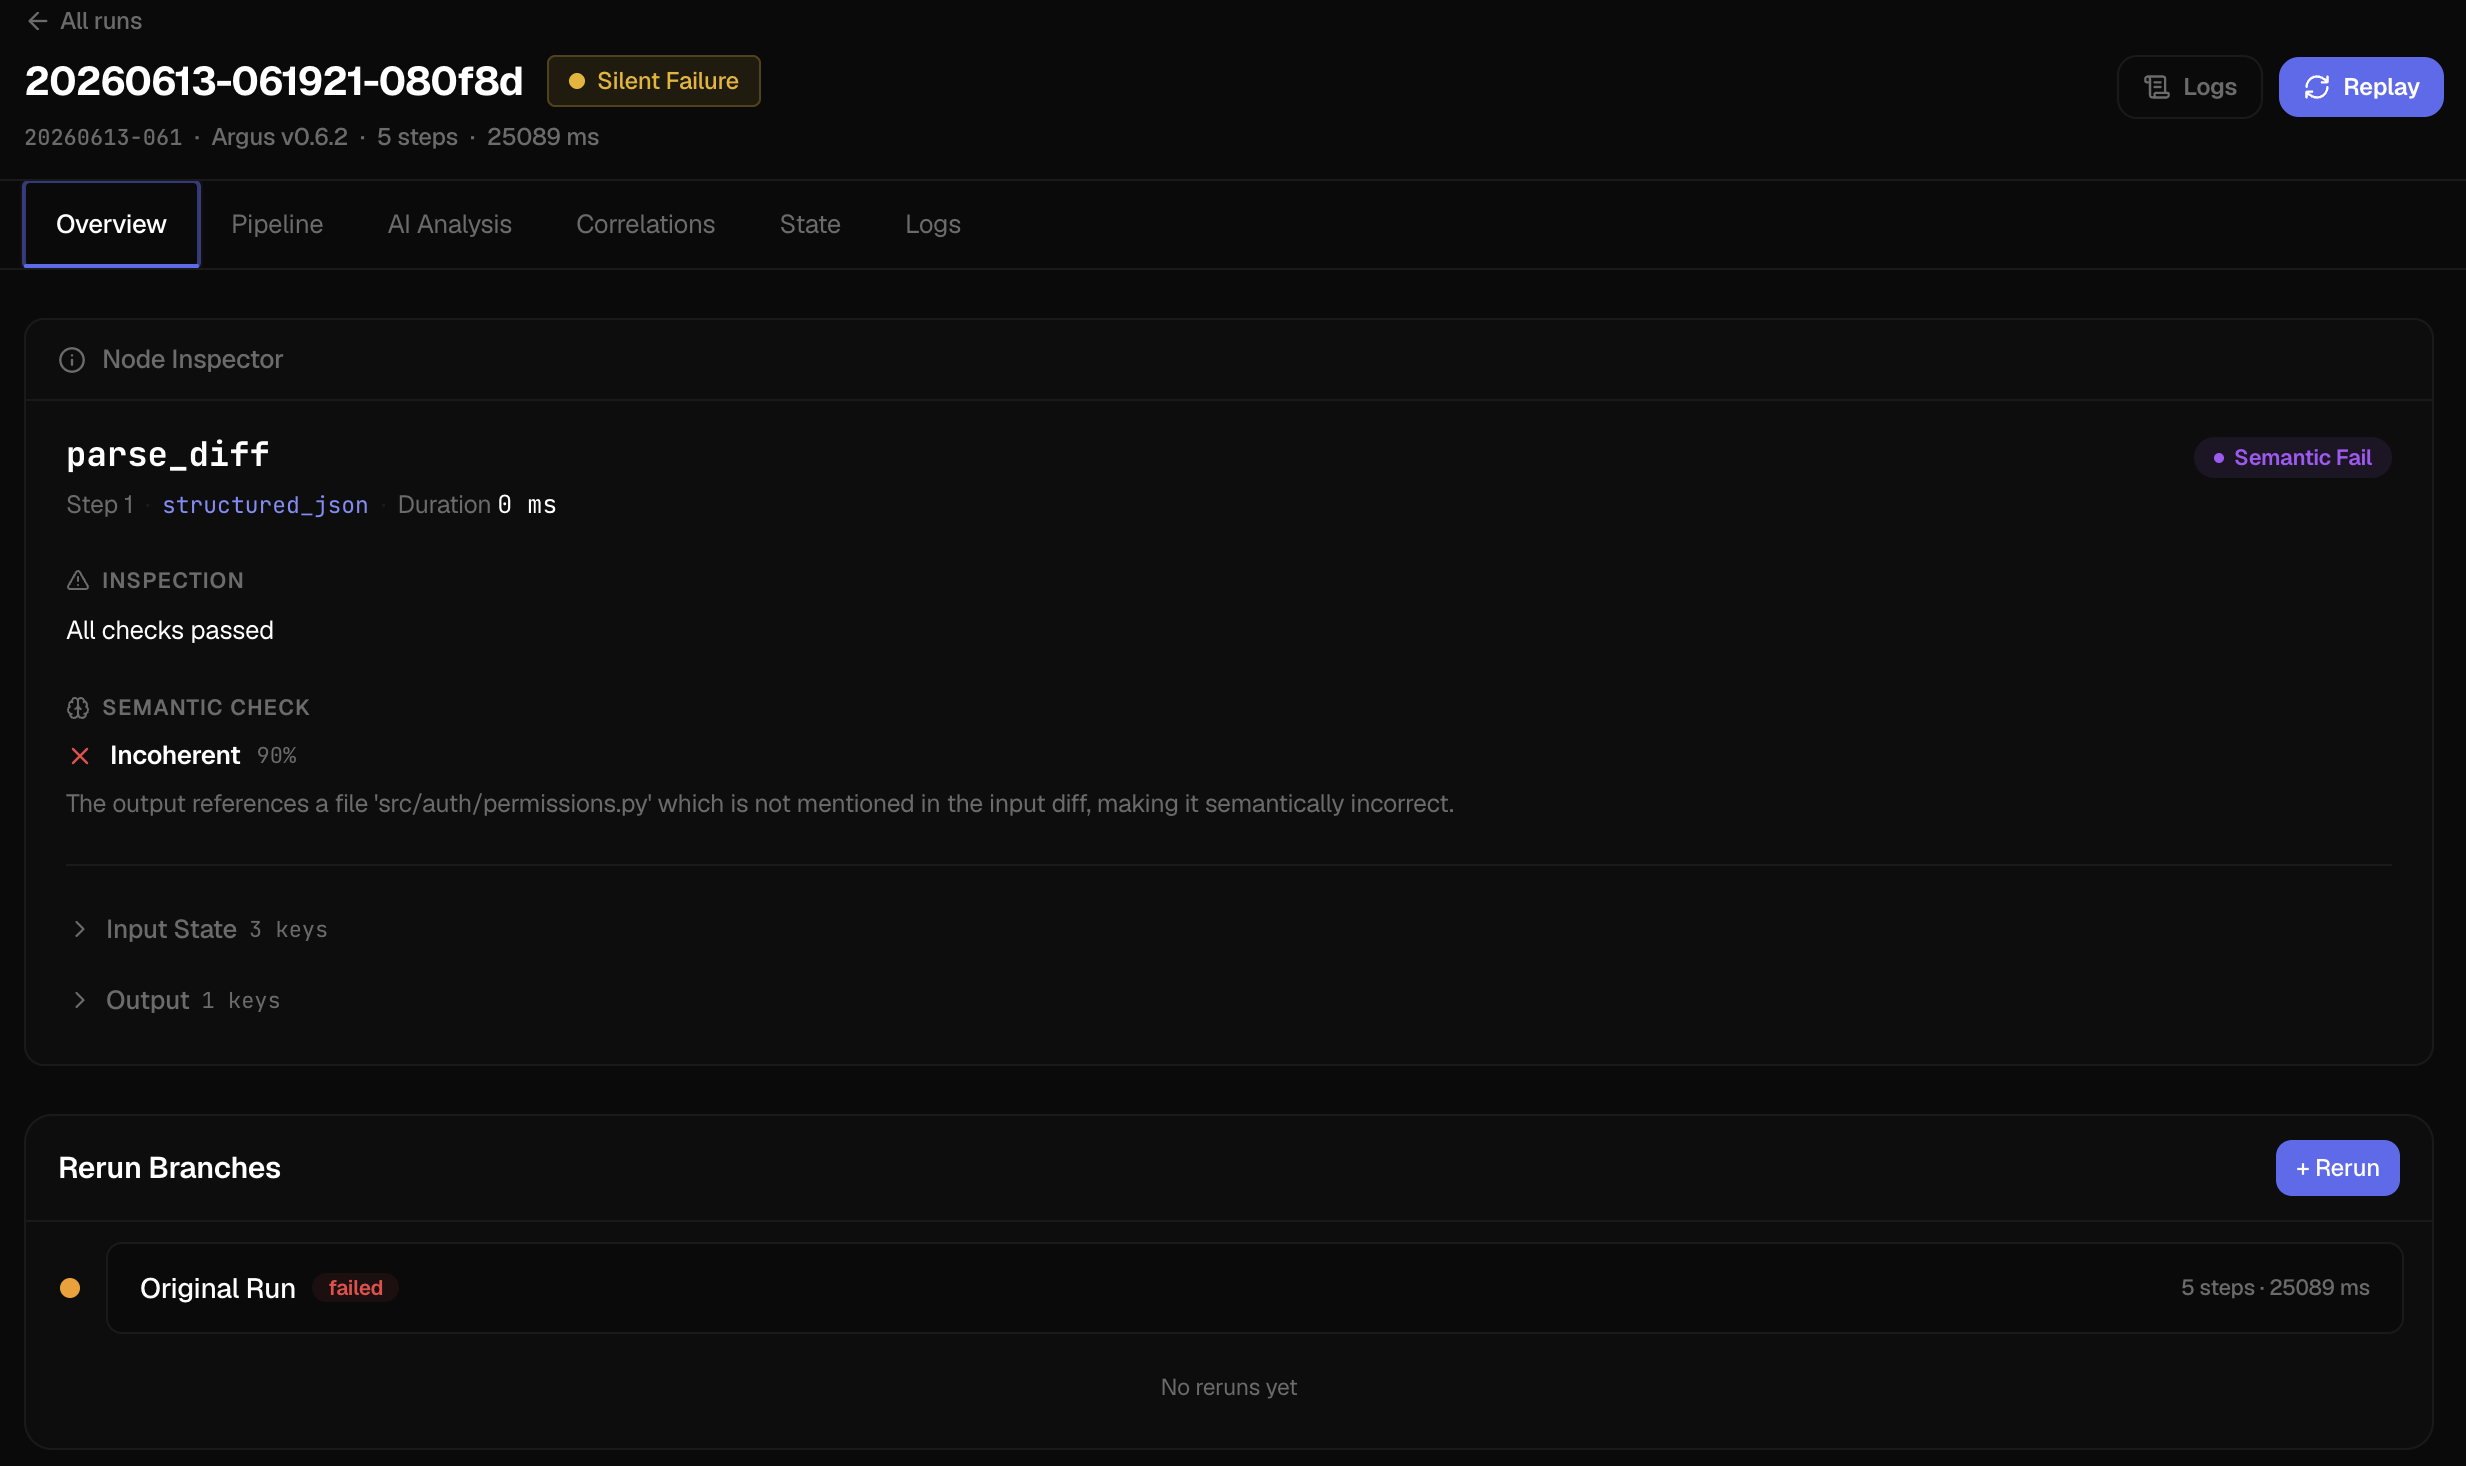 |
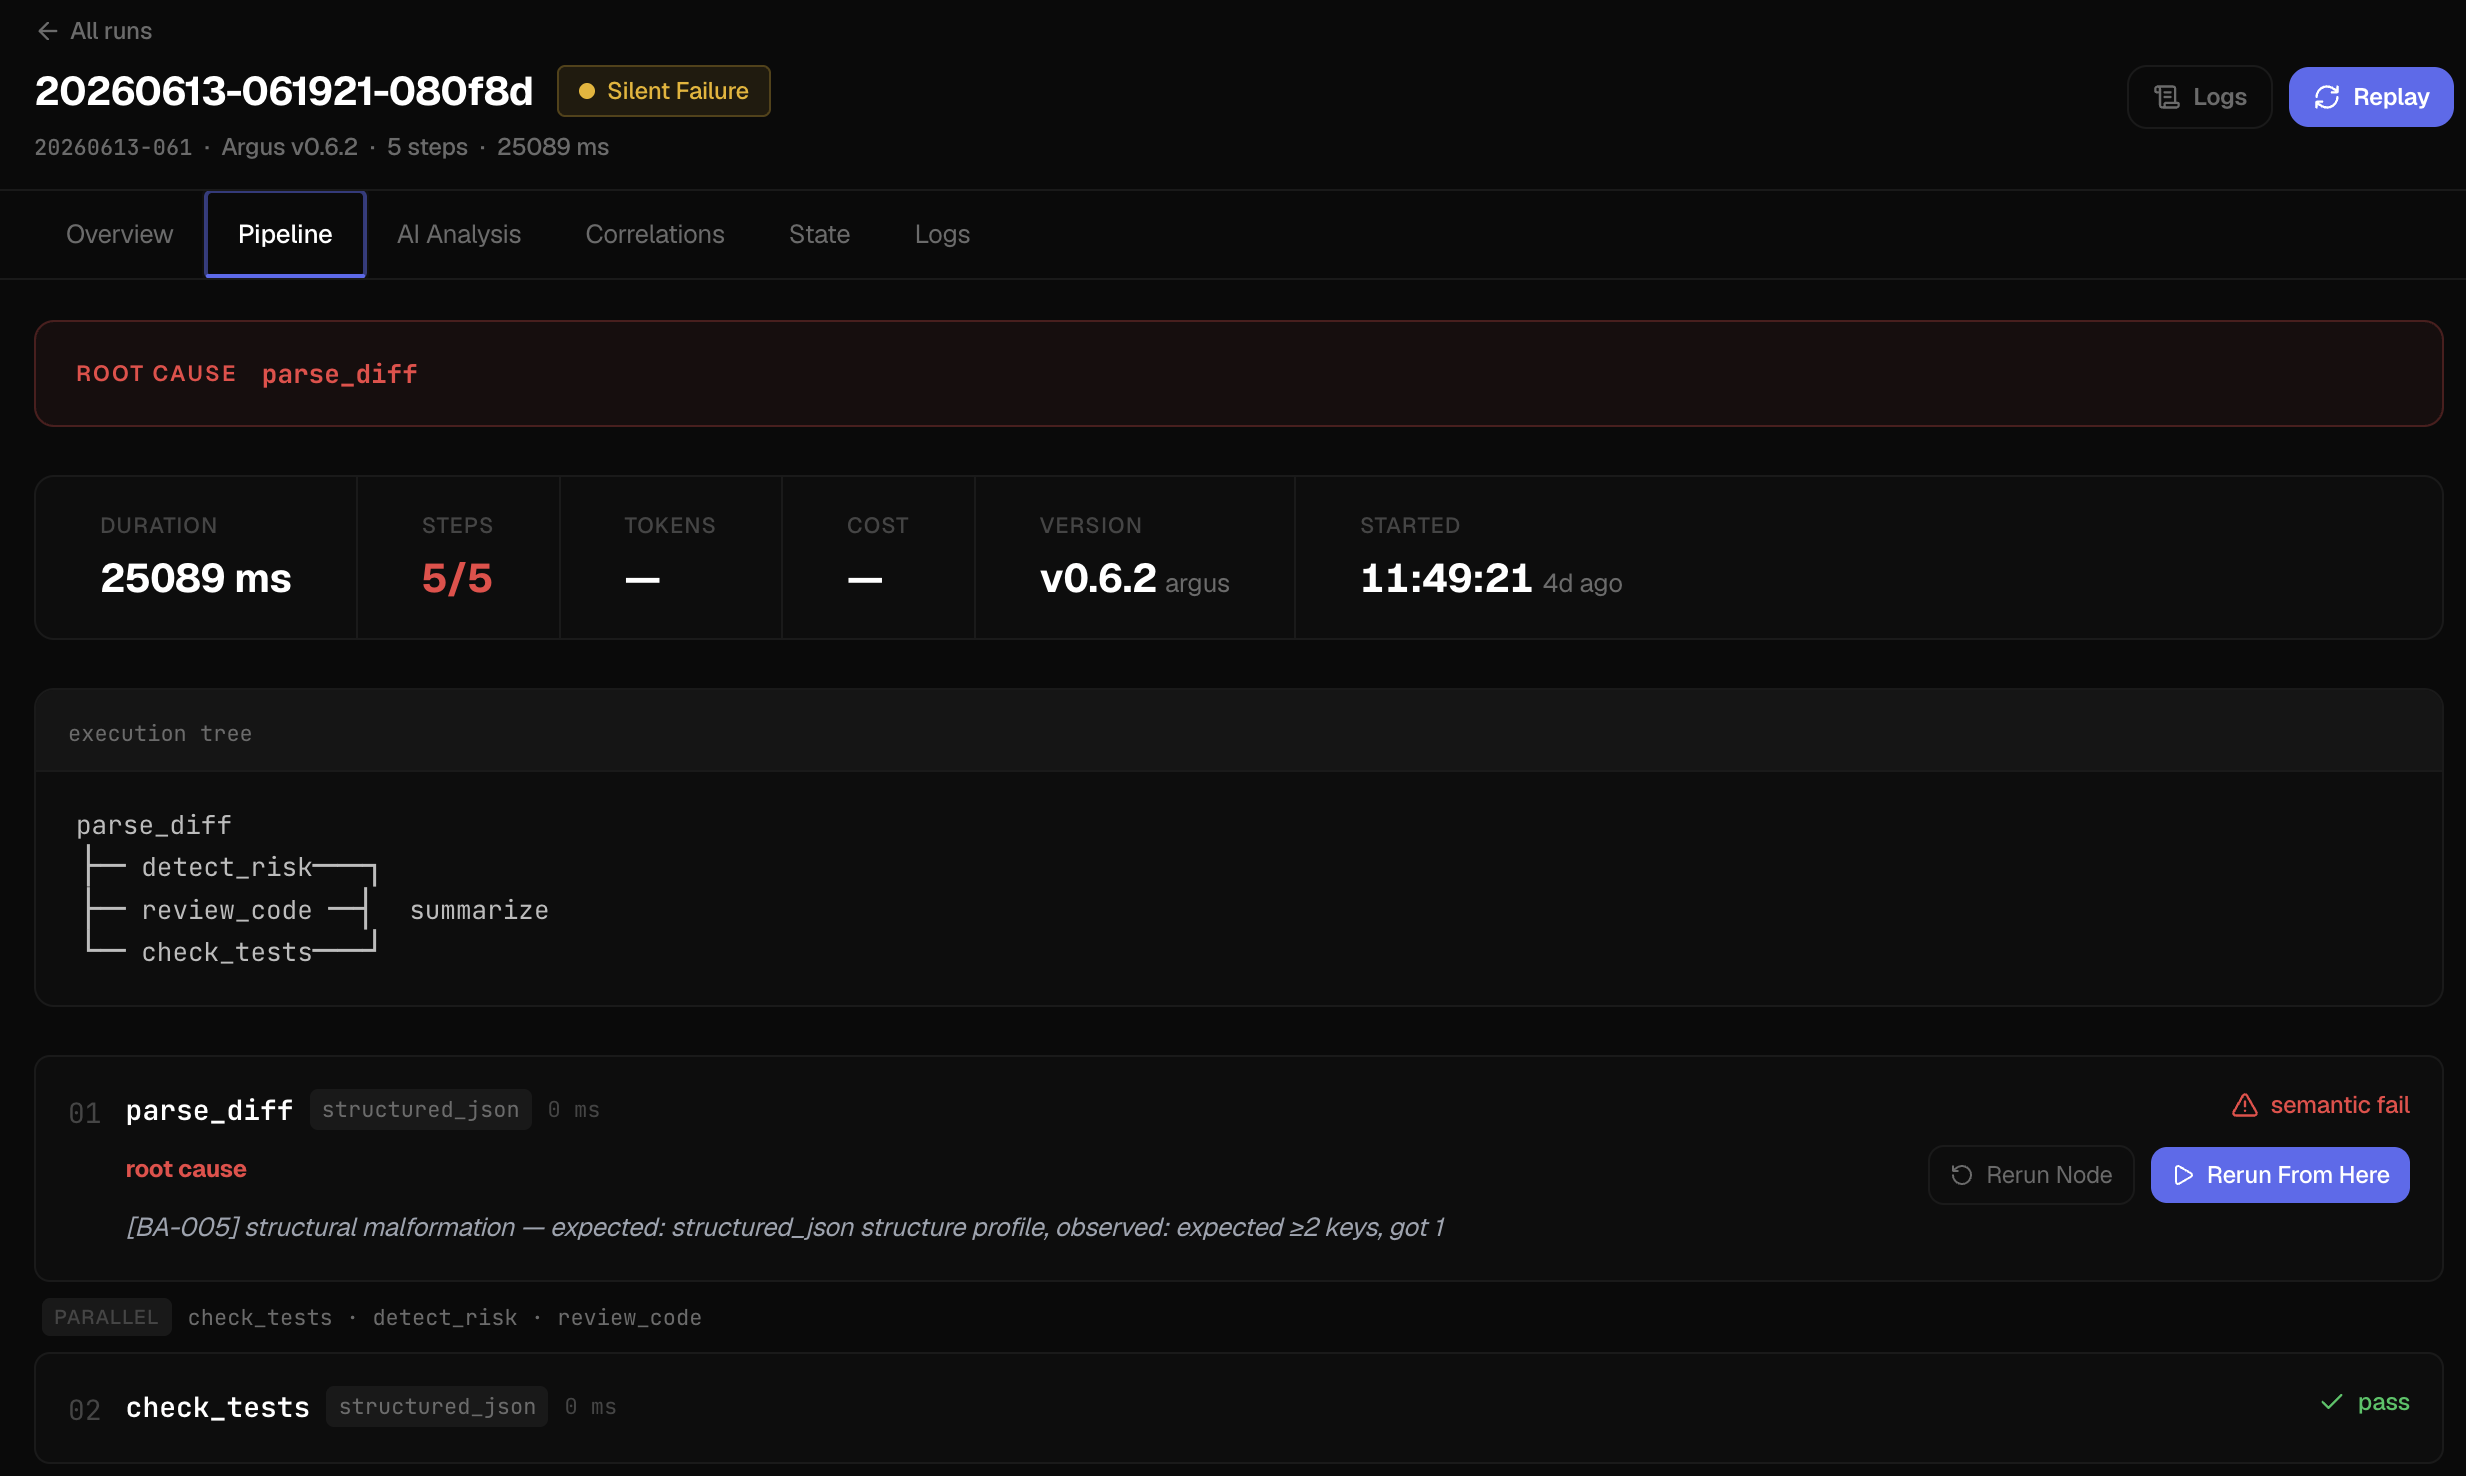 |
 |
Compare Runs
 |
 |
Approvals
Node statuses
✓ |
pass |
~ |
pass with warnings (empty optional fields) |
⚠ |
silent failure (missing required fields) |
⊗ |
semantic fail (validator returned False) |
⏸ |
interrupted (human-in-the-loop pause) |
✗ |
crashed |
Without LangGraph
from argus import ArgusSession

session = ArgusSession()
session.set_edges({"fetch": ["classify"], "classify": ["process"]})

fetch    = session.wrap("fetch",    fetch_fn)
classify = session.wrap("classify", classify_fn)
process  = session.wrap("process",  process_fn)

state = fetch(initial_state)
state = classify(state)
state = process(state)
session.finalize()
Works with Prefect, Temporal, or plain Python functions.
Requires Python 3.9+. LangGraph 0.2+ only needed for ArgusWatcher.
v0.7.0 — changelog
Project details
Verified details
These details have been verified by PyPIProject links
GitHub Statistics
Maintainers
Release history Release notifications | RSS feed


Download files
Download the file for your platform. If you're not sure which to choose, learn more about installing packages.
Source Distribution
Built Distribution
Filter files by name, interpreter, ABI, and platform.
If you're not sure about the file name format, learn more about wheel file names.
Copy a direct link to the current filters
File details
Details for the file argus_agents-0.7.1.tar.gz.
File metadata
- Download URL: argus_agents-0.7.1.tar.gz
- Upload date:
- Size: 2.8 MB
- Tags: Source
- Uploaded using Trusted Publishing? Yes
- Uploaded via: twine/6.1.0 CPython/3.13.12
File hashes
| Algorithm | Hash digest | |
|---|---|---|
| SHA256 |
4dbb582ad37f6c03d103cb92e79a5dd1574c37ad5b6883c881d70e216b6540f1
|
|
| MD5 |
2c13f3874cb493bbb1cdb70c4f22bd6f
|
|
| BLAKE2b-256 |
cc036f38fe167edc5d4a4522e791c99d1ba21672398afd54579fc9d9a4c347c9
|
Provenance
The following attestation bundles were made for argus_agents-0.7.1.tar.gz:
Publisher:
publish.yml on VaradDurge/ARGUS
-
Statement:
-
Statement type:
https://in-toto.io/Statement/v1 -
Predicate type:
https://docs.pypi.org/attestations/publish/v1 -
Subject name:
argus_agents-0.7.1.tar.gz -
Subject digest:
4dbb582ad37f6c03d103cb92e79a5dd1574c37ad5b6883c881d70e216b6540f1 - Sigstore transparency entry: 2063607913
- Sigstore integration time:
-
Permalink:
VaradDurge/ARGUS@5c819f73669b5aae3a9661769c5053eb28a7617d -
Branch / Tag:
refs/tags/v0.7.1 - Owner: https://github.com/VaradDurge
-
Access:
public
-
Token Issuer:
https://token.actions.githubusercontent.com -
Runner Environment:
github-hosted -
Publication workflow:
publish.yml@5c819f73669b5aae3a9661769c5053eb28a7617d -
Trigger Event:
release
-
Statement type:
File details
Details for the file argus_agents-0.7.1-py3-none-any.whl.
File metadata
- Download URL: argus_agents-0.7.1-py3-none-any.whl
- Upload date:
- Size: 2.8 MB
- Tags: Python 3
- Uploaded using Trusted Publishing? Yes
- Uploaded via: twine/6.1.0 CPython/3.13.12
File hashes
| Algorithm | Hash digest | |
|---|---|---|
| SHA256 |
66a20415311832b4732ac008cc139185af50e183015a4d86a5c3bdc8eba5312e
|
|
| MD5 |
49e6fa2d8cbf4a8a53750bd5d0f167ad
|
|
| BLAKE2b-256 |
ecc990d222f8f3da89e012cddc3fe4baa156b895d784dc131e3954fa5cd77655
|
Provenance
The following attestation bundles were made for argus_agents-0.7.1-py3-none-any.whl:
Publisher:
publish.yml on VaradDurge/ARGUS
-
Statement:
-
Statement type:
https://in-toto.io/Statement/v1 -
Predicate type:
https://docs.pypi.org/attestations/publish/v1 -
Subject name:
argus_agents-0.7.1-py3-none-any.whl -
Subject digest:
66a20415311832b4732ac008cc139185af50e183015a4d86a5c3bdc8eba5312e - Sigstore transparency entry: 2063607919
- Sigstore integration time:
-
Permalink:
VaradDurge/ARGUS@5c819f73669b5aae3a9661769c5053eb28a7617d -
Branch / Tag:
refs/tags/v0.7.1 - Owner: https://github.com/VaradDurge
-
Access:
public
-
Token Issuer:
https://token.actions.githubusercontent.com -
Runner Environment:
github-hosted -
Publication workflow:
publish.yml@5c819f73669b5aae3a9661769c5053eb28a7617d -
Trigger Event:
release
-
Statement type:


