

Argus
The observability console for Claude Code — local-first, permanent, and honest about cost.
Quick start · Tour · CLI · Privacy · Architecture · Contributing




Claude Code writes a detailed transcript of every session to ~/.claude/ — every turn,
every token, every tool call, every sub-agent it spawned — and then tells you almost
nothing about it. Argus tails those files into a SQLite archive on your machine, prices
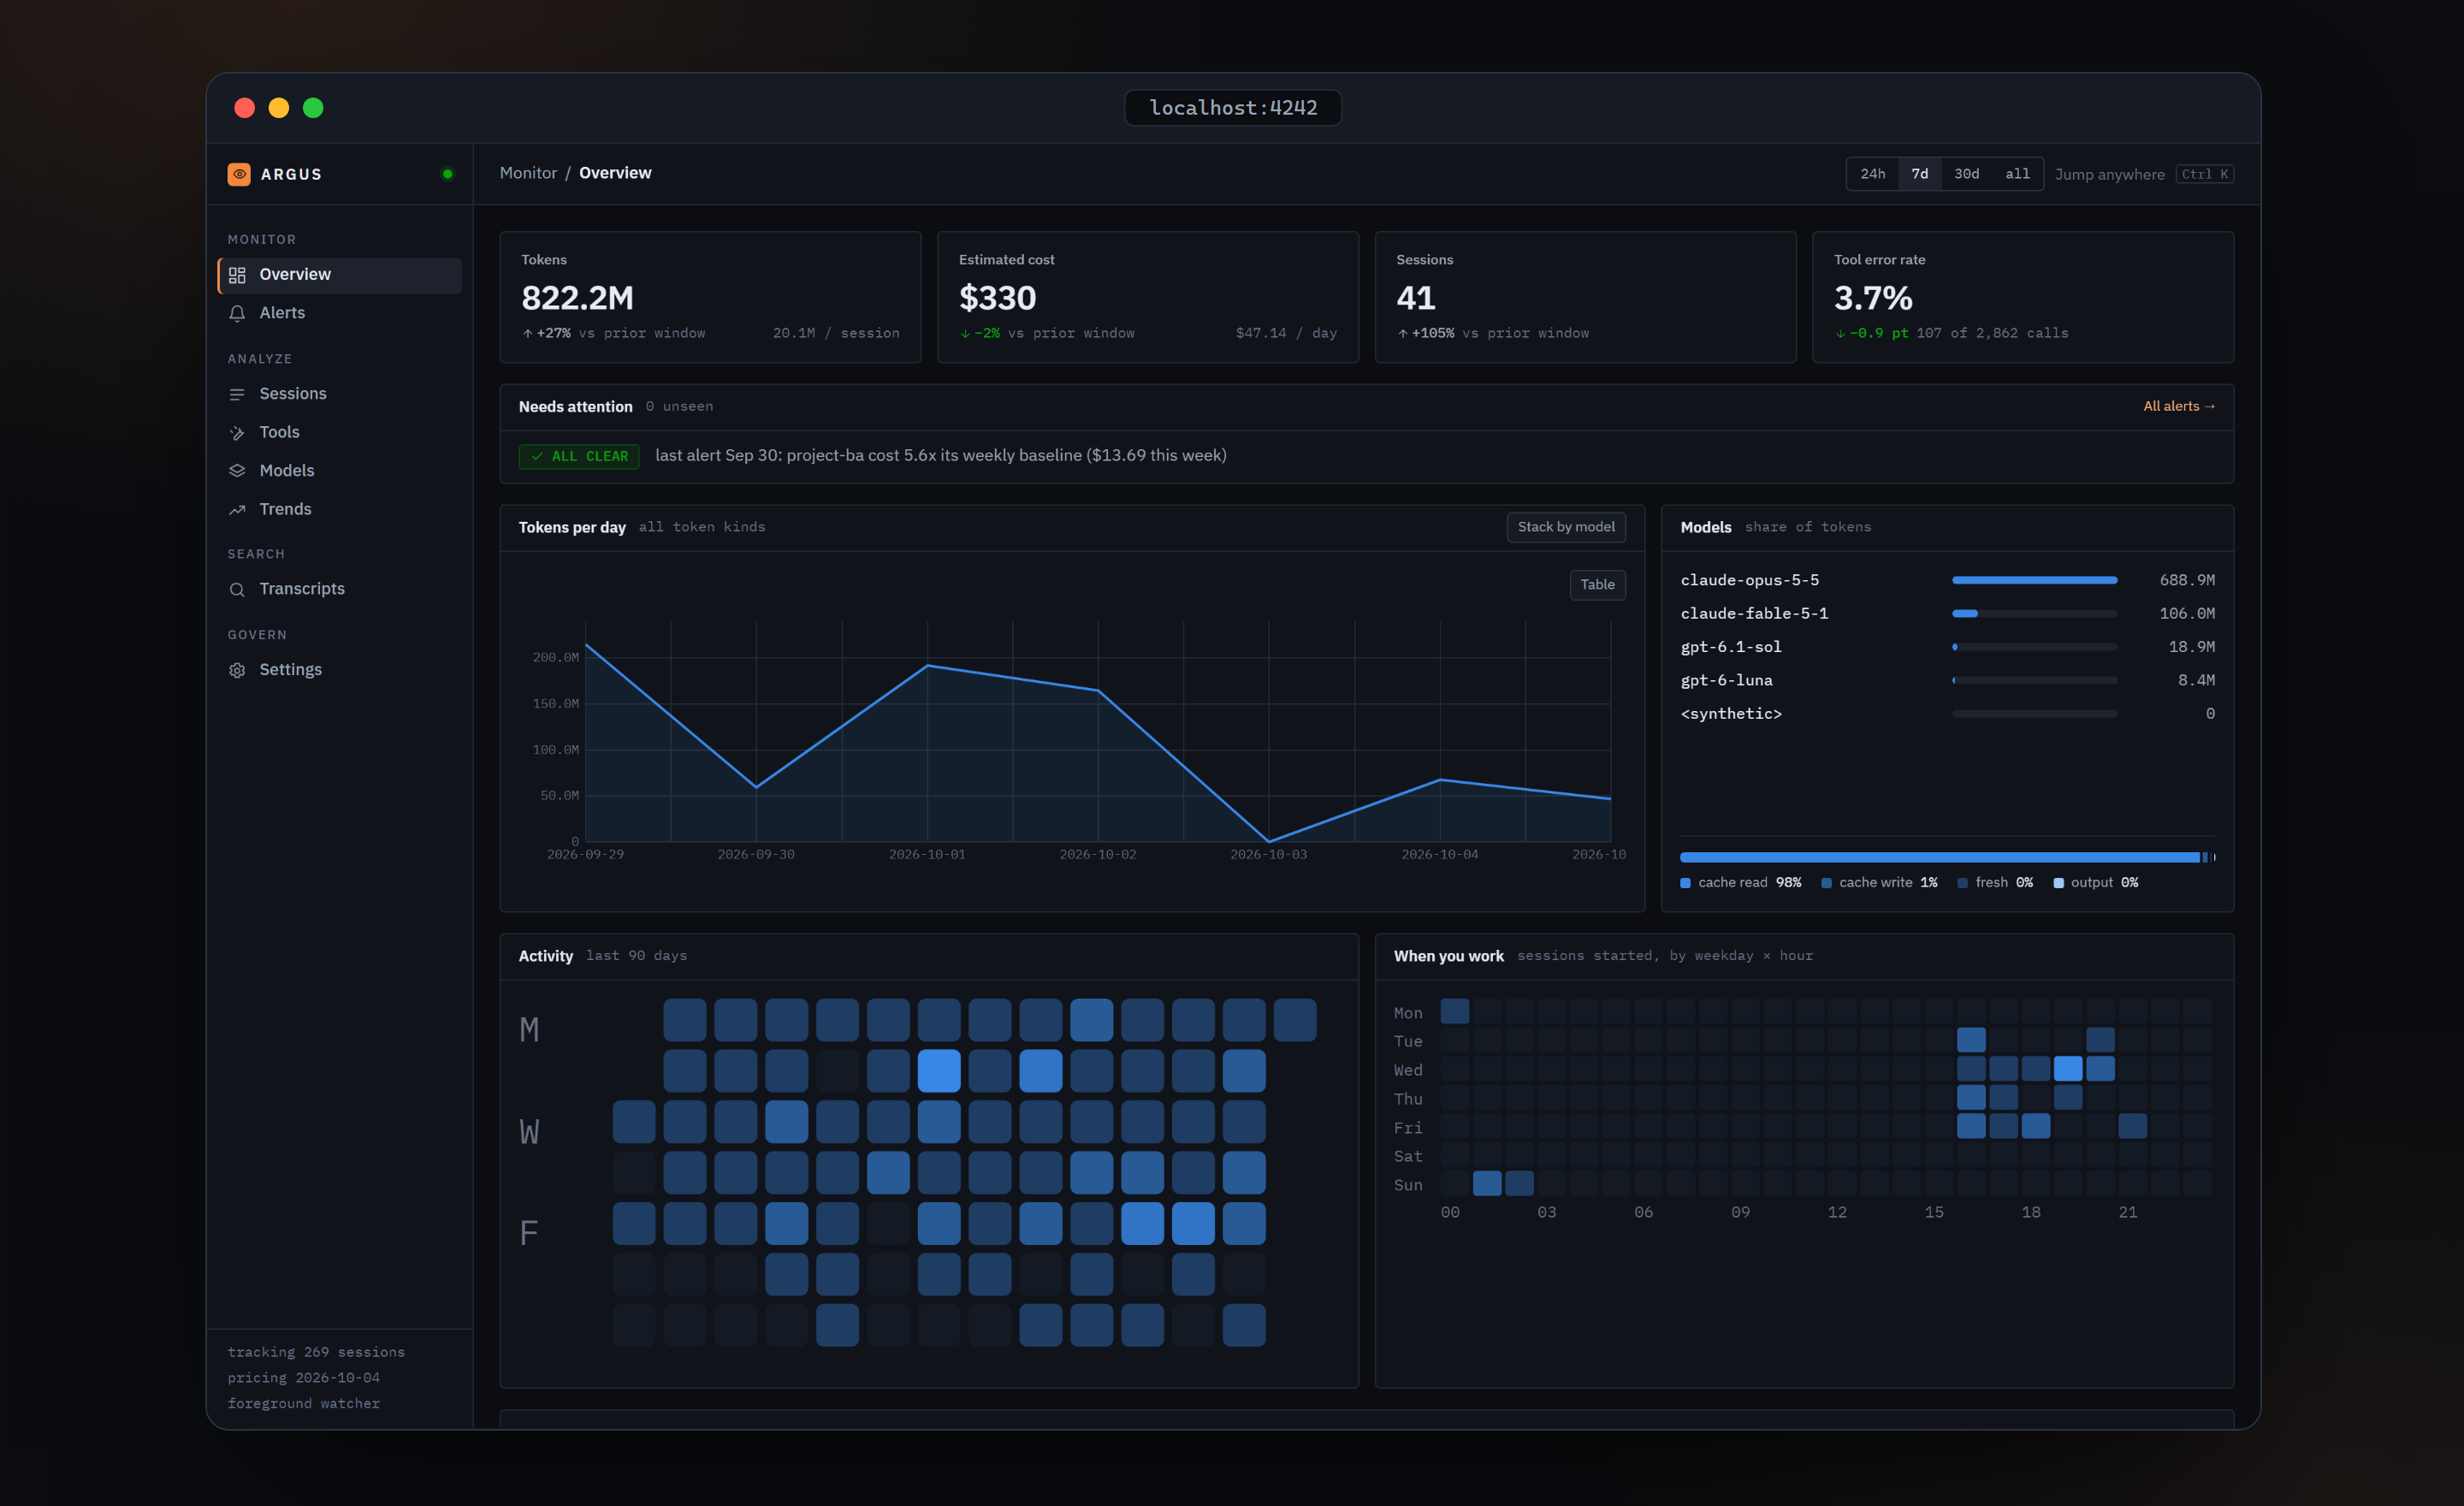
each turn, and serves a dashboard at http://localhost:4242 that answers the questions
the transcripts never do: what am I spending, where did it go, and which turn made it
so?
Nothing leaves your computer. No telemetry, no API calls, no embeddings — SQLite and a
static web app, bound to 127.0.0.1.
🚀 Quick start
pipx install argus-code     # or:  uv tool install argus-code
argus start
Your browser opens once the first pass finishes (5–10 s for a typical install). From
then on, every session you run is ingested live. All you need is Python ≥ 3.11 and a
~/.claude/ directory — i.e. you've used Claude Code at least once.
✨ Why Argus
It does forensics, not just totals. Argus keeps the structure of every session — turns, tool calls, sub-agents, cache reads — not just its sums. So you can find the turn that blew the budget, the tool that quietly started failing last Tuesday, and exactly what a sub-agent was told before it went off the rails.
It watches for you. Detectors re-check your data every 10 minutes against historical baselines and file alerts — a tool whose error rate doubles, a project whose weekly spend triples, a prompt cache that quietly stopped hitting — all flagged the day it happens, not when you happen to notice.
It accumulates. Usage tools like ccusage read what's on disk right now, and
Claude Code rotates its own logs (cleanupPeriodDays, default 30) — so "right now" is
a sliding month. Once Argus has ingested a session into ~/.argus/argus.db the row
stays forever; a few months in, Argus remembers sessions Claude has already forgotten.
🔭 A tour
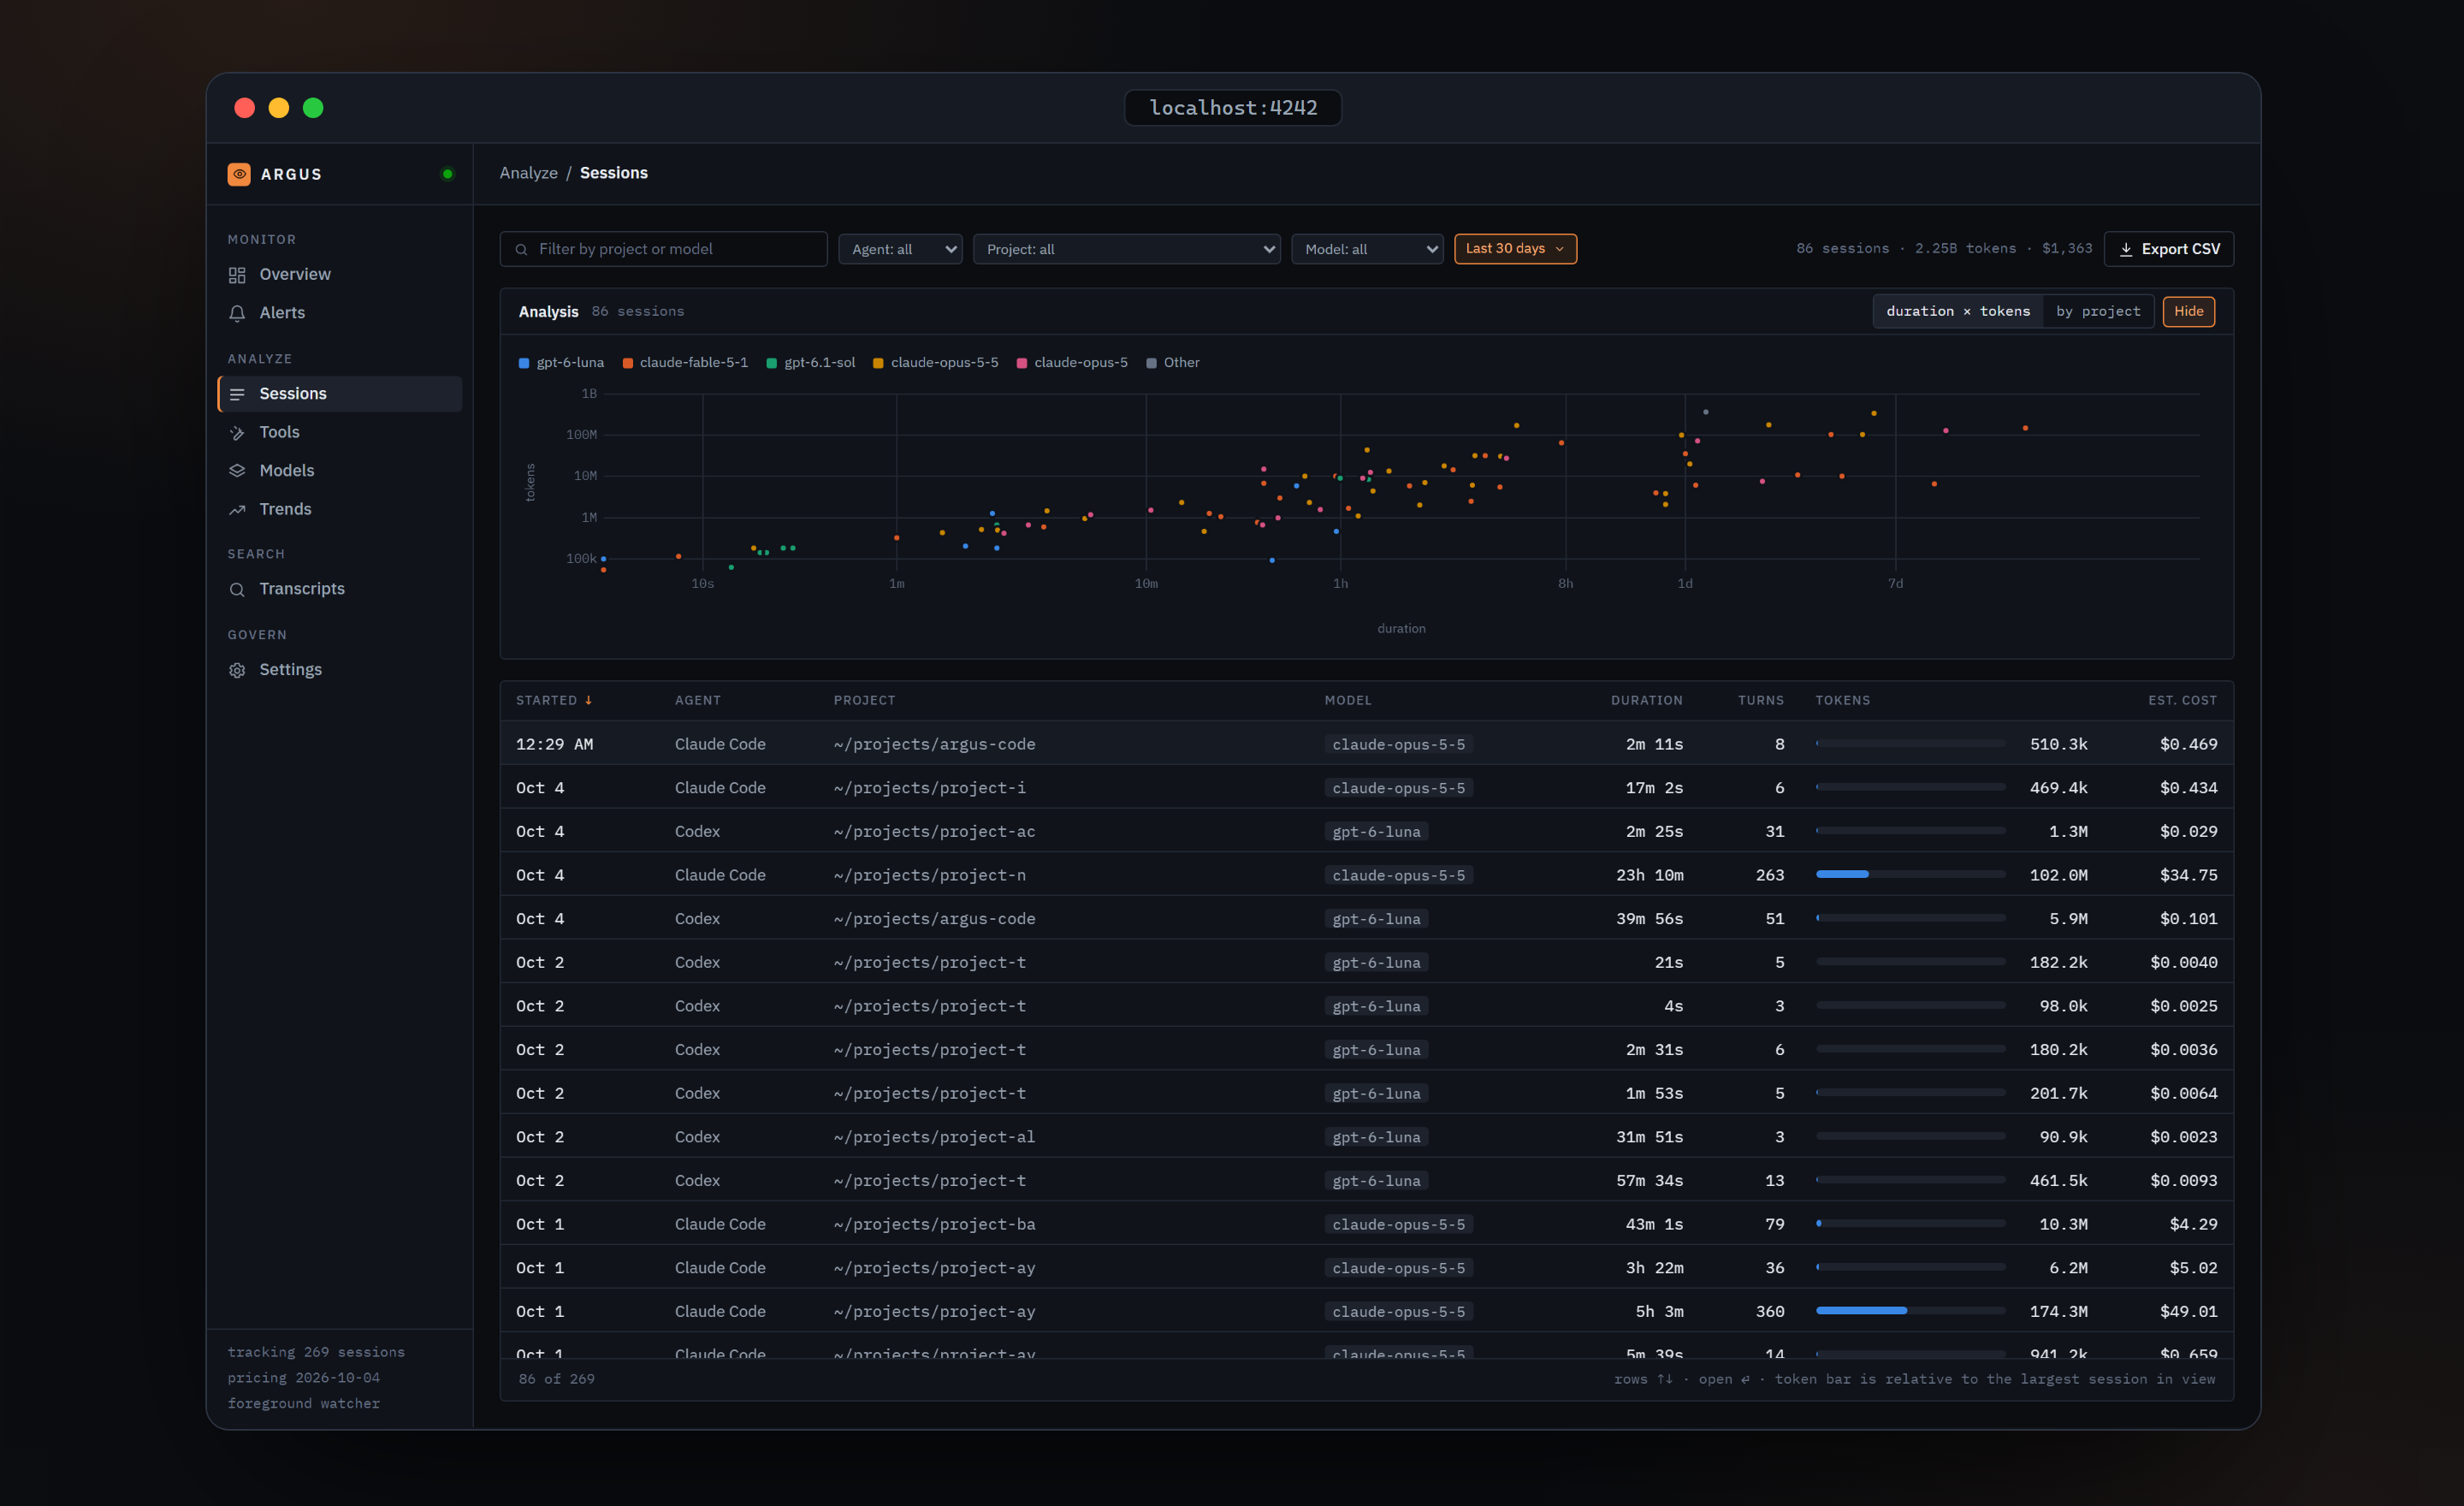
Every session, priced
A virtualised, sortable grid of every session you've ever run, with inline token bars and a duration × tokens scatter (log–log, coloured by model) that makes outliers obvious. Filter by text, project, model or time window; export to CSV.
Session forensics
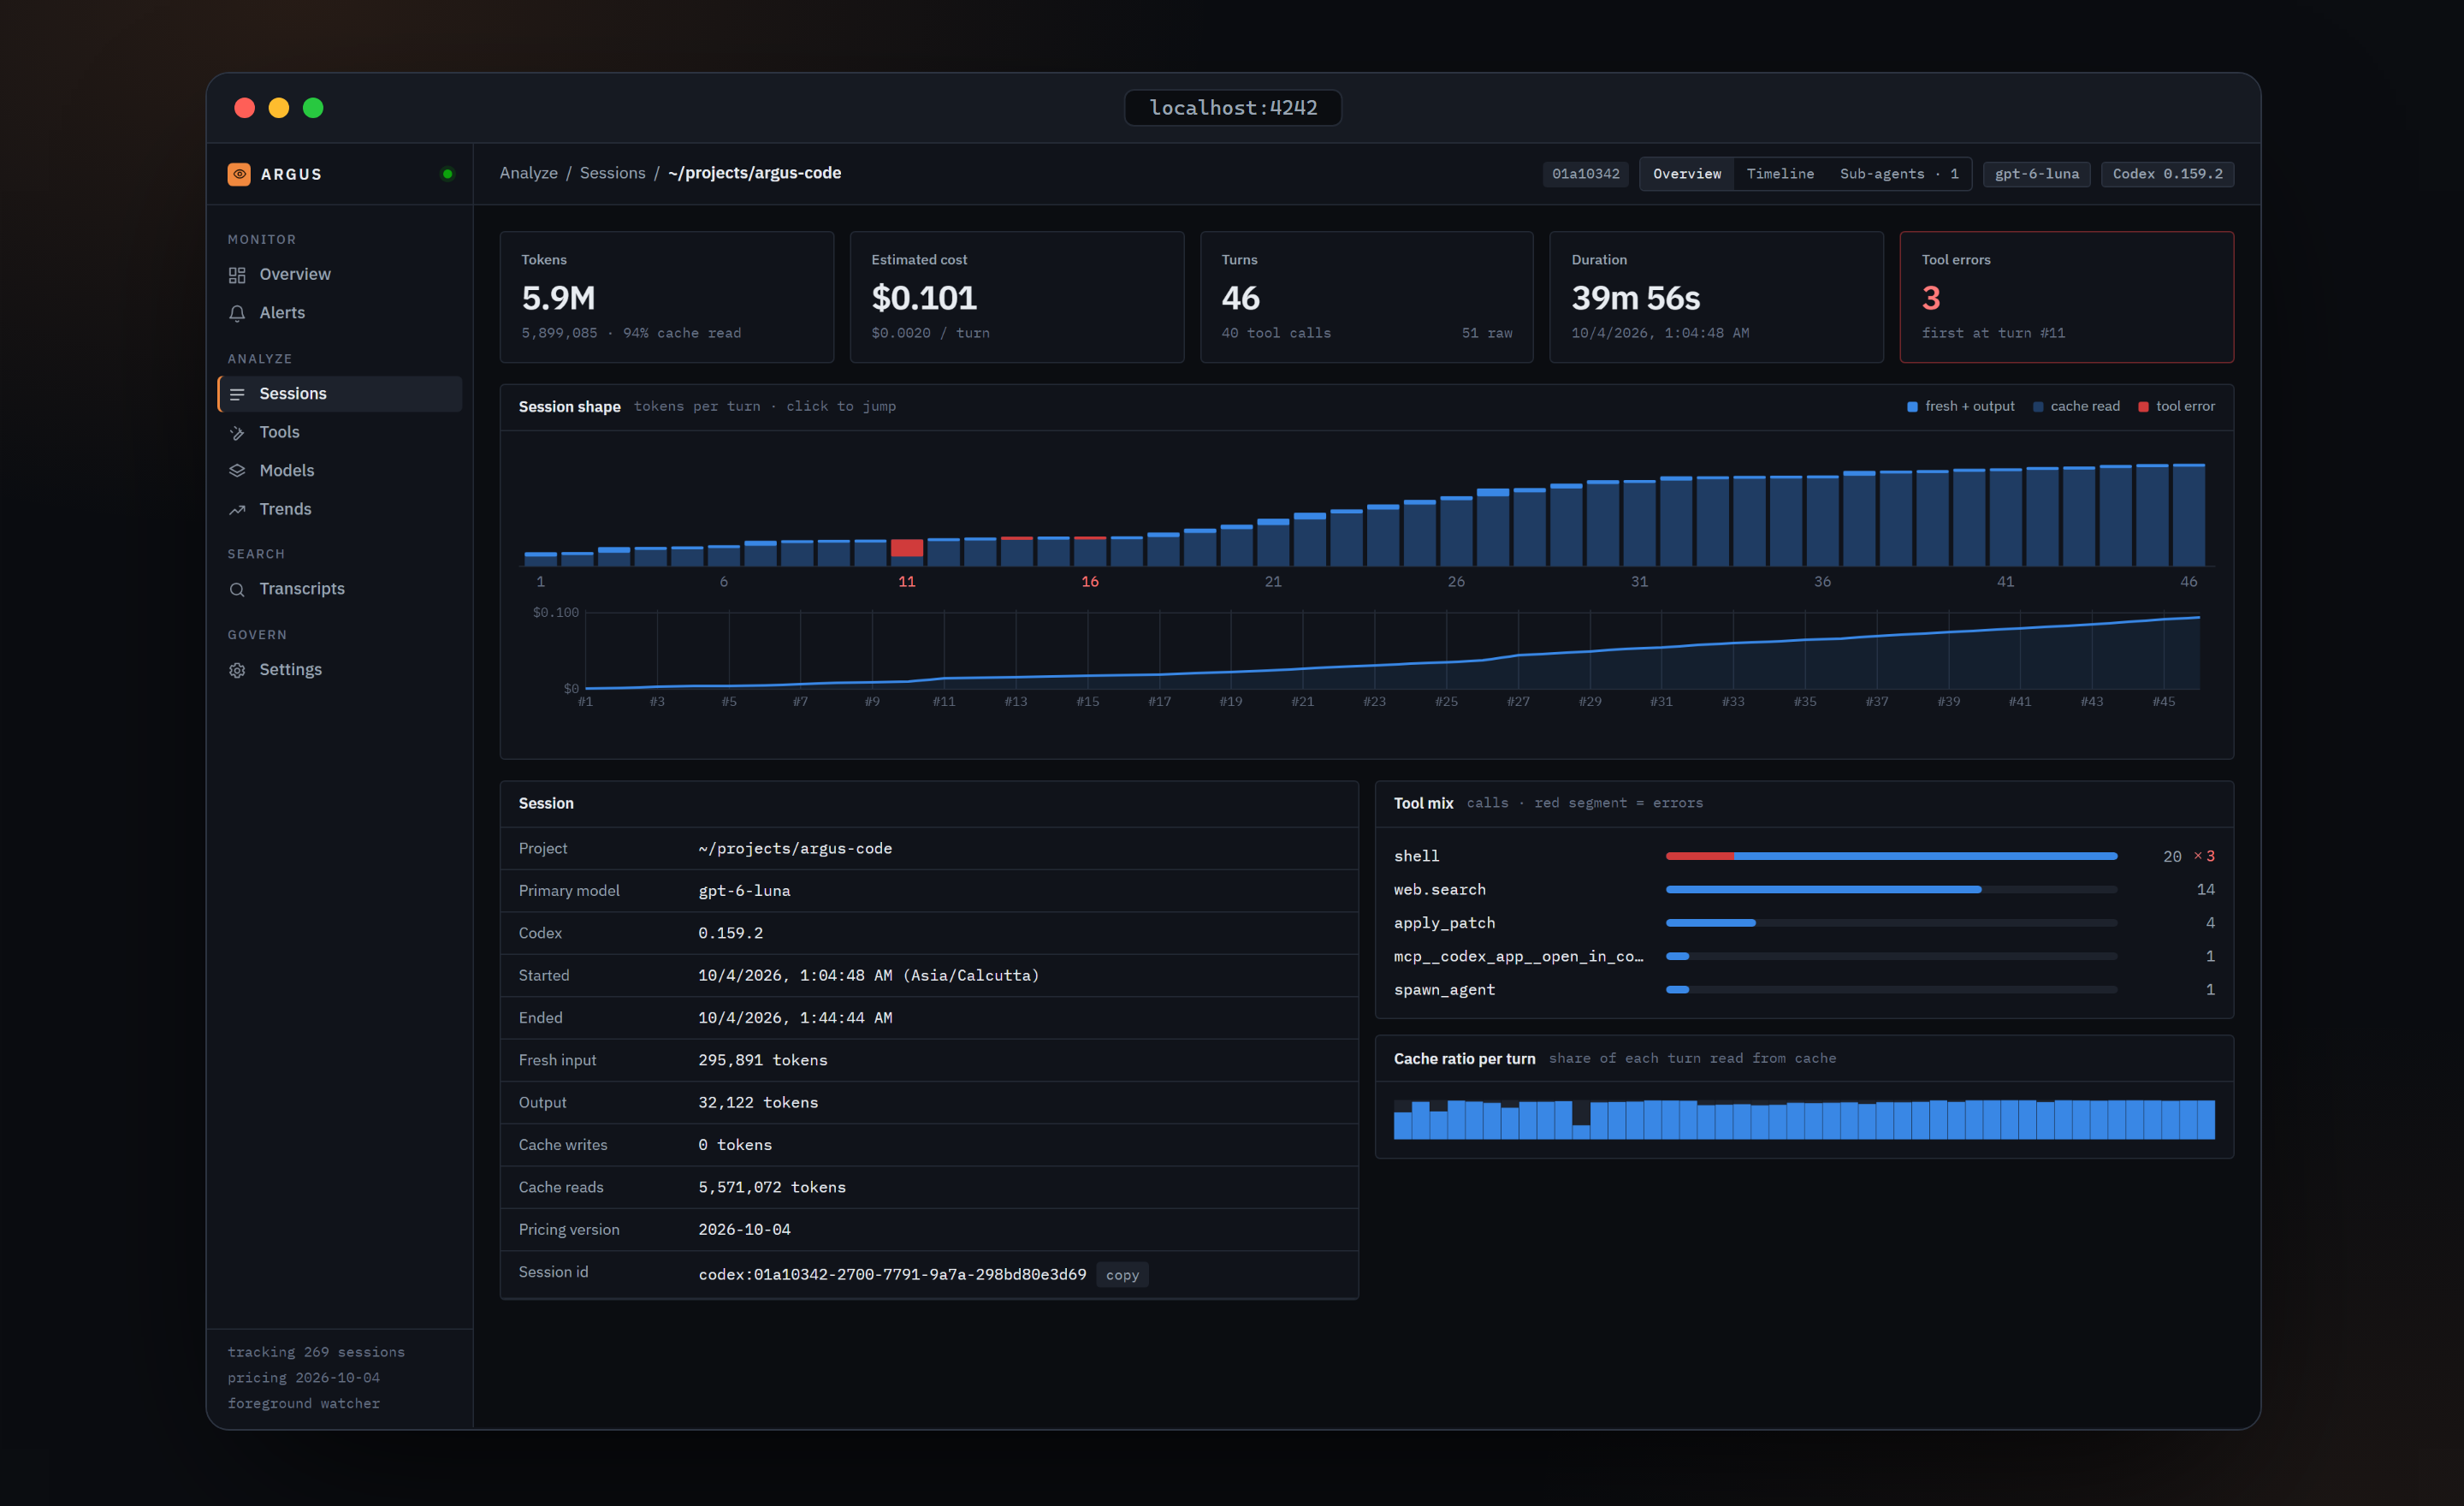
Click a session and you get its shape — one bar per turn, cache reads beneath fresh tokens, failing turns in red, click a bar to jump — plus a cumulative-cost line, a tool mix with error segments, and a timeline where every turn expands into its tool calls, sizes, status and error text inline. Resumed sessions are stitched into one chronological thread.
Sub-agent X-ray
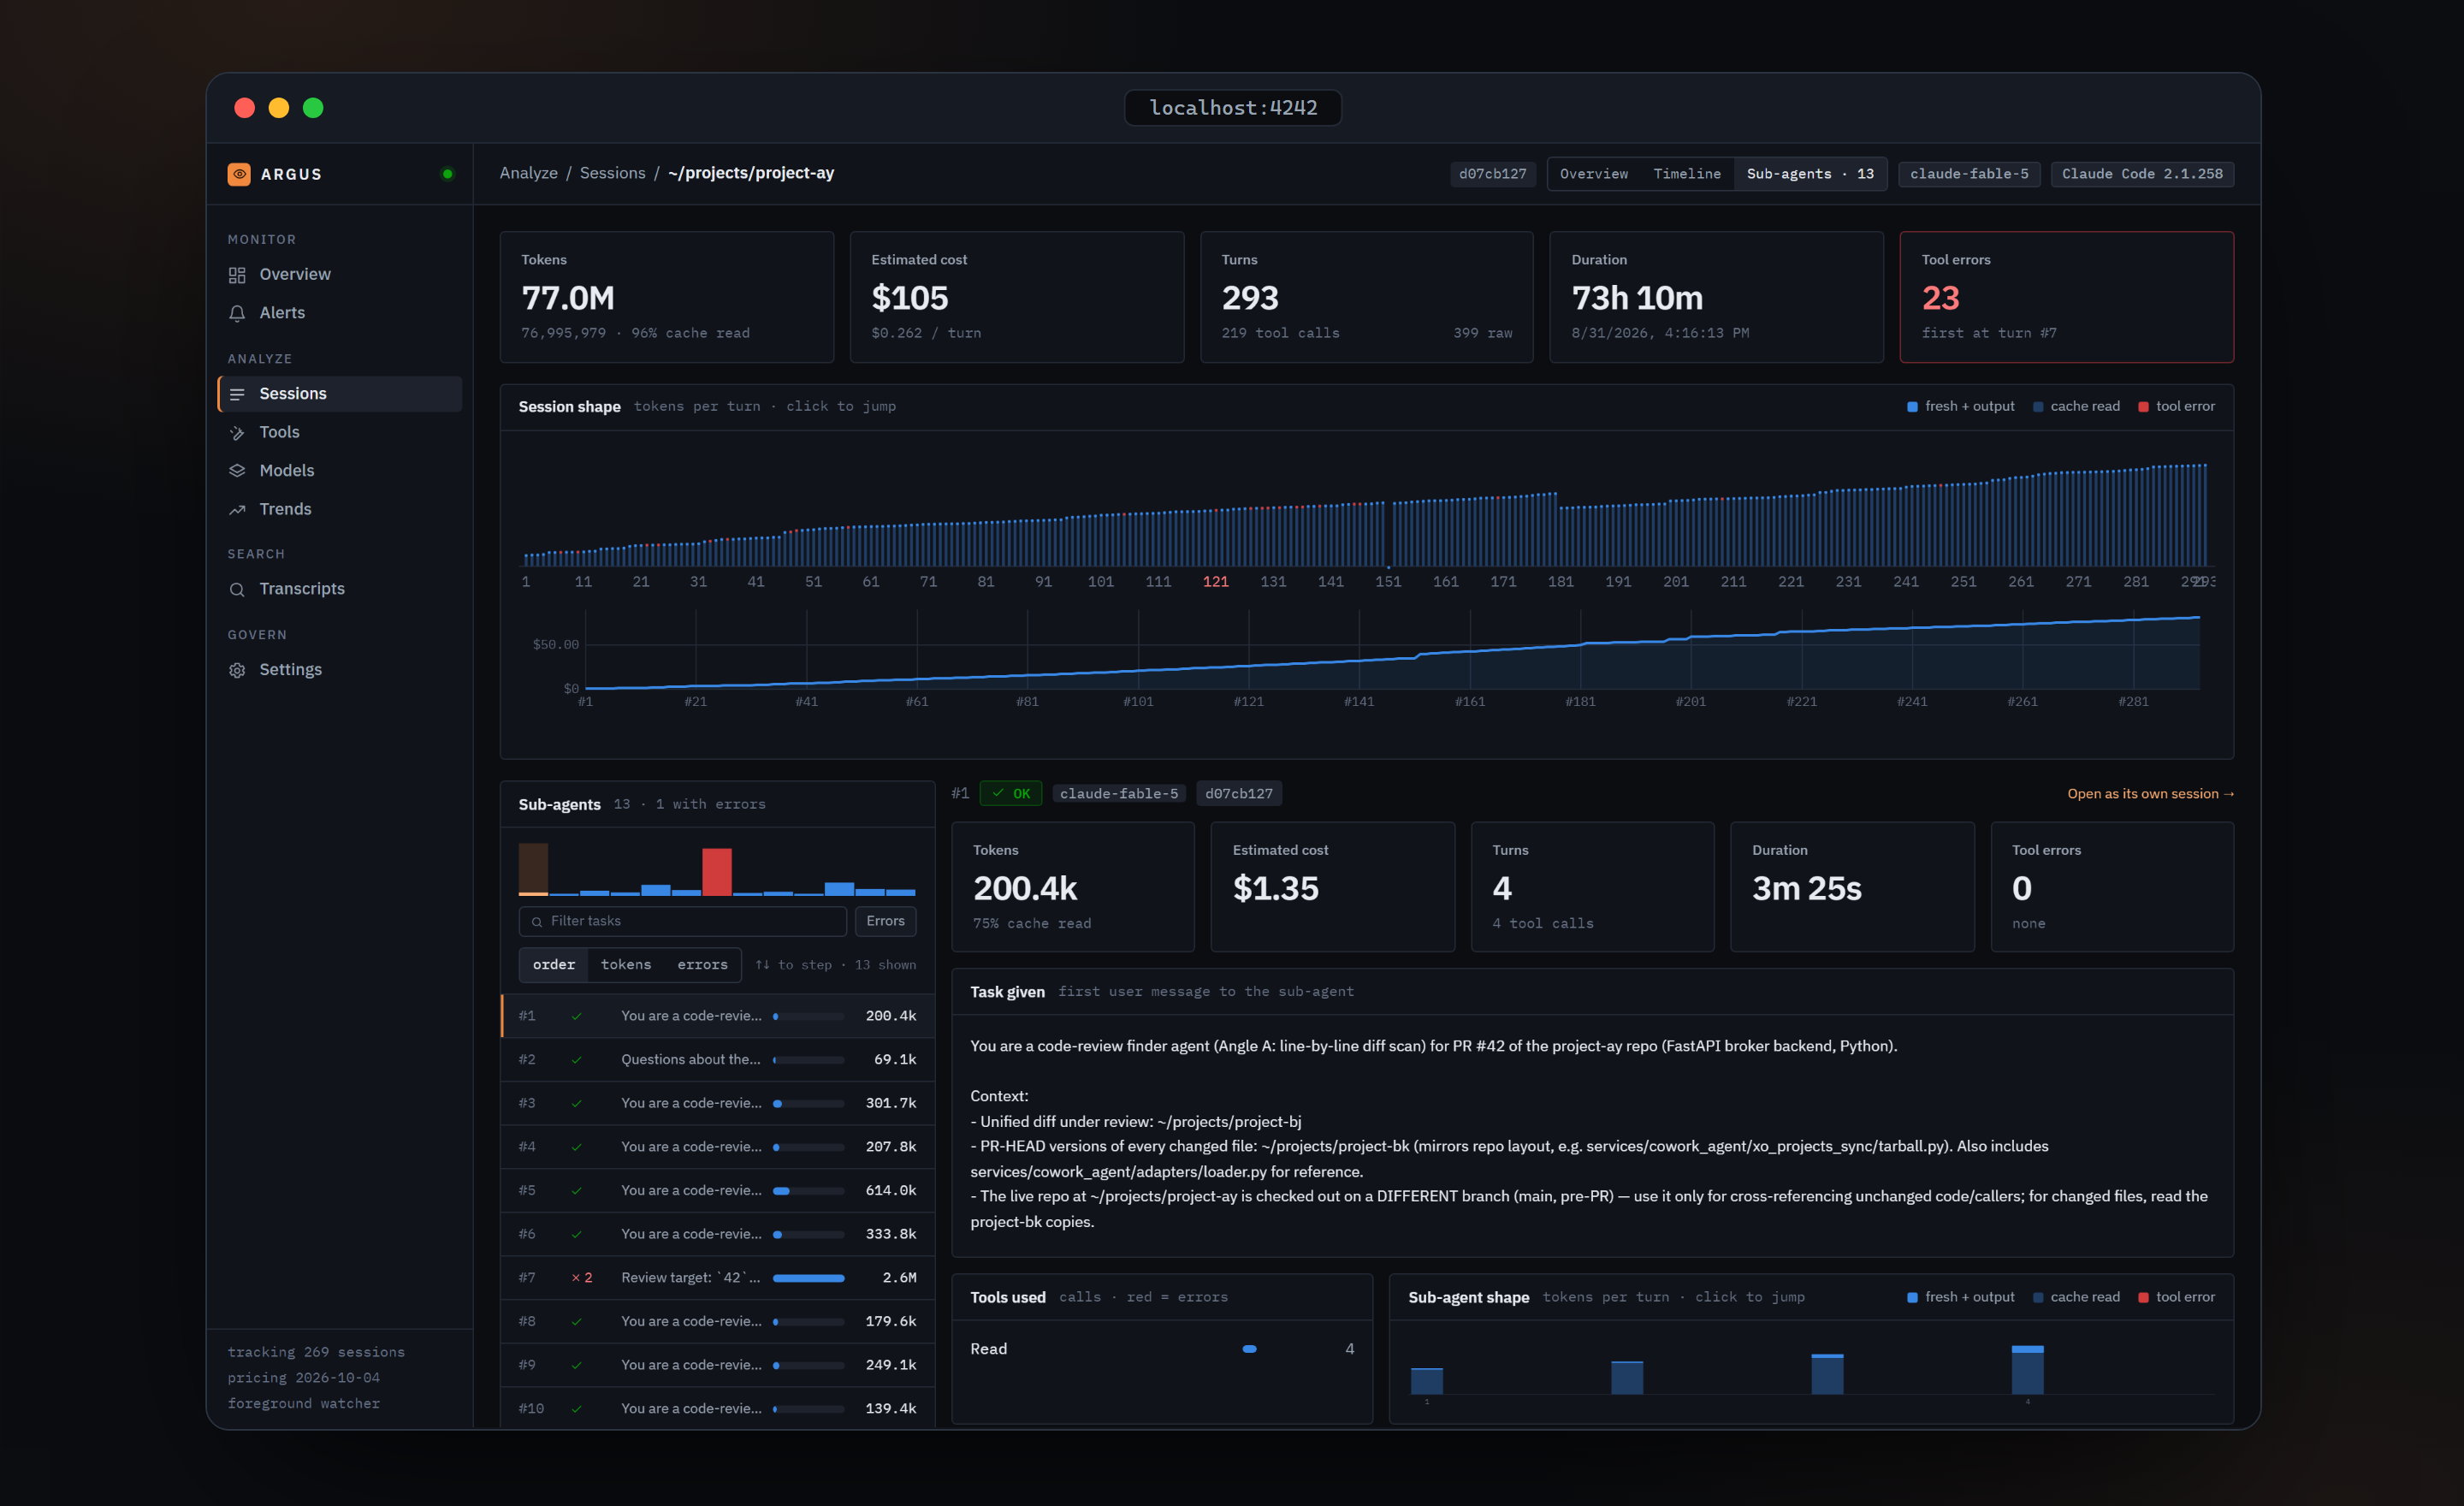
When a session delegates to sub-agents, Argus keeps each one: the task as it was
given, its tools, tokens, cost, shape and full timeline — with an at-a-glance strip
that turns red where an agent failed. No more guessing what that Task call actually
did.
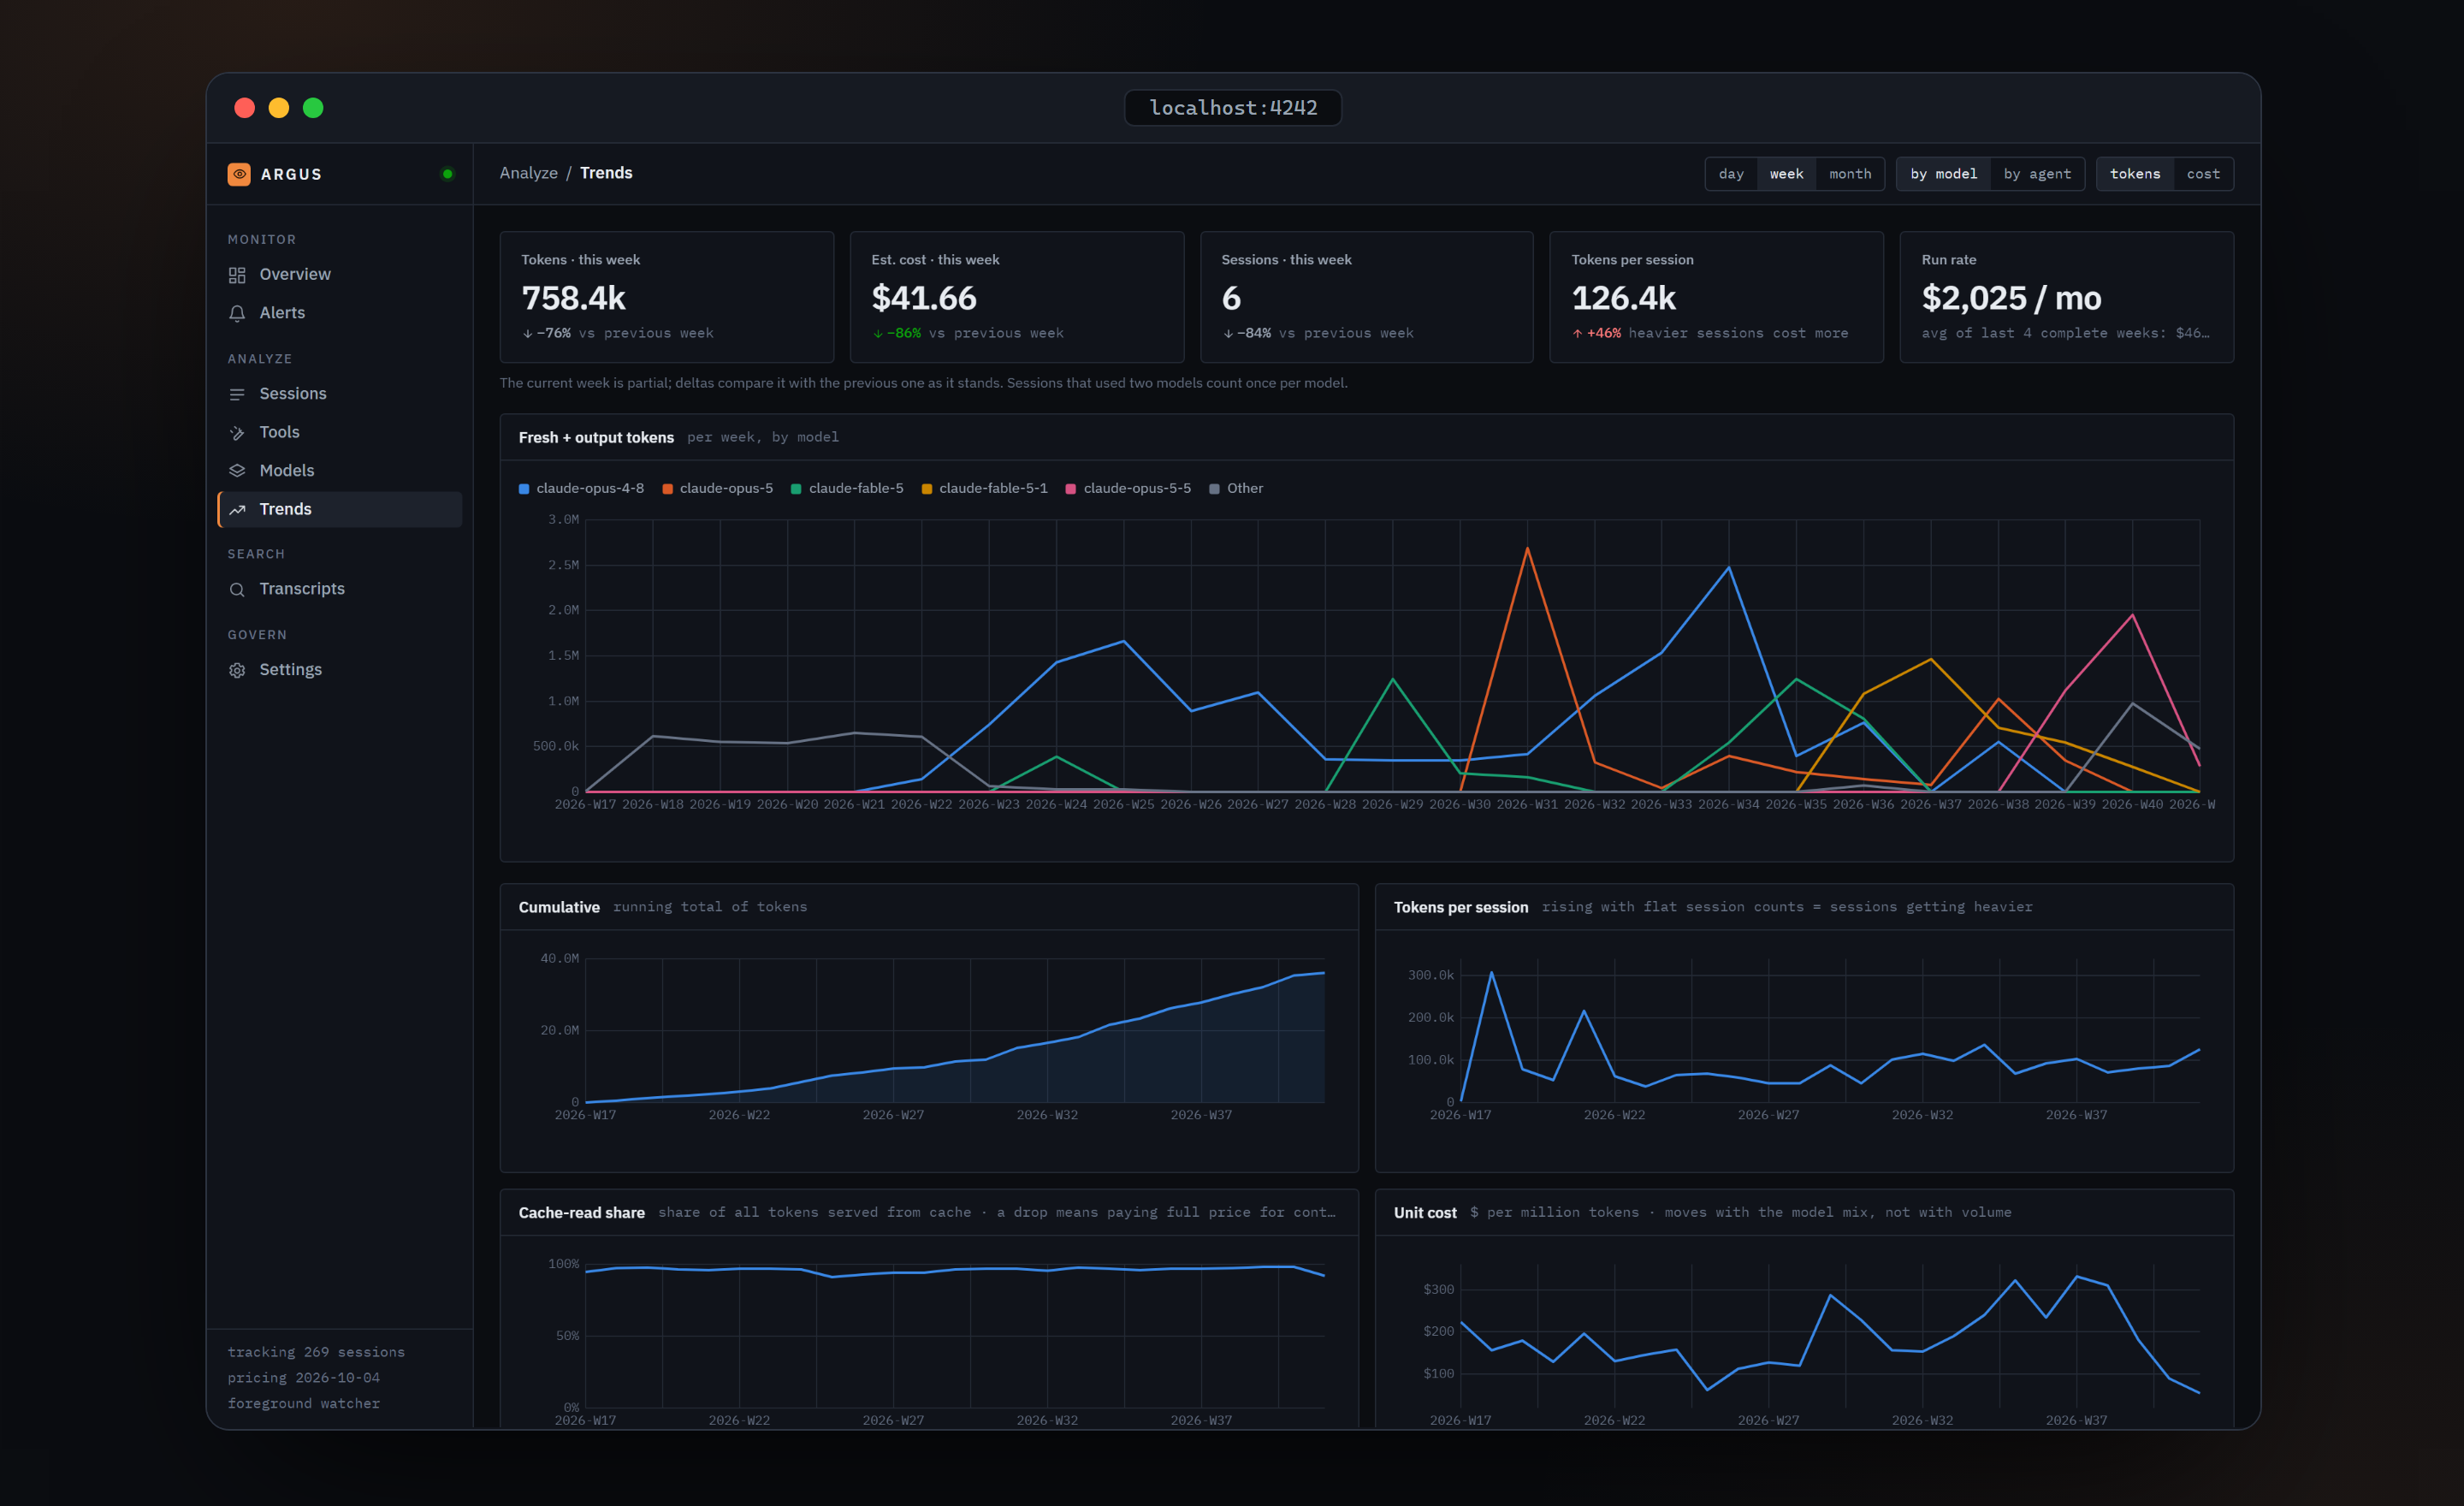
Trends that use rates, not totals
This period vs last, a monthly run-rate projection, tokens per session, cache-read share, and $ per million tokens as you actually experienced it — so you can tell "I'm working more" apart from "each session got more expensive".
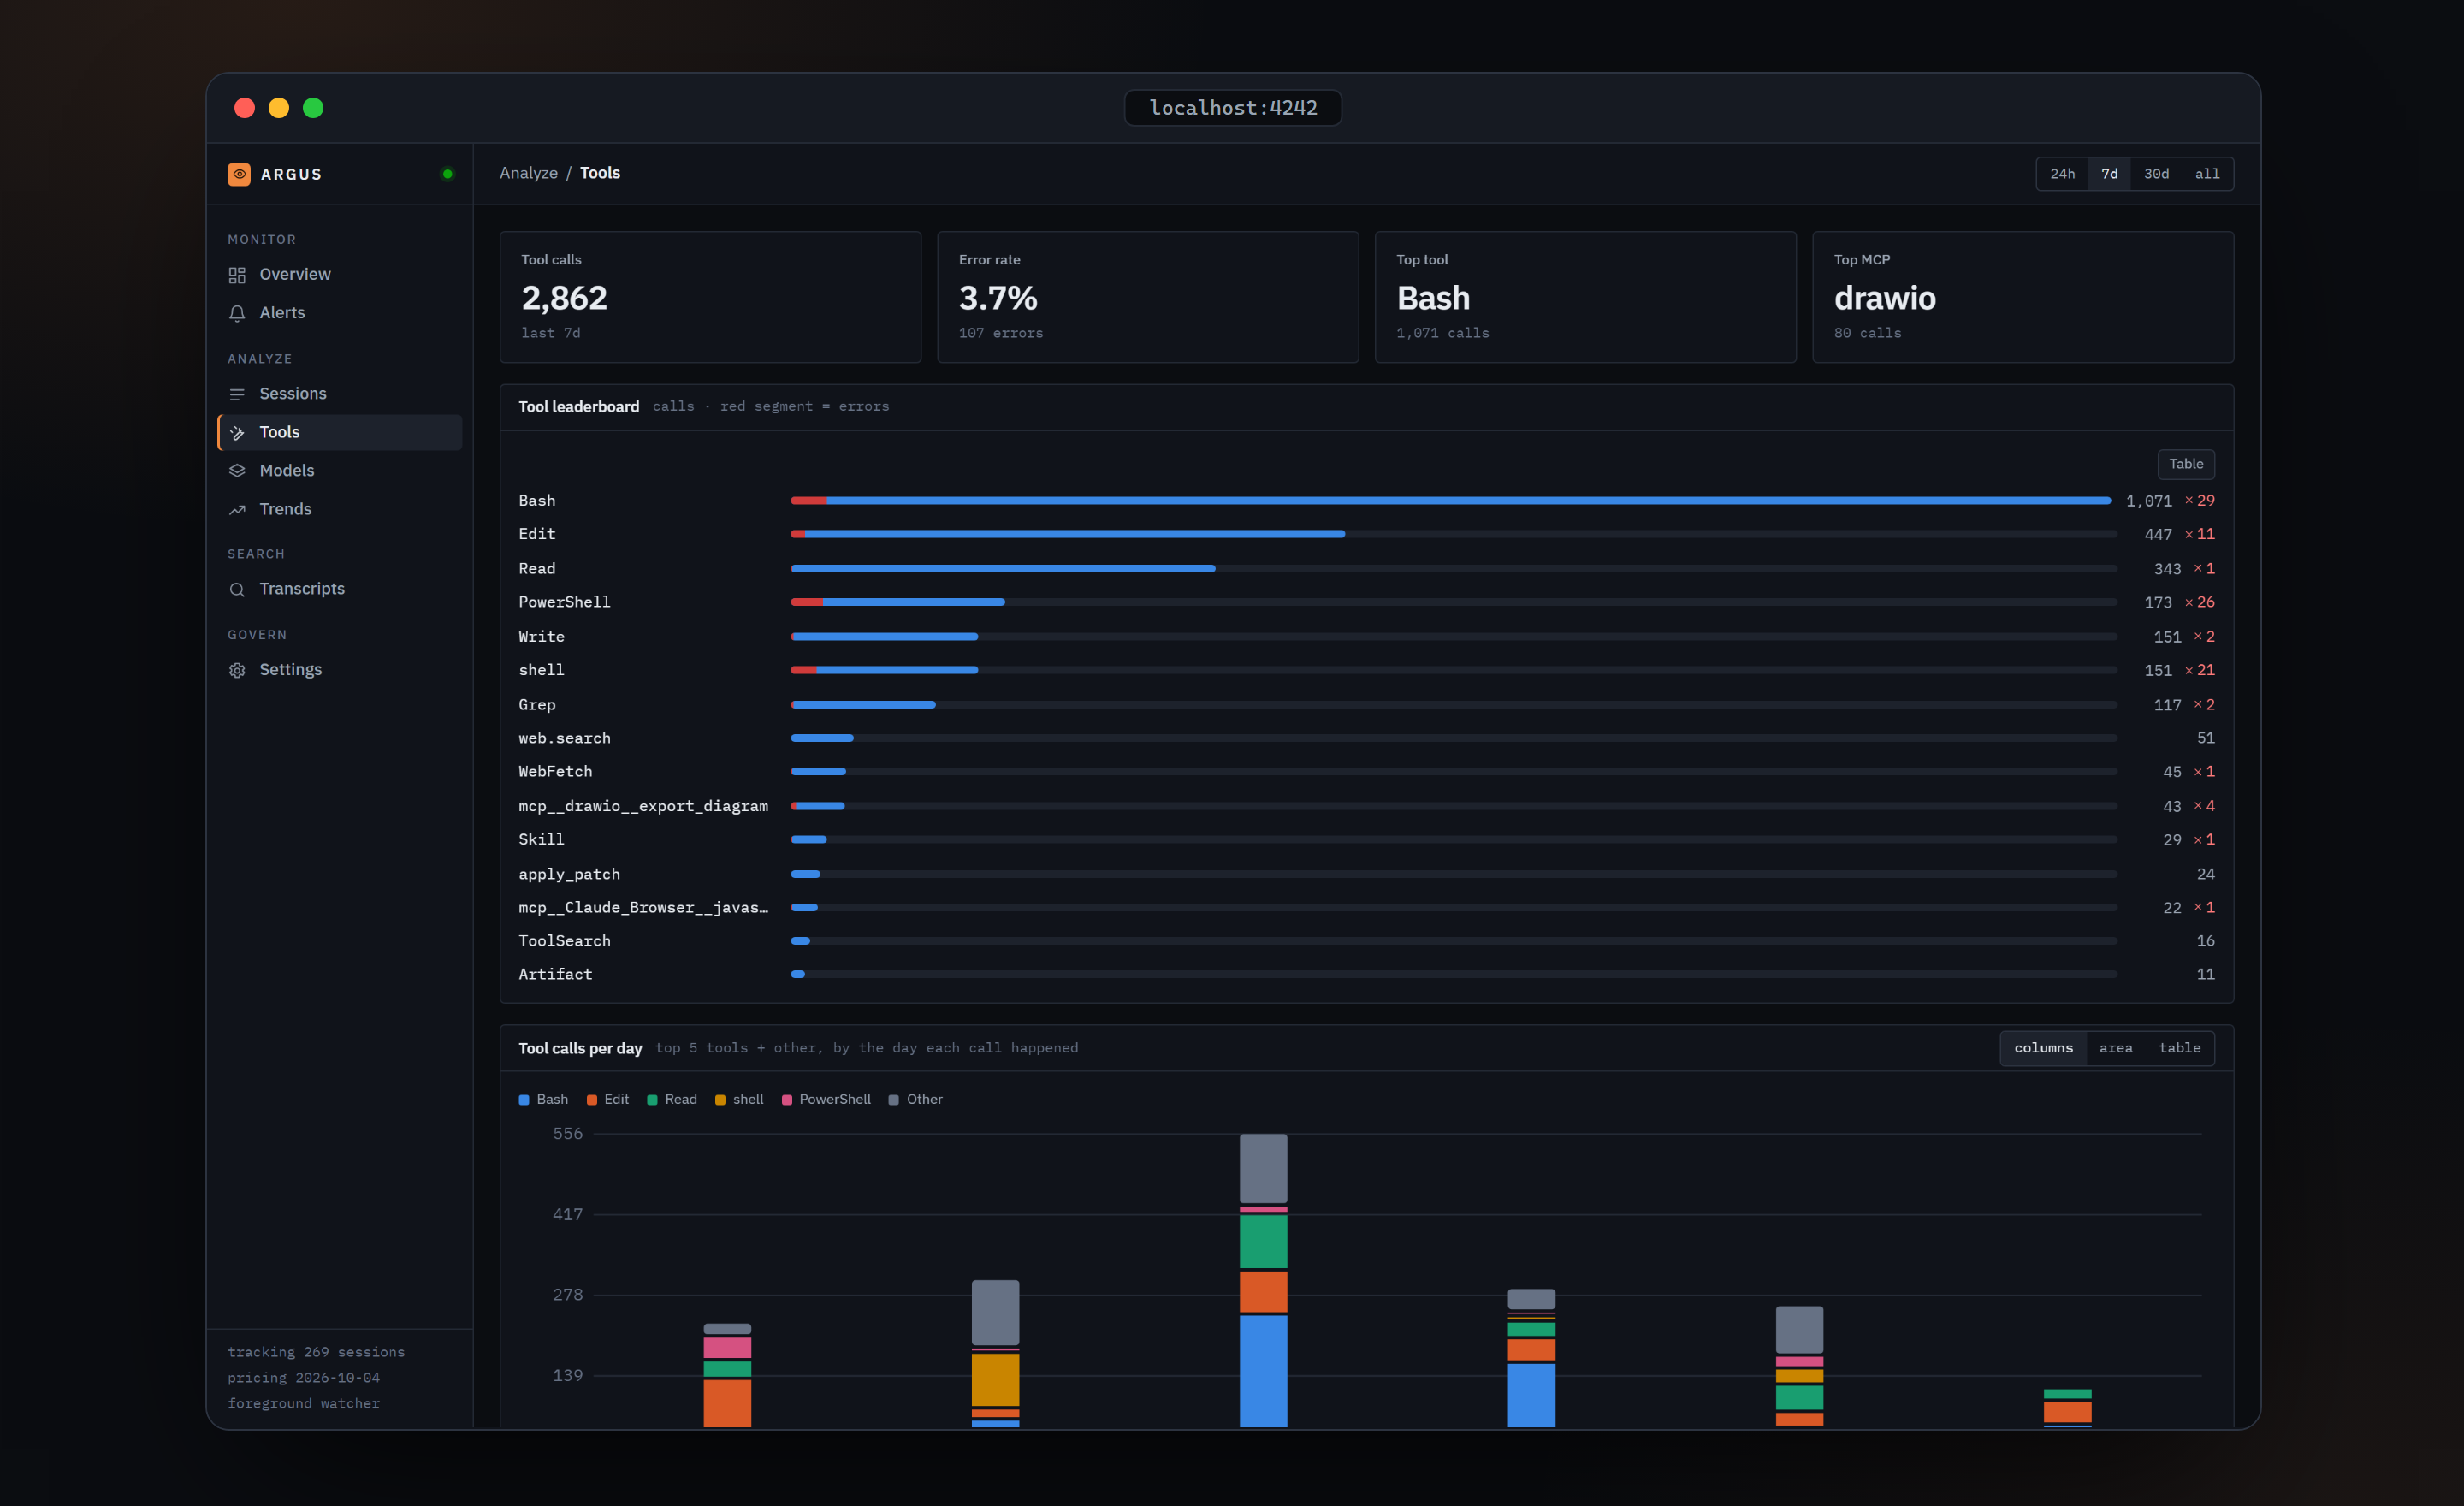
Tool health
A leaderboard of every tool with its error share, calls per day stacked by tool, MCP
servers, and sub-agent invocations by type. Three detectors re-check the last 7 days
against a 4-week baseline every 10 minutes and file an alert when a tool's failures
double (tool_error_rate_spike), when a project's weekly spend multiplies
(cost_spike), or when its prompt-cache hit rate falls off a cliff
(cache_hit_drop) — so you notice the day something breaks, not the week after.
Full-text search (opt-in)
Search every prompt you've typed and every assistant reply, thinking block and tool output. SQLite FTS5 — sub-millisecond, lexical, deterministic, offline. Off by default; see Privacy.
House rules
Every chart follows a few rules: one axis per chart, a legend whenever there's more than one series, status colours always paired with an icon and a label, and a table view behind every chart. Tokens are exact; costs are estimates, and the UI says so.
💻 CLI
argus start                 # watcher + ingester + dashboard at :4242
argus daemon start          # keep ingesting in the background (argusd)
argus indexing enable       # opt in to full-text transcript search
argus pricing refresh       # pull latest model prices from LiteLLM
argus claude init           # scaffold a good .claude/ setup into a project
argus wipe                  # delete ~/.argus/ entirely
--help works at every level.
Full command tree
argus                                   # top-level command group
├─ start [--port 4242] [--host 127.0.0.1] [--data-dir <path>]
│                                       # watcher + ingester + dashboard server
├─ pricing
│  └─ refresh                           # pull latest model prices from LiteLLM
├─ indexing                             # (was `search` — still works, hidden alias)
│  ├─ status                            # is transcript indexing on?
│  ├─ enable                            # turn it on (next start backfills)
│  ├─ disable                           # turn it off, keep data
│  └─ clear                             # wipe all indexed segments + disable
├─ claude                               # scaffold & manage .claude/ setups
│  ├─ init [path] [--template <name>] [--force]
│  │                                    # stamp CLAUDE.md + .claude/ into a project
│  └─ template
│     ├─ list                           # list templates (bundled + user)
│     └─ create <name> [--path <dir>] [--all]
│                                       # save a project's .claude/ as a template
├─ daemon                               # argusd — background ingestion + detectors
│  ├─ start                             # start argusd detached, write PID file
│  ├─ stop                              # stop argusd gracefully
│  ├─ restart                           # stop then start
│  ├─ status                            # running? PID + uptime
│  └─ logs [-n N] [-f]                  # tail ~/.argus/argusd.log
└─ wipe                                 # delete ~/.argus/ entirely
argus daemon — keep ingesting when the dashboard is closed
By default the watcher and detector scheduler run inside argus start; close it and
ingestion stops. argusd moves that work into a long-running background process. It
does not serve the dashboard — port 4242 is still only bound by argus start.
argus daemon start      # run argusd in the background (survives closing the terminal)
argus daemon status     # PID + uptime
argus daemon logs -f    # follow the log
argus daemon stop
Coexistence. When argusd is running, argus start sees its PID file and becomes a
read-only viewer of the database the daemon keeps fresh (the sidebar footer says
argusd daemon). When it isn't, argus start ingests in-process exactly as before.
Living with it. Idle cost is negligible: the watcher is event-driven and the
scheduler wakes every 10 minutes — expect ~40–70 MB RAM and no idle CPU. Logs rotate at
~1 MB × 3 in ~/.argus/argusd.log. Things to know:
- Restart after upgrading (
argus daemon restart) — a running daemon holds the old code. - No auto-restart yet. A crashed daemon stays down until you start it again; the stale PID file is cleaned up. OS-native autostart (
argus install) is a follow-up. - If argusd dies while a read-only dashboard is open, the footer keeps saying argusd and ingestion pauses until you restart the dashboard, which then resumes in-process.
- Windows
stopis a hard kill — safe (no critical in-memory state), but noargusd stopped.line lands in the log. - Toggling search: the dashboard's Enable indexing button indexes immediately; the CLI
argus indexing enableflips the flag and backfills on the nextargus start/argus daemon restart.
argus claude — scaffold good agent config
Set things up well before you run, not just observe afterwards. init copies a
template into a project: CLAUDE.md to the root, everything else into .claude/.
Existing files are skipped (--force overwrites — except CLAUDE.md, which is never
overwritten). The bundled default template ships a sensible settings.json, agents,
commands, rules and a placeholder skill. Save your own project's setup with
template create; user templates live in ~/.argus/templates/ and win over bundled
ones.
🔒 Privacy & security
Argus is built for one person on one machine, and the defaults say so.
- Binds to
127.0.0.1only. Nothing on your LAN, Wi-Fi or VPN can reach it.--host 0.0.0.0exists, and prints a loud warning. - No external requests, ever — except
argus pricing refresh, a manual command that fetches one JSON file from LiteLLM's GitHub. No telemetry, no analytics, no LLM calls. - Transcript indexing is opt-in. Cost and token analytics need no text content. Full-text search over prompts and transcripts requires an explicit opt-in (Settings or
argus indexing enable), and opting out means the API returns nothing even if data is on disk. - Cross-origin writes are rejected. State-changing endpoints check the
Originheader against Argus's own origin — exactly — so neither a random tab nor another localhost app can flip your settings. - A loopback
Hostheader is required. This defeats DNS rebinding, where a site you visit repoints its domain at127.0.0.1to read your history. Anything else gets a 421 (skipped only when you deliberately bind0.0.0.0). - Transcript text never becomes HTML. The dashboard renders every transcript-derived string as text; a test forbids raw-HTML sinks in the source.
- No embeddings, no model weights. Search is a plain inverted index.
Your data is one file, ~/.argus/argus.db. argus wipe deletes it; so does rm.
Vulnerability reports: SECURITY.md.
⚙️ How it works
- Ingest. A
watchdogobserver tails~/.claude/projects/<project>/<session>.jsonl. Lines are validated withpydantic, de-duplicated bymessage.id, and normalised into session / turn rows in SQLite (WAL mode). Resumed sessions and sub-agent files are folded into their parent. - Cost. Per-turn cost comes from a bundled price table sourced from LiteLLM. Tokens are exact; costs are estimates.
- Tools. Each
tool_useblock becomes a row; errors come from the matchingtool_result. MCP servers are parsed frommcp__<server>__<tool>; theAgenttool'ssubagent_typeis kept so delegation is visible. - Search (opt-in). Two FTS5 tables — one over your prompt history, one over transcript text — indexed incrementally during the normal ingest tick.
- Detection. A scheduler runs registered detectors every 10 minutes; findings land in an alerts inbox with a seen / resolved lifecycle, so an issue that recovers and recurs fires again instead of staying silent.
- Dashboard. A Vite + React single-page app (uPlot and hand-drawn SVG charts), statically built and served by the FastAPI app. No Node at runtime, no network beyond
/api/*.
Want the deeper tour? ARCHITECTURE.md.
🔧 Configuration
| Where | Knob |
|---|---|
argus start --port <n> |
Port (default 4242). |
argus start --host <h> |
Bind host (default 127.0.0.1; 0.0.0.0 for LAN exposure). |
argus start --data-dir <path> |
Override ~/.argus/. |
argus pricing refresh |
Fetch the latest price table into ~/.argus/pricing/ (newest table wins). |
Keep more history in Claude Code itself
Claude Code deletes session files after 30 days by default. Raise it in
~/.claude/settings.json (minimum 1; it can't be disabled):
{ "cleanupPeriodDays": 365 }
Argus keeps its own copy regardless — this only widens what Claude itself retains.
📋 Requirements
- Python ≥ 3.11 with an FTS5-enabled
sqlite3(the standard CPython builds for macOS, Linux and Windows all are; Argus checks at startup and says so clearly if not). - A
~/.claude/directory with real session JSONL — i.e. you've used Claude Code at least once.
🛠️ Development
git clone https://github.com/KrishBhimani/argus-code.git
cd argus-code
uv sync               # install deps + create venv
uv run pytest         # ~490 tests, ~35 s
uv run argus start    # runs directly from source
Dashboard work happens in dashboard/ (Vite + React): npm install && npm run dev
proxies /api to a running argus start; npm test, npm run build, npm run size
and npm run e2e are the gates. The built copy in dashboard-dist/ ships inside the
wheel, so end users never touch npm. See CONTRIBUTING.md.
Repository layout
python/argus/         Python ingest, store, server, CLI
  adapters/           Claude Code JSONL parsers + adapter registry
  store/              SQLite schema + migrations + repo
  server/             FastAPI app + /api routes
  collector/          watcher + pipeline + first-run + search backfill + alert scheduler
  core/               CoreRuntime — shared watcher+scheduler+ingest lifecycle
  daemon/             argusd: pidfile, foreground service, process control, logging
  detectors/          alert detectors (pure reads) + @register registry
  scaffold/           `argus claude` template storage / init / snapshot
  pricing/            LiteLLM-derived price table + cost compute
  schema/             pydantic data models
dashboard/            React SPA source (Vite)
dashboard-dist/       Vite build output (shipped in wheel as data)
pricing/              Bundled pricing JSON (shipped in wheel as data)
templates/            Bundled .claude/ scaffolding templates (shipped in wheel as data)
tests/                pytest suite, mirrors python/argus/ layout
MIT — see LICENSE.
Named for Argus Panoptes — the watchman with a hundred eyes, who never slept.
If it keeps good watch for you, a ⭐ helps other Claude Code users find it.
1 maintainer

Metadata
1 maintainer
Release files for argus-code 0.6.0
For a detailed explanation of source distributions (sdists) and built distributions (wheels), please see the package formats documentation.
Source distribution (sdist)
| File | Size | Uploaded | |
|---|---|---|---|
| argus_code-0.6.0.tar.gz | 6.1 MB | Details |
Built distribution (wheel)
| File | Interpreter | ABI | Platform | Reset |
|---|---|---|---|---|
| argus_code-0.6.0-py3-none-any.whl | Python 3 | none | any | Details |
Total release size: 6.6 MB
Release files / argus_code-0.6.0.tar.gz
| Download URL | argus_code-0.6.0.tar.gz |
|---|---|
| Size | 6.1 MB |
| Tags | Source |
|
SHA-256 checksum How to use checksums |
d42dca5608e880e23d62f04171ff22459f48263111c02ffff8a15d4ab04239bb
|
|
BLAKE2b-256 checksum How to use checksums |
ab82ee852f8f8aba3b64cd0fe4381b22ca18e1eeffcf49c936a673ec72e1363e
|
| Upload date | |
|
Uploaded using Trusted Publishing? What is trusted publishing? |
No |
| Uploaded via |
uv/0.6.10
|
Release files / argus_code-0.6.0-py3-none-any.whl
| Download URL | argus_code-0.6.0-py3-none-any.whl |
|---|---|
| Size | 572.4 kB |
| Tags | Python 3 |
|
SHA-256 checksum How to use checksums |
0e8cd4e8c06ec71aeb2f86aba18b335ad206784c897f5a8f0dadf1186277f02a
|
|
BLAKE2b-256 checksum How to use checksums |
825101bb371de0cfe1ad2ad0615ece8126ed3f1b6aa9dccbf9160328c803b1bc
|
| Upload date | |
|
Uploaded using Trusted Publishing? What is trusted publishing? |
No |
| Uploaded via |
uv/0.6.10
|














