








Request and SQL profiling for ASGI applications — Starlette and FastAPI, with SQLAlchemy and SQLModel. It records every request your application handles along with the SQL each one ran, and serves a browsable UI that tells you which endpoint is slow, whether it is the database, and which line of your code issued the query.
from fastapi import FastAPI
from asgi_profiler import install

app = FastAPI()
install(app)  # viewer at /profiler
That is the whole integration. No settings module, no database table, no migration.
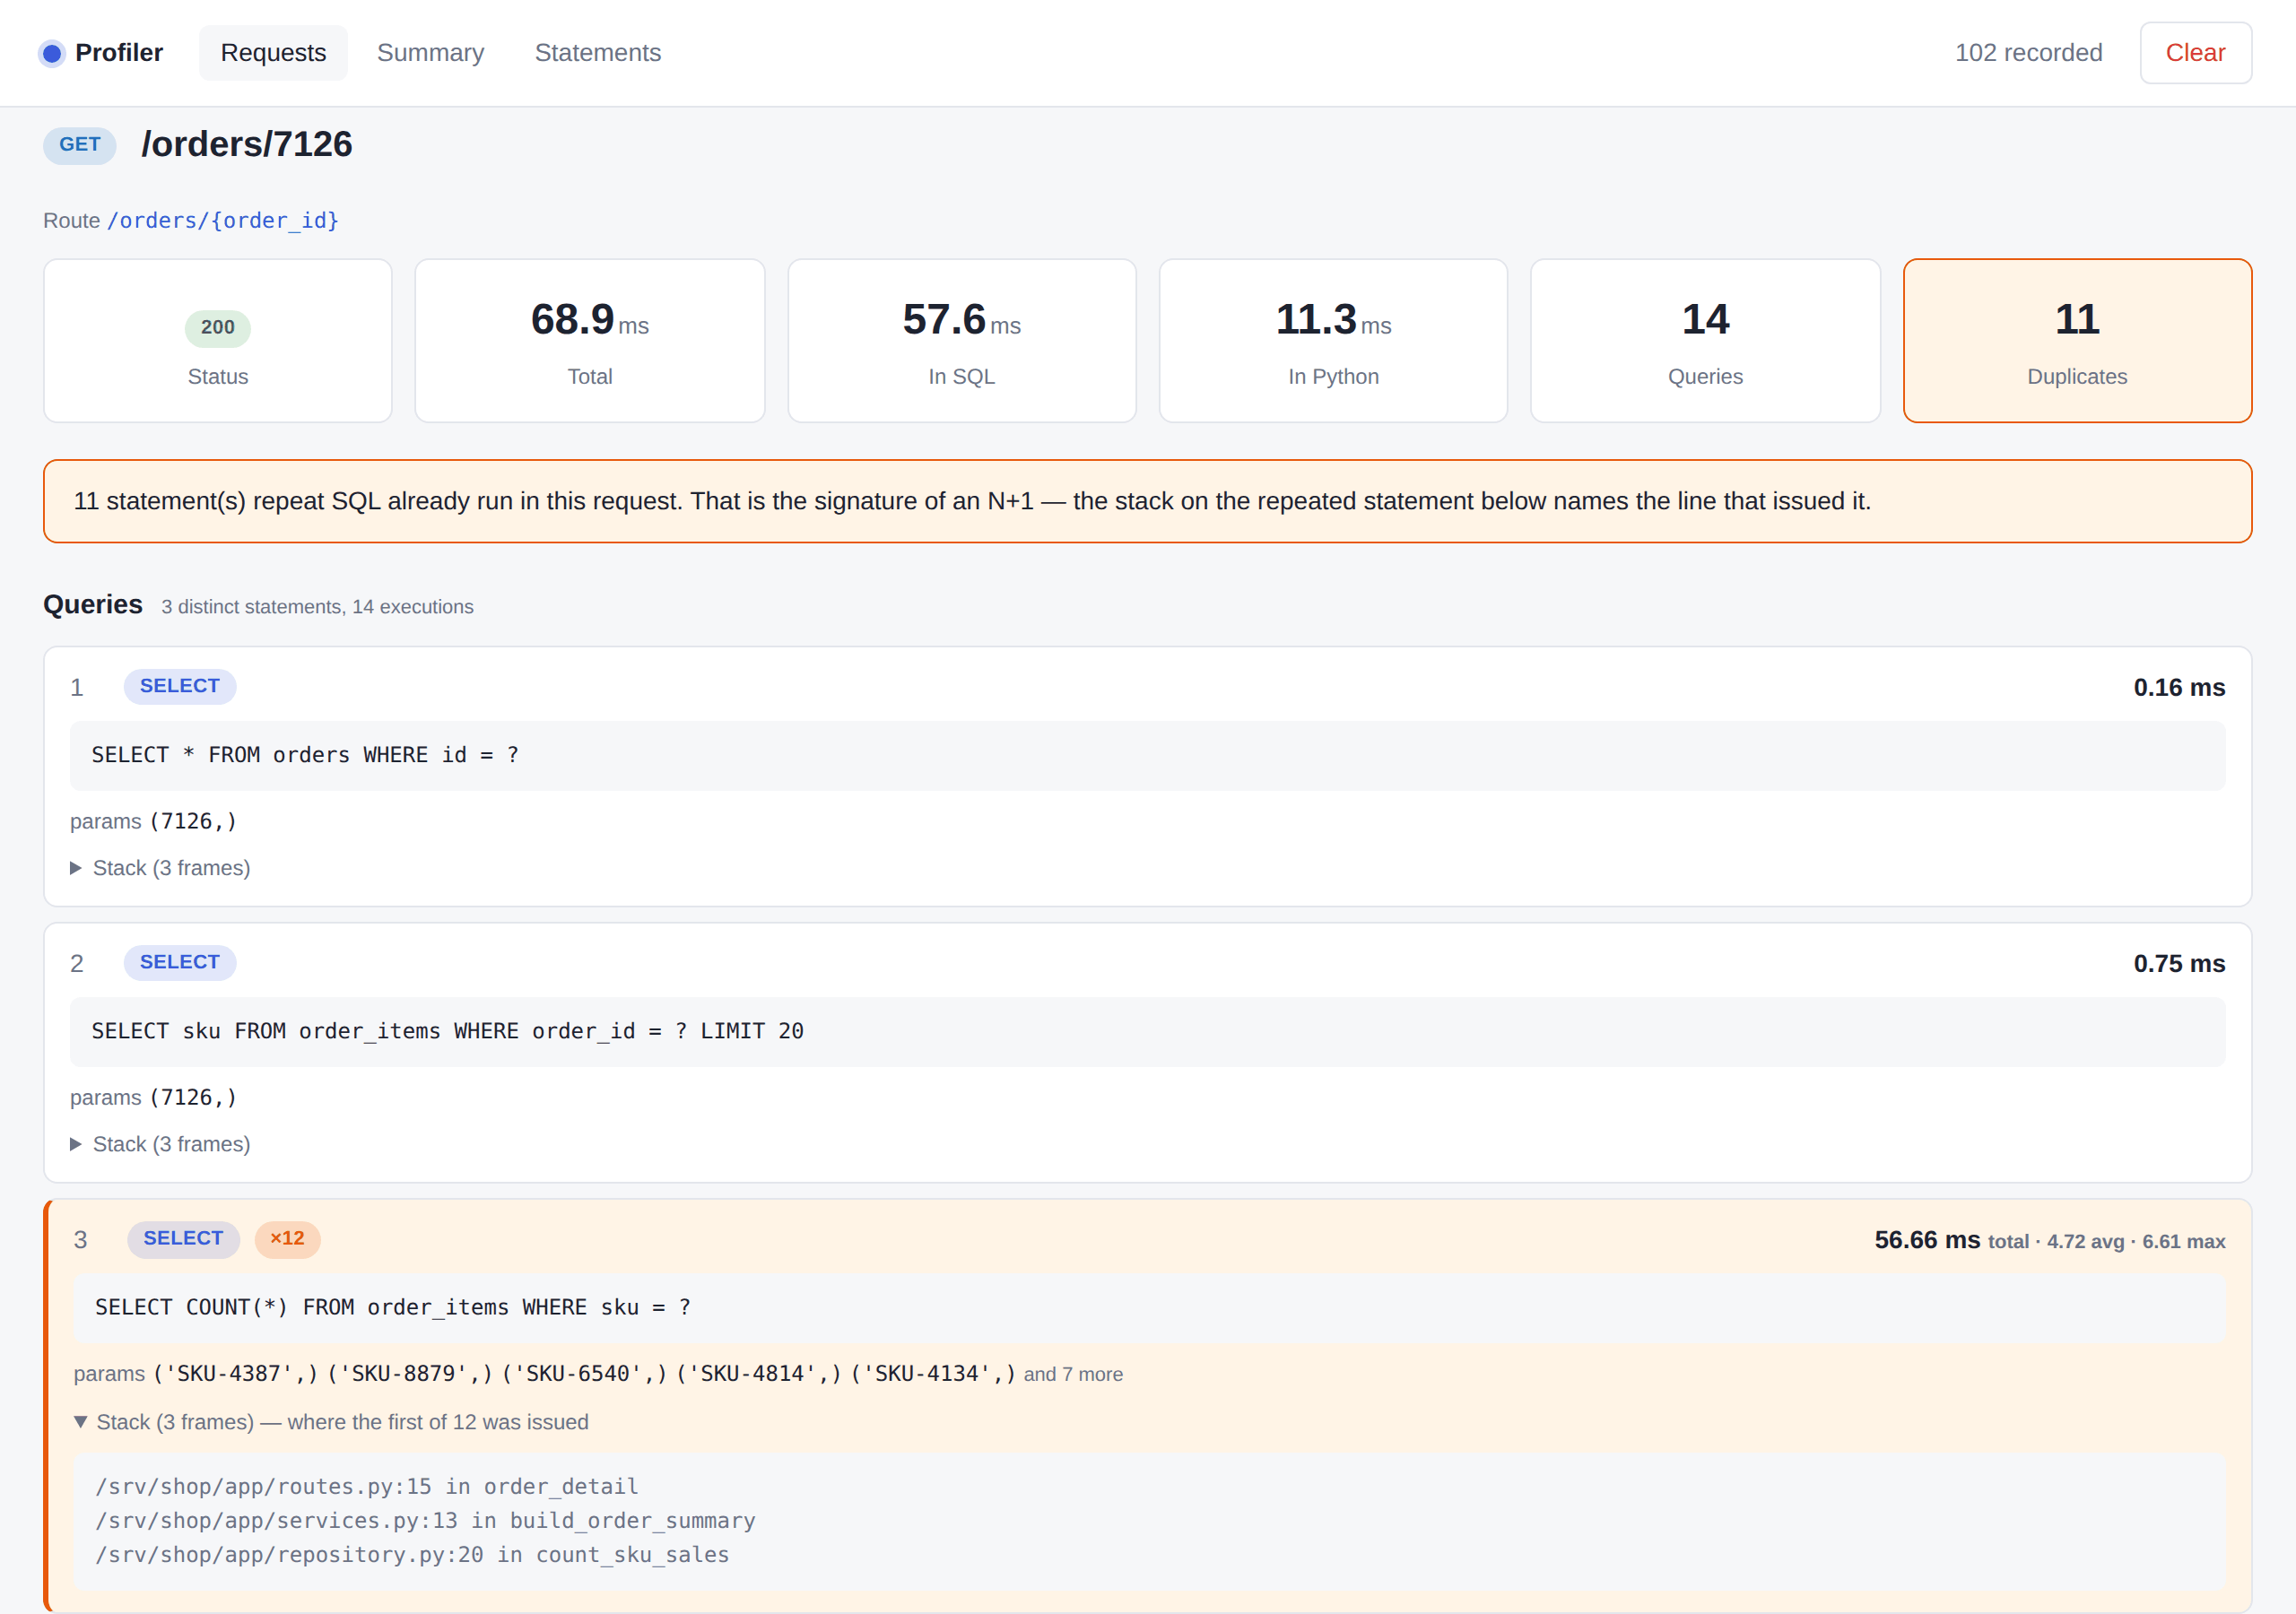
One endpoint, 68.9 ms, and 57.6 ms of it inside SQL. The same statement ran
twelve times because a loop asked the database once per line item — and the
stack on that statement names the three frames that did it, ending at
repository.py:20. That is the whole point: not that the request was slow, but
which line made it slow.
The request list, and the per-route summary
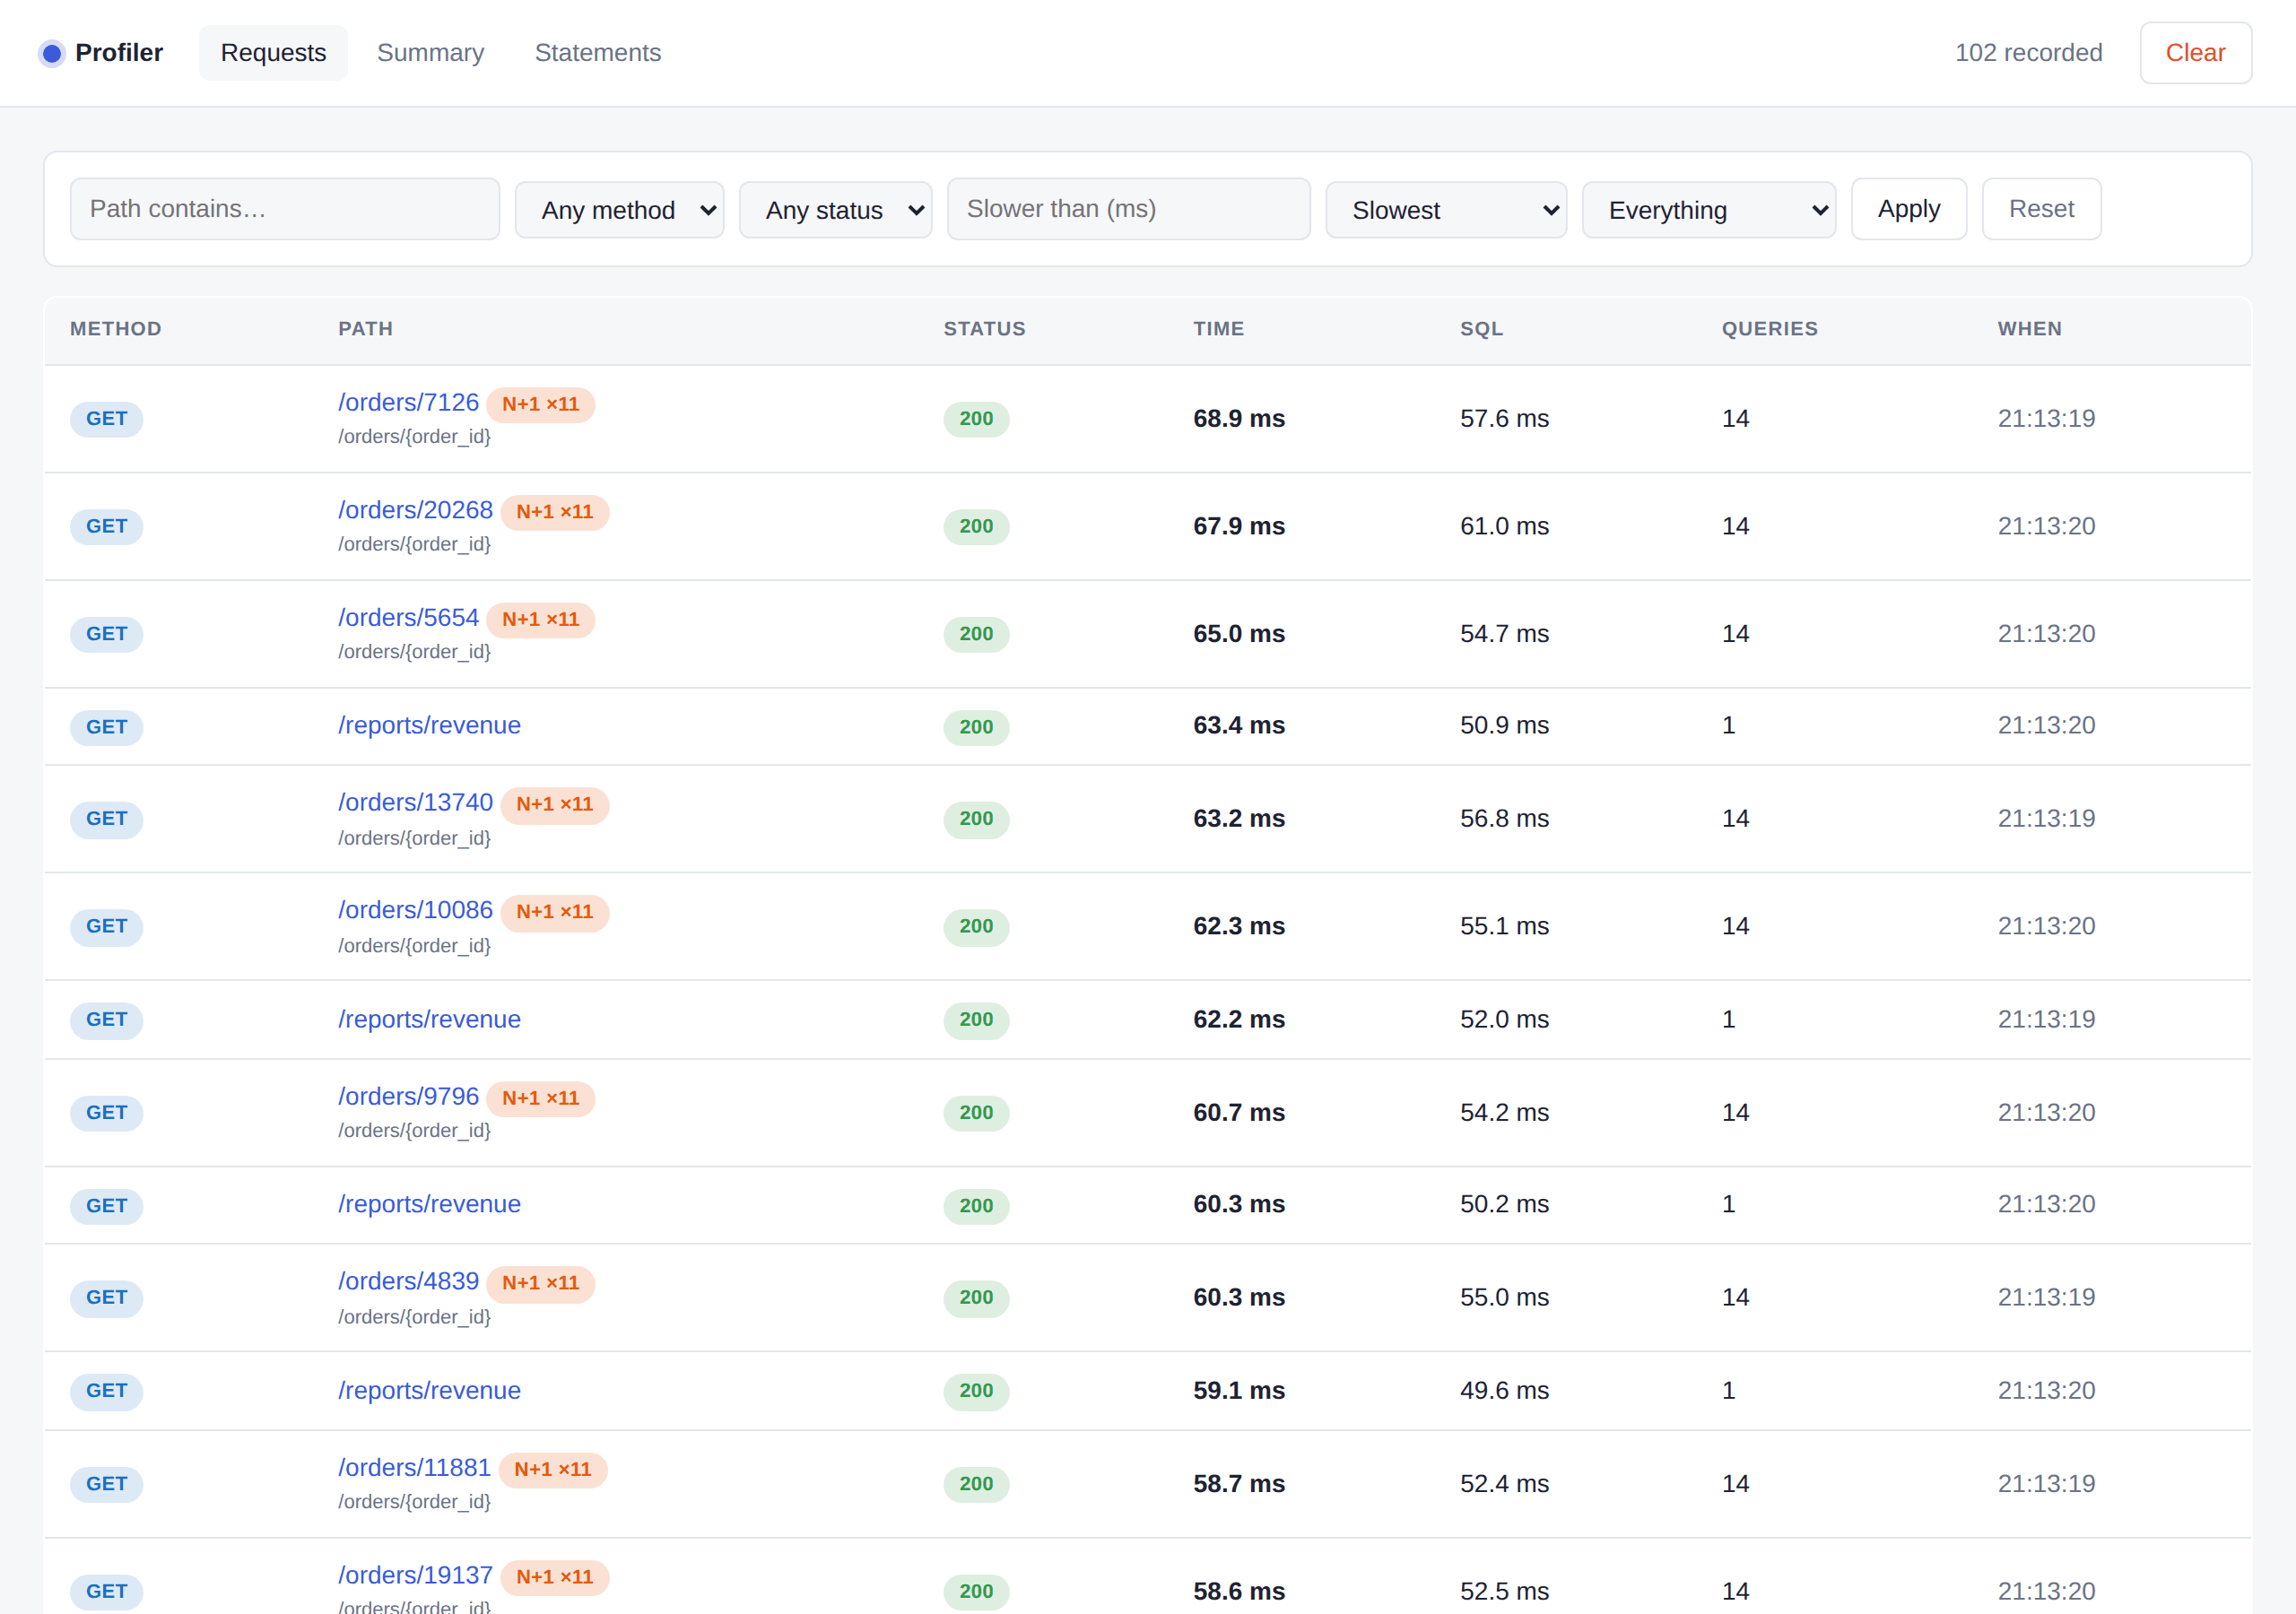
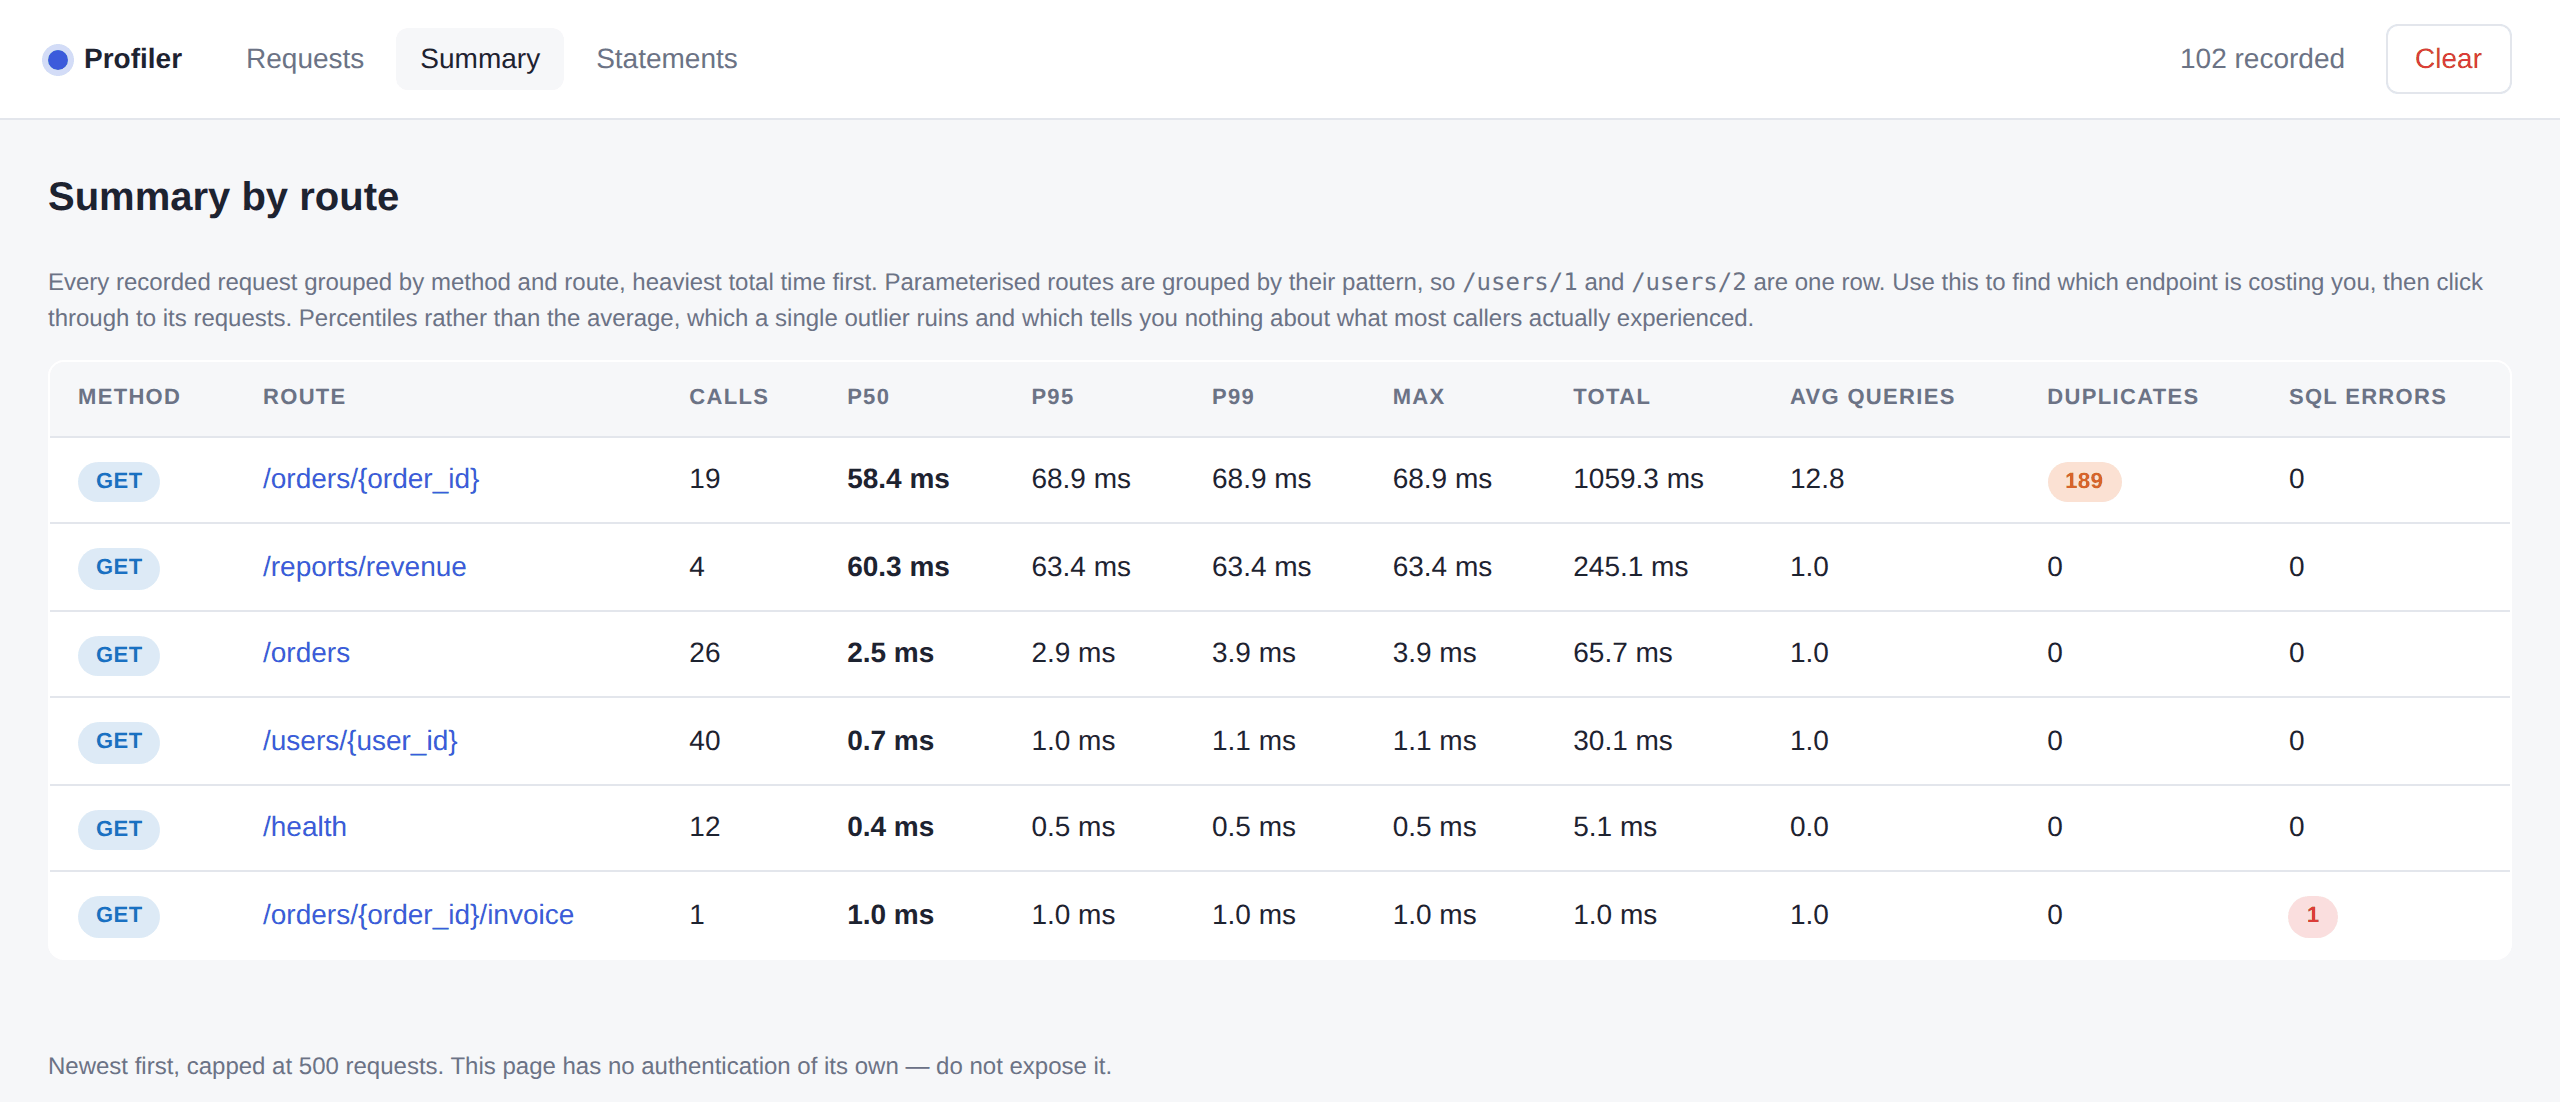
Table of Contents
- Table of Contents
- Key features
- Installation
- Usage
- What it shows
- JSON
- Configuration
- Storage
- Security
- How it works
- Limits
- Prior art
- Development
- Licence
Key features
- One line to install.
install(app)adds the middleware and mounts the viewer. You never hand the profiler an engine. - N+1 detection that names the line. Repeated statements collapse into a
single row with a
×Nbadge and the stack that issued them — a 500-row N+1 is one line to read, not 500 to scroll. - Grouped by route, not by path.
/users/1and/users/2aggregate as/users/{user_id}, with p50/p95/p99 rather than an average. - Cross-request statement view. Which SQL costs you application-wide, not just on the endpoint you happen to be looking at.
- JSON for every page, so a test can fail a build when an endpoint regresses.
- Works with async engines, sync engines, several engines at once, and SQLModel — with no configuration for any of them.
- Filter what you profile.
include_regex/exclude_regex, plus@profiler_excludeand@profiler_includefor a single route. An excluded request is skipped before routing, so a health check costs nothing. - Two storage backends, one of them shared across
uvicornworkers. - Fully typed and
py.typed, checked in CI withty, and scanned withbandit.
| Supported | |
|---|---|
| Starlette | ✅ |
| FastAPI | ✅ |
| SQLAlchemy 2.x (sync) | ✅ |
| SQLAlchemy 2.x (async) | ✅ |
| SQLModel | ✅ |
| Python 3.10 – 3.13 | ✅ |
| Litestar | planned |
Installation
pip install asgi-profiler
Dependencies are starlette, sqlalchemy and jinja2 — all of which you
already have.
Usage
from fastapi import FastAPI
from asgi_profiler import install

app = FastAPI()
install(app)
Make some requests, then open /profiler.
install() returns a handle if you want the data programmatically:
profiler = install(app)
...
for profile in profiler.slowest(5):
    print(profile.route, profile.query_count, profile.duplicate_count)

for statement in profiler.statements(10):
    print(f"{statement.total_ms:.0f}ms  x{statement.count}  {statement.sql[:60]}")
What it shows
Requests — every request, newest first: method, path, status, wall time,
time in SQL, query count. Rows that repeat a statement carry an N+1 ×n
badge; rows with a statement that raised carry a SQL error badge. Filter by
path substring, method, status class, route or a minimum duration; sort by most
recent, slowest, most queries or most SQL time; or narrow to N+1s or failures
only. Paginated.
Request detail — status, total time, time in SQL, time in Python, query
count, duplicate count and error count, then the statements it ran. Repeated
statements collapse into one row carrying a ×N badge, the total/average/max
time across those runs, a sample of the parameters, and one copy of the stack
that issued them all. Slow and failed statements are marked, and
request/response headers are shown with authorization, cookie and friends
redacted.
Summary — every request grouped by method and route pattern, so /users/1
and /users/2 are one row rather than two: calls, p50/p95/p99, max, total
time, average queries, total duplicates and total SQL errors, heaviest first.
Percentiles rather than the average, which one outlier ruins.
Statements — every statement grouped by its SQL, across all requests: runs, how many requests ran it, runs-per-request, total, average and max time, and how many routes it appears on. The per-request view tells you why this endpoint is slow; this tells you what is costing you application-wide — the query that runs three times on eleven endpoints is invisible in the former and obvious here.
Every response also carries an X-Profiler-Id header, so you can go straight
from a slow response to its trace at /profiler/request/<id>.
JSON
Every page has a JSON twin — /profiler/requests.json (honours the same
filters), /profiler/request/<id>.json, /profiler/summary.json,
/profiler/statements.json. Which makes the profiler scriptable, and lets a
test fail a build when an endpoint regresses:
def test_the_dashboard_has_no_n_plus_one(client):
    client.get("/dashboard")
    trace = client.get("/profiler/requests.json").json()["requests"][0]
    assert trace["duplicate_count"] == 0, "N+1 reintroduced"
    assert trace["query_count"] <= 5
Configuration
from asgi_profiler import install

install(
    app,
    mount_path="/_perf",  # anywhere; every link is relative to the mount
    max_requests=1000,
    exclude_paths=["/healthz"],  # matched on segment boundaries
    capture_stacks=True,  # the per-query stacks; costs a little per query
    stack_depth=8,
    slow_request_ms=500,
    slow_query_ms=50,
    capture_headers=True,
    response_header="x-profiler-id",  # None to add nothing
    page_size=50,
    statement_limit=100,  # rows on the Statements page
    authorize=lambda request: request.headers.get("x-key") == "...",
)
Storage
The default is an in-memory ring buffer: zero configuration, lost on restart,
and per process — under uvicorn --workers 4 the viewer shows you one
worker's quarter of the traffic. If that matters, use SQLite:
from asgi_profiler import SQLiteStorage, install

install(app, storage=SQLiteStorage("profiler.db", max_requests=5000))
History then survives restarts and every worker writes to the same file.
Writes go through a background thread, because add() is called while the
event loop is running: a synchronous insert there means an fsync, and with
several workers on one WAL file a lock wait that sqlite3 implements as a
blocking sleep. Measured at up to 230 ms of stall in a single add() before
this changed; it is now ~1 µs to enqueue. Reads flush first, so you never see a
stale page. Pass background=False for synchronous writes.
Paging and ordering are pushed down into SQL and stay flat as history grows.
The ?q= path filter is a substring match, which no index can serve, so it
scans — about 8 ms over 20,000 rows. Fine for a development tool; it is not a
log search engine.
Any object satisfying the Storage protocol works. Subclass BaseStorage and
you only need five methods — searching, paging, summarising and statement
aggregation are supplied, and you can override them where your backend can do
better:
from asgi_profiler import BaseStorage


class RedisStorage(BaseStorage):
    def add(self, profile): ...
    def get(self, profile_id): ...
    def list(self, *, limit=None, offset=0): ...
    def count(self): ...
    def clear(self): ...
Reading a capture without the app
python -m asgi_profiler profiler.db # viewer on :8080
Capture in staging, read the file on your laptop. No application required, and the file is opened read-only.
Security
install(app, authorize=lambda request: request.user.is_staff)


# async is fine too -- and any realistic guard is async
async def only_staff(request):
    return await is_staff(request.user)


install(app, authorize=only_staff)
A common pattern is to install it conditionally:
if settings.DEBUG:
    install(app)
POST /clear only accepts Sec-Fetch-Site: same-origin (or a same-origin
Origin), so another site — including a sibling subdomain — cannot make your
browser wipe your history. That is not authentication, though, and it is not a
substitute for authorize=.
How it works
Requests are captured by a pure-ASGI middleware. Pure ASGI rather than
BaseHTTPMiddleware on purpose: the latter runs the downstream app in a
separate task, which breaks the contextvar that query attribution depends on.
Queries are captured with SQLAlchemy's own before_cursor_execute,
after_cursor_execute and handle_error events, attached to the Engine
class. That is why you never hand the profiler an engine, and why SQLModel
needs no special support: sqlmodel.create_engine returns a SQLAlchemy
Engine and sqlmodel.Session subclasses sqlalchemy.orm.Session, so the
same events fire. Async engines are covered too — AsyncEngine drives a sync
Engine underneath, and that is where the events live.
Attribution uses a contextvar holding a mutable list. It has to be mutable: SQLAlchemy's sync work often runs in a worker thread, and anyio copies the context into that thread, so appends made there must land in an object the request task already holds. The test suite fires concurrent requests with different query counts and asserts none of them bleed.
Route patterns come from scope["route"] where the framework sets one
(FastAPI does, and that path is free). Plain Starlette sets no route key at
all, so the router is replayed once after the response to find which route
matched — exact where reconstructing from path_params is not, since a
{uid:int} matching 007 and a value that collides with a literal segment
both defeat string substitution. Patterns are returned absolute, so a sub-app
mounted at two prefixes does not collapse into one summary row.
Stacks are walked outward from the query and stop as soon as enough
application frames are found, crossing the greenlet boundary that SQLAlchemy's
async support puts between the query and your code.
traceback.extract_stack() would unwind the whole stack and read source lines
for every frame before discarding almost all of it, which on a realistic
100-frame async stack costs ~20× more per query.
URLs in the UI are all relative to the mount prefix, taken from
scope["root_path"] when the server sets one — which is also what accounts for
a proxy prefix — and otherwise from the prefix passed to build_viewer.
Limits
- Overhead is real. Two event callbacks and a
perf_counterpair per query, plus a stack capture if enabled — around 20 µs per query in situ, which on a 20-query endpoint is a ~70% increase in wall time. On plain Starlette, a parameterised route also costs one replayed routing pass per request to recover its pattern — about 11 µs at 50 routes, 42 µs at 200. FastAPI does not pay this. Development tool, not production telemetry. - No Python-side profiling yet. When an endpoint is slow and the SQL is not, "time in Python" is a single number with nothing behind it. A cProfile panel is the next thing to build.
- No request or response bodies. They carry credentials and can be large.
- WebSockets are not recorded. Only HTTP requests are.
- Global hooks. Listeners are on the
Engineclass, so every engine in the process is captured. That is deliberate — it is what makes app-wide capture work — but it means you cannot scope the profiler to one engine, andcapture_stacks/stack_depthare process-wide (the most recentinstall()wins). - Unmatched requests and raw ASGI mounts group by path. A 404 has no route
to name, and a mount to a bare ASGI app (StaticFiles, say) exposes none.
exclude_pathsif that is noisy. max_requestsbounds requests, not bytes. Statements over 4000 characters are truncated, but a request running thousands of queries still retains all of them.
Prior art
There is no actively maintained equivalent of django-silk for this stack, but there is prior art worth knowing about:
| Project | Notes |
|---|---|
| fastapi-debug-toolbar | A django-debug-toolbar port with a SQLAlchemy panel. FastAPI only; last release May 2024. |
| fastapi-sql-profiler | SQL profiling for FastAPI. |
This project differs in being Starlette-level rather than FastAPI-only, in not injecting a toolbar into your responses, and in offering a cross-request summary aggregated by route alongside per-query application stacks.
Development
uv sync --all-extras
uv run pre-commit install
uv run pytest
pre-commit install is the whole check setup: ruff format, ruff check,
ty, bandit and a lockfile check run on every commit, and the suite runs on
push. To run them without committing:
uv run pre-commit run --all-files
Building and publishing go through uv too:
uv build --no-sources
Releases are cut by pushing a bare version tag (0.1.0); CI builds and
publishes with
uv publish over PyPI Trusted Publishing, so no token is stored anywhere.
The suite covers recording, SQL capture, N+1 detection and collapsing, failed statements, stack capture and ordering across the greenlet boundary, header redaction, history bounds, every viewer page parsed for well-formed HTML, filters, pagination, the JSON endpoints, custom mount paths, proxy root paths, the authorize hook (sync and async), CSRF on clear, route-pattern grouping under mounts and typed converters, async engines, multiple engines in one process, concurrent request attribution, both storage backends asserted against the same expectations, a custom storage backend, and queries issued outside any request.
Licence
MIT.
1 maintainer

Metadata
1 maintainer
Release files for asgi-profiler 0.2.0
For a detailed explanation of source distributions (sdists) and built distributions (wheels), please see the package formats documentation.
Source distribution (sdist)
| File | Size | Uploaded | |
|---|---|---|---|
| asgi_profiler-0.2.0.tar.gz | 86.4 kB | Details |
Built distribution (wheel)
| File | Interpreter | ABI | Platform | Reset |
|---|---|---|---|---|
| asgi_profiler-0.2.0-py3-none-any.whl | Python 3 | none | any | Details |
Total release size: 149.9 kB
Release files / asgi_profiler-0.2.0.tar.gz
| Download URL | asgi_profiler-0.2.0.tar.gz |
|---|---|
| Size | 86.4 kB |
| Tags | Source |
|
SHA-256 checksum How to use checksums |
da8dc3185c96c4aa19819f2b72ab6b1e2a5f3d8ca20642bbd96d5629c2bb3f7a
|
|
BLAKE2b-256 checksum How to use checksums |
da0626f342a1fd4aac780b1f7f3851710f25d4b93bbea8fae4a1c5d8a9e04e83
|
| Upload date | |
|
Uploaded using Trusted Publishing? What is trusted publishing? |
Yes |
| Uploaded via |
uv/0.8.17
|
Release files / asgi_profiler-0.2.0-py3-none-any.whl
| Download URL | asgi_profiler-0.2.0-py3-none-any.whl |
|---|---|
| Size | 63.4 kB |
| Tags | Python 3 |
|
SHA-256 checksum How to use checksums |
850be1a424824f75306a15e84d7b8a5e09ce278349cd18068a444579bed733e3
|
|
BLAKE2b-256 checksum How to use checksums |
548821f1302f6900c95483d3d9ee436ea2665ee26a800e5cc3e290b0415a6e78
|
| Upload date | |
|
Uploaded using Trusted Publishing? What is trusted publishing? |
Yes |
| Uploaded via |
uv/0.8.17
|














