AssayBench: a gene ranking benchmark for evaluating LLMs on biological assay data

Project description
AssayBench
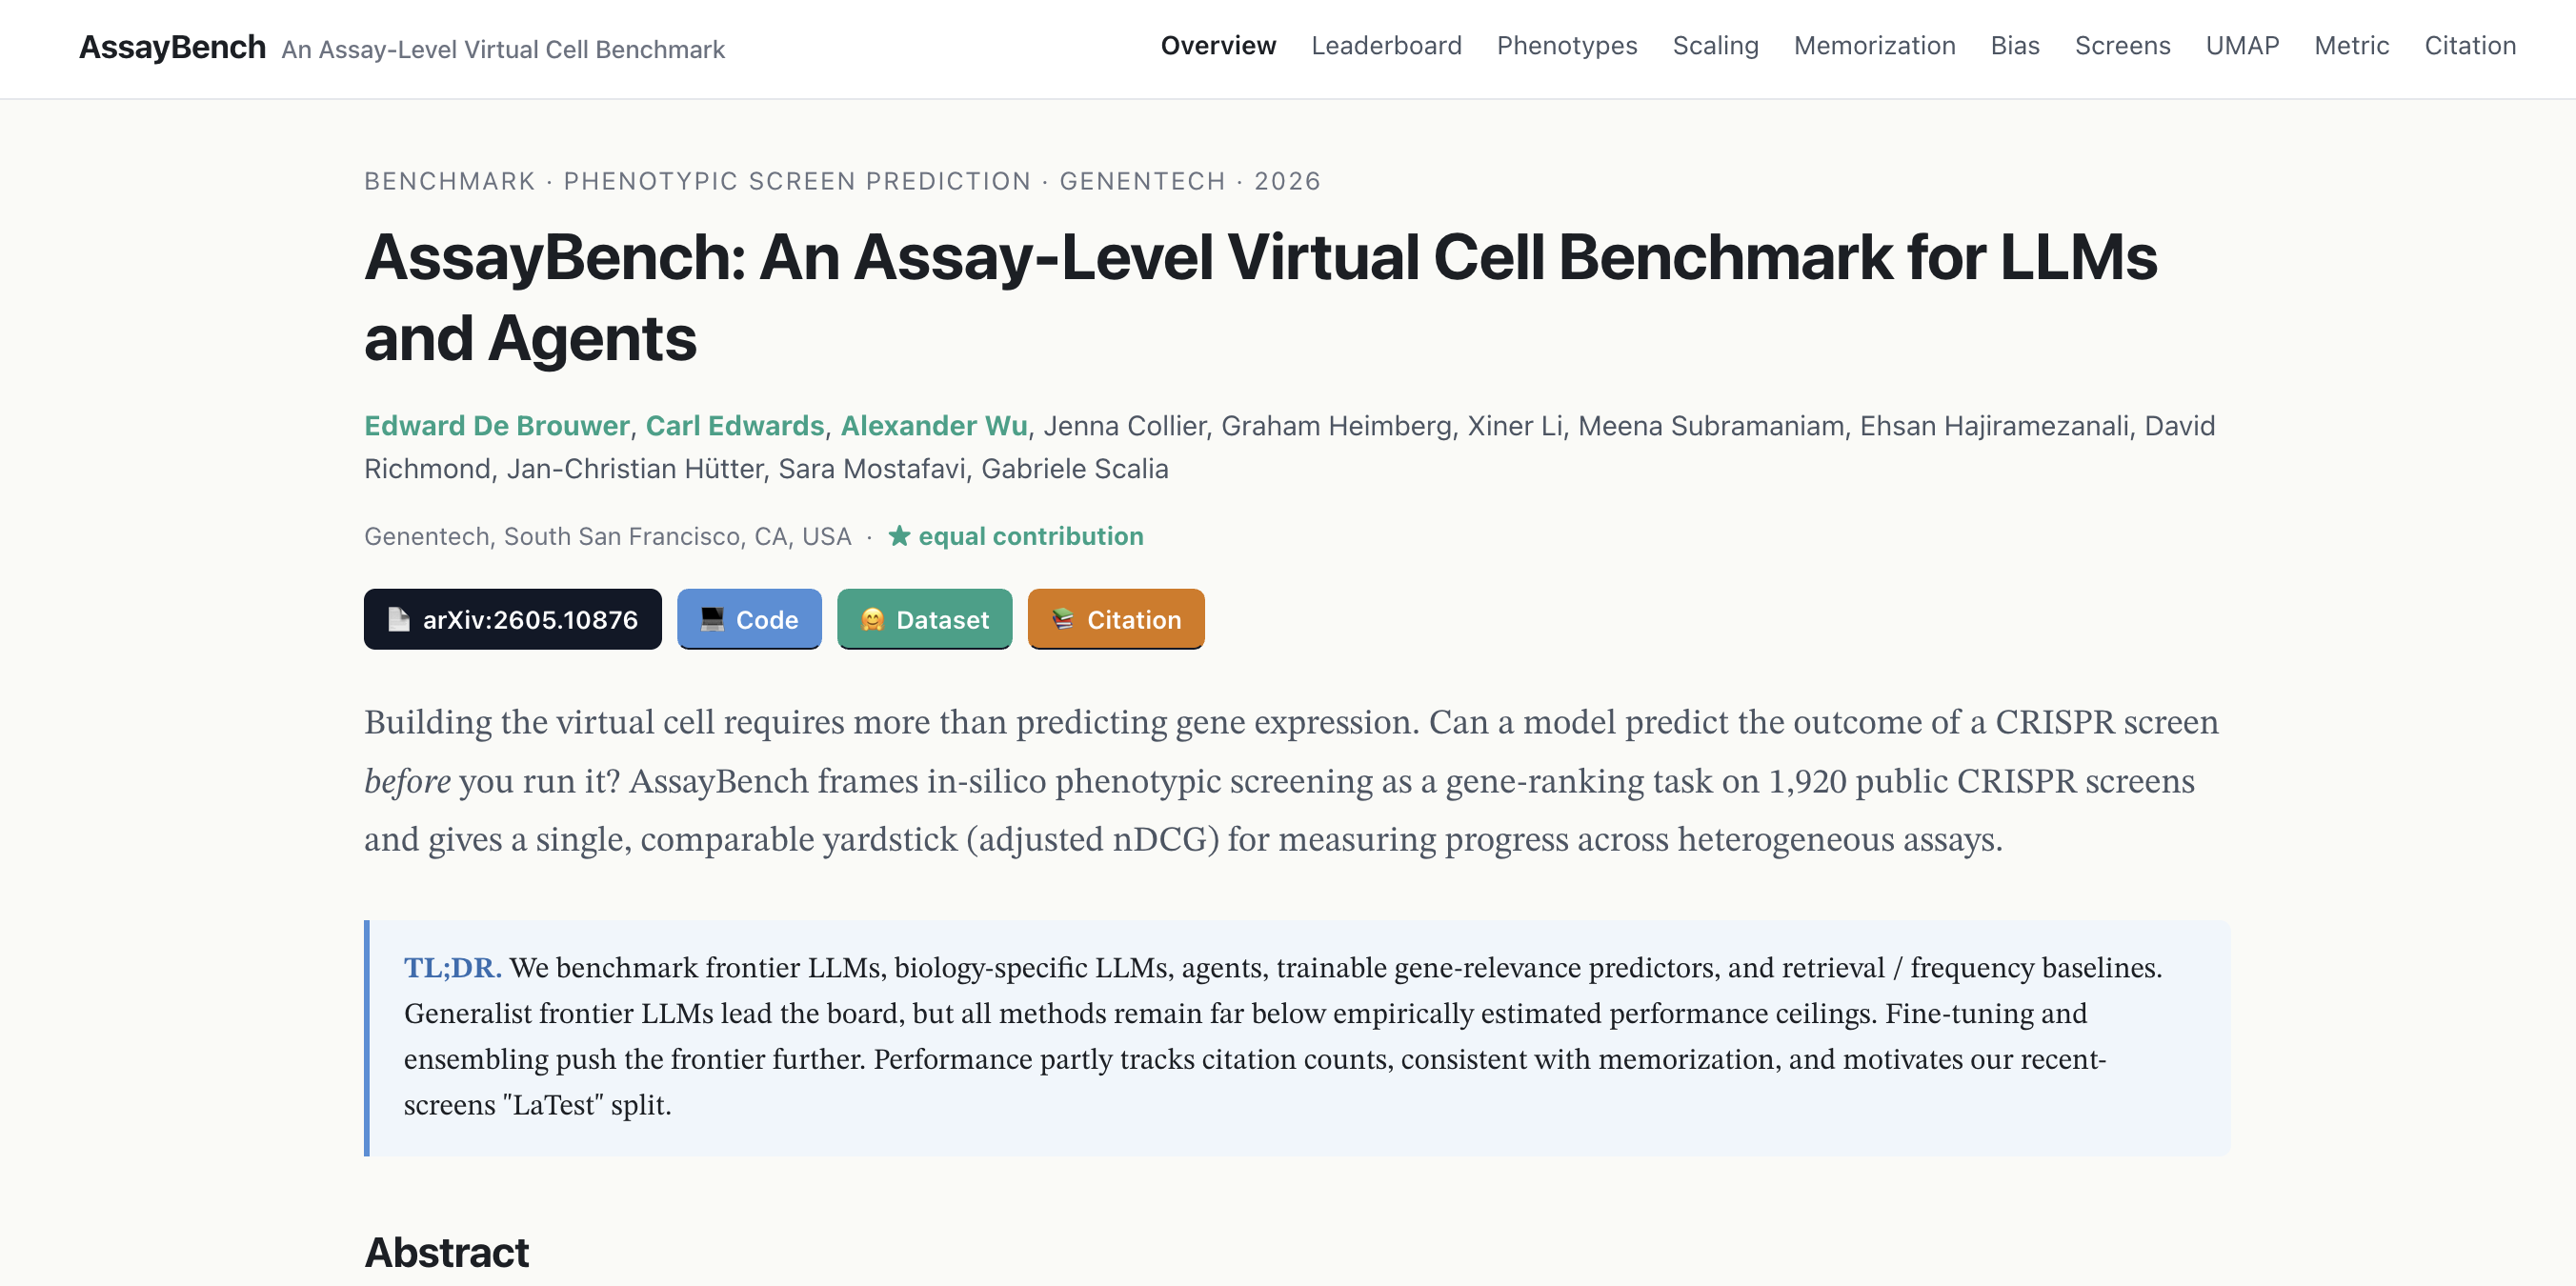
A benchmark for evaluating machine learning models on phenotypic screen prediction.
:globe_with_meridians: Website | :octocat: Code | :hugs: Dataset | :page_with_curl: Paper
0. News
We released a website with interactive data visualization!
1. Installation
Install directly from the repository:
pip install git+ssh://git@github.com/Genentech/AssayBench.git
or clone the repo and install in editable mode:
git clone git@github.com:Genentech/AssayBench.git && cd AssayBench
pip install -e .
Both install the assaybench package, which provides:
AssayBenchDataset— loads screens and splits from HuggingFace (Genentech/assaybench)RankingMetrics— computes ranking metrics (adjusted nDCG, precision, FDR, etc.)
With uv
You can add it to your project with
dependencies = [
    "assaybench @ git+ssh://git@github.com/Genentech/AssayBench.git",
]
2. Usage
Loading data and scoring a model
Each example in the dataset contains a question prompt describing a CRISPR screen, along with ground-truth relevance_genes and relevance_scores. To evaluate a model, pass its predicted gene ranking (a plain list[str]) together with the ground-truth genes and scores to RankingMetrics.evaluate():
from assaybench import AssayBenchDataset
from assaybench.benchmark.metrics import RankingMetrics

# Load the dataset with year-based splits
ds = AssayBenchDataset(
    dataset_name="biogrid",
    split_type="year",
    fold=0,
    novel_dataset_name="LaTest",
)
train, val, test, latest = ds.get_train_test_split()

# Define your model — any function that returns a ranked list of gene names
def my_model(prompt: str) -> list[str]:
    return ["BRCA1", "TP53", "MYC", ...]  # top predicted genes

# Score predictions
metrics = RankingMetrics(k_values=[10, 100])

for example in val:
    predicted_genes = my_model(example["question"])
    scores = metrics.evaluate(
        predicted_genes=predicted_genes,
        ground_truth_genes=example["relevance_genes"],
        relevance_scores=example["relevance_scores"],
    )
    print(f"Screen {example['dataset_name']}: AnDCG@100 = {scores['adjusted_ndcg@100']:.4f}")
See examples/load_data.ipynb for a complete walkthrough.
Dataset fields
Each screen returned by get_train_test_split() is a dictionary with the following fields:
| Field | Type | Description |
|---|---|---|
question |
str | The prompt describing the screen and ranking task |
relevance_genes |
list[str] | All genes in the screen library |
relevance_scores |
list[float] | Thresholded percentile scores for each gene (higher = more relevant) |
hit |
list[bool] | Whether each gene is a hit in the screen |
dataset_name |
str | Screen identifier |
screen_ids |
list[int] | BioGRID screen ID(s) (>1 for merged duplicate screens) |
phenotype |
str | Full phenotype description |
cleaned_phenotype |
str | Coarse phenotype category (e.g. "Fitness / Proliferation / Viability") |
condition_clause |
str | Experimental condition (e.g. drug treatment, dose) |
cell_type |
str | Cell type used in the screen |
cell_line |
str | Cell line name |
screen_type |
str | Selection type (e.g. "Positive Selection", "Negative Selection") |
library_methodology |
str | Screen methodology (e.g. "Knockout", "Activation") |
screen_rationale |
str | Scientific rationale for the screen |
screen_category |
str | Screen directionality (e.g. "unidirectional", "bidirectional") |
num_genes |
int | Number of genes in the screen library |
author |
str | Publication author and year (e.g. "Wang T (2014)") |
source_id |
str | PubMed ID of the source publication |
split |
str | Data split assignment: train, validation, test, or novel_dataset |
answer |
str | Top 10 genes by relevance score (comma-separated, for reference) |
Metrics
RankingMetrics.evaluate() returns a dictionary of scores. The primary metrics (computed at each k in k_values) are:
| Metric | Description |
|---|---|
ndcg@k |
Normalized Discounted Cumulative Gain — measures ranking quality using graded relevance scores |
adjusted_ndcg@k |
nDCG adjusted for chance performance — the main benchmark metric (AnDCG) |
precision@k |
Fraction of top-k predictions that are hits |
normalized_precision@k |
Precision normalized by the number of true positives (NPrecision) |
fdr@k |
Fraction of top-k predictions that are non-hits (False Discovery Rate) |
normalized_fdr@k |
FDR normalized by the number of true negatives |
recall@k |
Fraction of true hits recovered in the top-k predictions |
auroc |
Area Under the ROC Curve over the full ranked list |
mrr |
Mean Reciprocal Rank — reciprocal of the rank of the first hit |
hallucination_rate |
Fraction of predicted genes not found in the screen library |
hit_scaled_ndcg@k |
nDCG computed using binary hit labels instead of graded relevance |
hit_scaled_adjusted_ndcg@k |
Adjusted nDCG using binary hit labels |
By default all metric groups are computed. Pass metric_groups={"adjusted_ndcg", "precision"} to restrict to a subset.
Custom prompts
By default, AssayBenchDataset formats each screen's question field using a built-in prompt template (see src/assaybench/data/prompts/objective_prompts.yaml). You can override it by passing a prompt_template string to the constructor:
my_template = """
You are a genetics expert. Given the following CRISPR screen:
- Cell line: {cell_line} ({cell_type})
- Library: {library_type} ({library_methodology})
- Phenotype: {phenotype}

Rank the top 100 genes most likely to be hits.
Format: GENE1, GENE2, ..., GENE100
"""

ds = AssayBenchDataset(
    dataset_name="biogrid",
    split_type="year",
    fold=0,
    prompt_template=my_template,
)
The template is formatted with Python's str.format() using each screen's metadata fields. Available placeholders:
| Placeholder | Description |
|---|---|
{cell_line} |
Cell line name |
{cell_type} |
Cell type description |
{library_type} |
Library type (e.g. "CRISPRn") |
{library_methodology} |
Methodology (e.g. "Knockout", "Activation") |
{experimental_setup} |
Experimental design (e.g. "Drug Exposure") |
{duration} |
Screen duration (e.g. "12 Days") |
{condition_clause} |
Condition details (e.g. " under Etoposide treatment (130.0 nM)") |
{phenotype} |
Phenotype description |
{significance_criteria} |
Statistical threshold for hit calling |
{ranking_rationale} |
What makes a gene rank highly |
{notes} |
Additional screen notes |
Collecting LLM Results
Results from LLMs can be collected using this script; it uses DSPy and a couple additional instructions:
Your goal is to provide a list of genes that meet the screen criteria, even if you do not have access to the actual experimental data. The genes must use HGNC symbols. Use your knowledge of biology, gene function, and relevant pathways to predict which genes are most likely to be hits. Do not refuse to answer or say you need more data—make your best predictions based on your understanding of the biological context.
Example Command:
uv run python benchmarking/predictions_generation/collect_llm_predictions.py --config-name=collect-GLM-5
3. Paper reproduction
All figure scripts live in figures/ and read from a results cache built from the prediction files in benchmarking/predictions/.
Step 1: Build the results cache
cd figures
python generate_results_cache.py
This scores all prediction files against the ground truth and saves the results to figures/journal_figures_cache/results_cache.pkl.
To rescore only specific models (faster):
python generate_results_cache.py --model "gemini-3-pro" --model "gpt-5.4"
Step 2: Generate figures and tables
python plot0_proportions.py
python plot1_selected_methods.py
python plot2_phenotype_bar_plot_year.py
python plot3_duplicate_transfer_vs_model.py
python plot4_memorization_analysis.py
python plot5_scaling_laws.py
python plot6_bias.py
Outputs (PNG, PDF, LaTeX tables) are saved to figures/journal_figures/.
| Script | Description |
|---|---|
plot0_proportions.py |
Dataset statistics table and phenotype composition pie charts |
plot1_selected_methods.py |
Main benchmark bar plot + LaTeX tables for selected methods |
plot2_phenotype_bar_plot_year.py |
Per-phenotype performance bar plot (year split) |
plot3_duplicate_transfer_vs_model.py |
Duplicate-screen cross-transfer vs model performance |
plot4_memorization_analysis.py |
Regression of performance on publication year, phenotype, and citations |
plot5_scaling_laws.py |
Qwen3.5 scaling laws (AnDCG@100 vs model size) |
plot6_bias.py |
Gene-level prediction bias analysis across models |
Citation
If you found our work useful, please cite:
@misc{debrouwer2026assaybench,
      title={AssayBench: An Assay-Level Virtual Cell Benchmark for LLMs and Agents},
      author={Edward De Brouwer and Carl Edwards and Alexander Wu and Jenna Collier and Graham Heimberg and Xiner Li and Meena Subramaniam and Ehsan Hajiramezanali and David Richmond and Jan-Christian Hütter and Sara Mostafavi and Gabriele Scalia},
      year={2026},
      eprint={2605.10876},
      archivePrefix={arXiv},
      primaryClass={cs.LG},
      url={https://arxiv.org/abs/2605.10876},
}
Release history Release notifications | RSS feed

Download files
Download the file for your platform. If you're not sure which to choose, learn more about installing packages.
Source Distribution
Built Distribution
Filter files by name, interpreter, ABI, and platform.
If you're not sure about the file name format, learn more about wheel file names.
Copy a direct link to the current filters
File details
Details for the file assaybench-0.1.0.tar.gz.
File metadata
- Download URL: assaybench-0.1.0.tar.gz
- Upload date:
- Size: 54.0 MB
- Tags: Source
- Uploaded using Trusted Publishing? No
- Uploaded via: uv/0.9.25 {"installer":{"name":"uv","version":"0.9.25","subcommand":["publish"]},"python":null,"implementation":{"name":null,"version":null},"distro":{"name":"Amazon Linux","version":"2023","id":null,"libc":null},"system":{"name":null,"release":null},"cpu":null,"openssl_version":null,"setuptools_version":null,"rustc_version":null,"ci":null}
File hashes
| Algorithm | Hash digest | |
|---|---|---|
| SHA256 |
e65c9260be6f4c33fc3744889f2091bf5aea2362b8525b876621852cf992747c
|
|
| MD5 |
af75230f0ab8f86bd0b553bae9c2b3e6
|
|
| BLAKE2b-256 |
ea95d2fd4f53c020b2bb74ec14c723f54f88a48c626f14db963a6a975d23dec7
|
File details
Details for the file assaybench-0.1.0-py3-none-any.whl.
File metadata
- Download URL: assaybench-0.1.0-py3-none-any.whl
- Upload date:
- Size: 1.3 MB
- Tags: Python 3
- Uploaded using Trusted Publishing? No
- Uploaded via: uv/0.9.25 {"installer":{"name":"uv","version":"0.9.25","subcommand":["publish"]},"python":null,"implementation":{"name":null,"version":null},"distro":{"name":"Amazon Linux","version":"2023","id":null,"libc":null},"system":{"name":null,"release":null},"cpu":null,"openssl_version":null,"setuptools_version":null,"rustc_version":null,"ci":null}
File hashes
| Algorithm | Hash digest | |
|---|---|---|
| SHA256 |
02703e61a52a96a702dc96221054cb610f9226186ff619b044c44e571f932f47
|
|
| MD5 |
c5b403ea57e85d91ba7f49f969640629
|
|
| BLAKE2b-256 |
6d1892068abbfc263bdb2fe5f856cd3cc8071af364b274a7be77e4f0d1cc2855
|


