
AstroDataPy


Python tools to collect astronomical data.
This is a python package dedicated to collect up-to-date astronomical data from both observational and modelling campaigns, with a focus on galaxy properties. Current package includes 1) statistical properties such as the number densities of galaxies (as functions of stellar mass, UV magnitude, [OIII] luminosity and star formation rate) and AGN (as functions of black hole mass and quasar UV/optical/bolometric/X-ray luminosities); 2) correlations between galaxy properties such as the Magorrian relation, Tully Fisher relation, disk size - stellar mass relation and halo - stellar mass relation; and 3) clustering of quasars such as the two point correlation function. Every dataset is converted to common units and to the Hubble parameter you ask for.
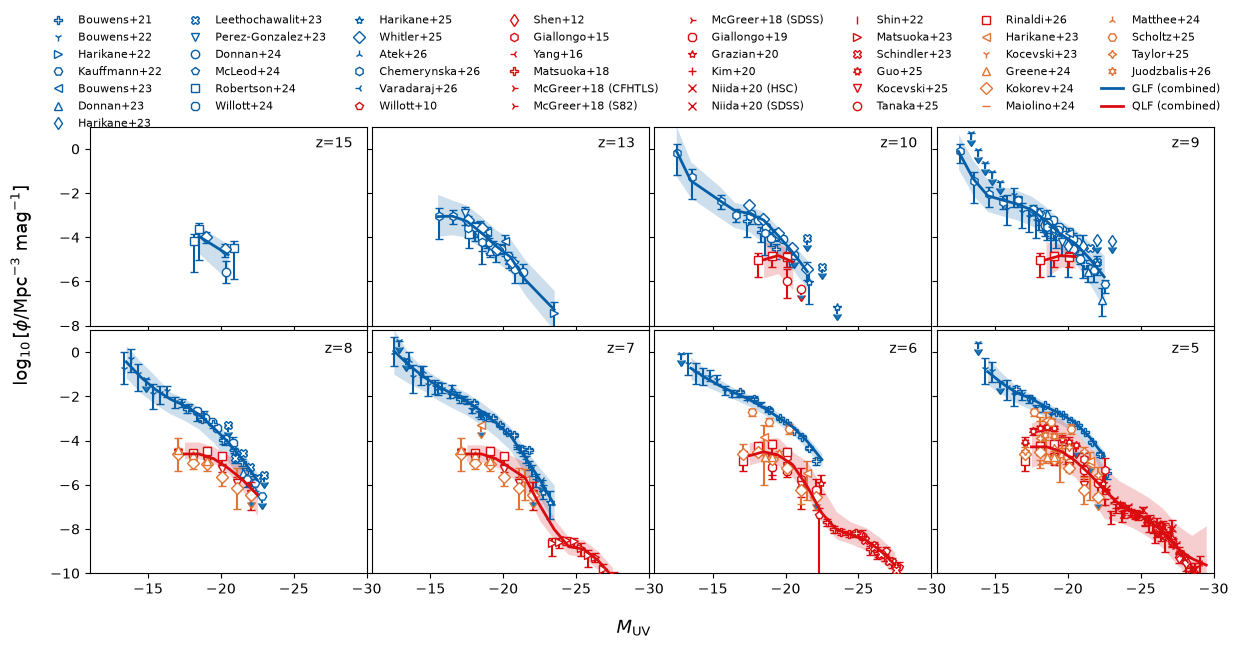
UV luminosity functions of galaxies (blue) and AGN (red) at z = 5-15 in astrodatapy, with the combined constraints made by combine.ipynb.
Installation
astrodatapy needs Python 3.6 or later, with numpy and pandas.
$ pip install astrodatapyOn Python 3.6 and 3.7, upgrade pip first (pip install --upgrade pip). To also get what the example notebooks need (matplotlib, scipy, astropy and Jupyter):
$ pip install "astrodatapy[notebooks]"For the latest version on GitHub, which may have data not yet released:
$ pip install git+https://github.com/qyx268/astrodatapyTests
The tests load every dataset and execute the example notebooks:
$ pip install "astrodatapy[test,notebooks]"
$ pytest --pyargs astrodatapy
Without the notebooks extra, the notebook tests are skipped.
Usage
Each of the three classes, number_density, correlation and clustering, takes a feature name (see Features) and a target redshift, and loads every dataset of that feature with a data file within z_tol (default 0.25) of it:
from astrodatapy.number_density import number_density
obs = number_density(feature='GLF_UV', z_target=7.0, h=0.6774, quiet=True)
The other arguments are h, the Hubble parameter H0/(100 km/s/Mpc) to convert the data to (default 1); quiet, to stop it printing what it loads and converts; and, for number_density and correlation, IMF_out, the IMF to convert stellar masses and star formation rates to (Salpeter, DietSalpeter, Kroupa or Chabrier; default Kroupa).
The datasets found are in obs.target_observation, a pandas DataFrame indexed by dataset name, with columns:
DataType: data, dataULimit (upper limits), data_sim (a model), or the parametric fit it was evaluated from (e.g. Schechter);
FileName: the data file loaded;
Data: a numpy array. For number_density its columns are x, phi, and the upper and lower bound of phi, with phi linear in Mpc^-3 dex^-1 (Mpc^-3 mag^-1 for magnitudes); for upper limits all three phi columns hold the limit. BHM is the exception: its columns are the redshift, the black hole mass in Msun (linear) and its upper and lower bound. For correlation the columns are x, the upper and lower bound of x, y, and the upper and lower bound of y.
number_density rescales phi as h^3, stellar masses, star formation rates and luminosities as h^-2, magnitudes by 5 log10(h/h_obs), and black hole masses according to how they were measured. correlation rescales each quantity with the power of h given for its dataset (e.g. h^-2 for stellar masses, h^-1 for sizes and halo masses, none for velocities and ratios), and clustering the correlation length. See the data format for details.
Example 1
read the quasar two point correlation function at z = 4 with a redshift range of [3.5, 4.5]
>>> import numpy as np
>>> from astrodatapy.clustering import clustering
>>> obs = clustering(feature = 'QC_2PTCF', z_target = 4.0, z_tol = 0.5)
You are requesting QC_2PTCF at z_target=4.00 with a tolerance of z_tol=0.50 and h=1.000
quiet=True to silent
available data of QC_2PTCF includes:
Shen2007 Shen2009 He2018 Eftekharzadeh2015 Chehade2016 Retana-Montenegro2016

Loading observational data from He2018...
Filename .../site-packages/astrodatapy/data//QC_2PTCF/z3pt8.dat
..done
>>> # show all available data of QC_2PTCF
>>> list(obs.available_observation)
['Shen2007', 'Shen2009', 'He2018', 'Eftekharzadeh2015', 'Chehade2016', 'Retana-Montenegro2016']
>>> # show the redshifts of all available data of QC_2PTCF
>>> np.sort(obs.z_available_observation)
array([0.6, 1.5, 2.5, 3.2, 3.8, 4.5])
>>> # show the target data of QC_2PTCF at z = 4
>>> obs.target_observation[['DataType', 'FileName']]
                    DataType   FileName
Name
He2018  PowerLaw_2COMPONENTS  z3pt8.dat
Example 2
read the UV luminosity function at z = 7, converted to h = 0.6774, without printing information
>>> from astrodatapy.number_density import number_density
>>> obs = number_density(feature = 'GLF_UV', z_target = 7.0, h = 0.6774, quiet = True)
>>> print(obs.n_target_observation)
14
>>> # M1600, phi, upper and lower bound of phi of Bouwens et al. (2021)
>>> obs.target_observation.loc['Bouwens2021', 'Data'][:3]
array([[-2.22612642e+01,  9.06236306e-07,  2.71870892e-06, -9.06236306e-07],
       [-2.17612642e+01,  3.71556885e-05,  4.71242879e-05,  2.71870892e-05],
       [-2.12612642e+01,  4.25931064e-05,  5.61866509e-05,  2.89995618e-05]])
Example 3
plot the galaxy stellar mass function at redshift 5 and show labels
import numpy as np
import matplotlib.pyplot as plt
from astrodatapy.number_density import number_density

colors     = ['#e41a1c','#377eb8','#4daf4a','#984ea3','#ff7f00','#a65628','#f781bf','#999999'] * 4
markers    = ['o','s','v','^','<','>','p','*','D','.','8'] * 4
linestyles = ['-','--','-.',':']

z   = 5.0
obs = number_density(feature='GSMF', z_target=z, quiet=True, h=0.678)

j_data = 0
k_func = 0
fig, ax = plt.subplots(1, 1)
for ii in range(obs.n_target_observation):
    data      = obs.target_observation['Data'].iloc[ii]
    label     = obs.target_observation.index[ii]
    datatype  = obs.target_observation['DataType'].iloc[ii]
    color     = colors[ii]
    marker    = markers[j_data]
    linestyle = linestyles[k_func]
    data[:,1:] = np.log10(data[:,1:])
    if datatype == 'data':
        ax.errorbar(data[:,0], data[:,1], yerr=[data[:,1]-data[:,3], data[:,2]-data[:,1]],
                    label=label, color=color, fmt=marker)
        j_data += 1
    elif datatype == 'dataULimit':
        ax.errorbar(data[:,0], data[:,1], yerr=0.2*np.abs(data[:,1]), uplims=True,
                    label=label, color=color, fmt=marker)
        j_data += 1
    else:
        ax.plot(data[:,0], data[:,1], label=label, color=color, linestyle=linestyle, lw=3)
        ax.fill_between(data[:,0], data[:,2], data[:,3], color=color, alpha=0.5)
        k_func += 1

ax.set_xlim(7, 13)
ax.set_ylim(-7, -0.5)
ax.text(0.95, 0.95, "z=%.2f" % z, horizontalalignment='right',
        verticalalignment='top', transform=ax.transAxes)
leg = ax.legend(loc='lower left')
leg.get_frame().set_alpha(0.5)
ax.set_xlabel(r"$\log_{10}[M_*/{\rm M_{\odot}}]$")
ax.set_ylabel(r"$\log_{10}[\rm \phi/Mpc^{-3} dex^{-1}]$")
plt.savefig('./GSMF.png', bbox_inches='tight')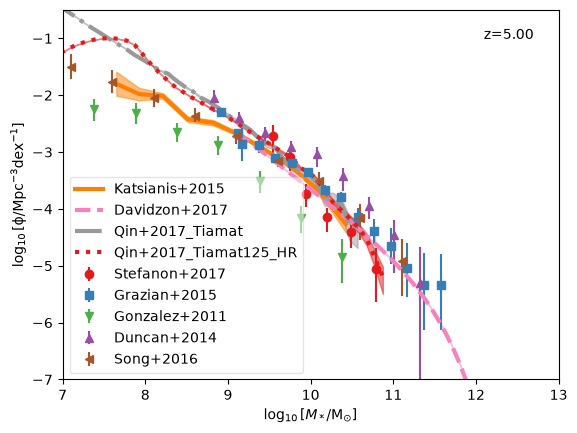
More examples can be found in this jupyter notebook. combine.ipynb shows how different datasets are combined into one empirical constraint (for GLF_UV, QLF_UV and GLF_OIII).
Documentation
https://astrodatapy.readthedocs.io, including a list of every dataset with its redshifts and reference.
Features
Number density
Features |
Descriptions |
x |
BHM |
Black Hole Mass |
redshift (y is the black hole mass) |
BHMF |
Black Hole Mass Function |
log10(M_BH/Msun) |
GLF_UV |
Galaxy Luminosity Function – UV |
M1600 or M1500 (AB) |
GLF_OIII |
Galaxy Luminosity Function – [OIII] 5008 |
log10(L[OIII]/erg s^-1) |
GSMF |
Galaxy Stellar Mass Function – all |
log10(M*/Msun) |
GSMF_Blue |
Galaxy Stellar Mass Function – blue |
log10(M*/Msun) |
GSMF_Bulge |
Galaxy Stellar Mass Function – bulge |
log10(M*/Msun) |
GSMF_Disk |
Galaxy Stellar Mass Function – disk |
log10(M*/Msun) |
GSMF_Quiescent |
Galaxy Stellar Mass Function – quiescent |
log10(M*/Msun) |
GSMF_Red |
Galaxy Stellar Mass Function – red |
log10(M*/Msun) |
QLF_bolometric |
Quasar Luminosity Function – bolometric |
log10(L_bol/Lsun) |
QLF_optical |
Quasar Luminosity Function – optical |
M_B |
QLF_UV |
Quasar Luminosity Function – UV |
M1450 or M1500 (AB) |
QLF_Xray |
Quasar Luminosity Function – X-ray |
log10(L_X/erg s^-1), rest 2-10 keV |
SFRF |
Star Formation Rate Function |
log10(SFR/Msun yr^-1) |
phi is per dex, or per magnitude when x is a magnitude.
Correlation
Features |
Descriptions |
Magorrian |
Black Hole - Galaxy Bulge Mass Scaling Relation |
Tully_Fisher |
Mass - Velocity of Spiral Galaxies |
DiskSize_StellarMass |
DiskSize - StellarMass |
GasFraction_StellarMass |
GasFraction - StellarMass |
sSFR_StellarMass_Blue |
sSFR - StellarMass – blue |
HaloMass_StellarMass |
HaloMass - StellarMass |
HaloMass_StellarMass_Blue |
HaloMass - StellarMass – blue |
HaloMass_StellarMass_Red |
HaloMass - StellarMass – red |
Clustering
Features |
Descriptions |
QC_2PTCF |
Quasar Clustering – 2 point correlation function |
Adding data
Each feature is a directory in astrodatapy/data with an info.txt that lists its datasets, and one file per redshift for each dataset. The data format describes these files, the units and the h conversions, and how to add a dataset. Pull requests with new data are welcome.
License
Free software: BSD license
This project is Copyright (c) Yuxiang Qin and licensed under the terms of the BSD 3-Clause license. See the licenses folder for more information.
Contributors
Yuxiang Qin (The Australian National University)
with contributions from Balu Sreedhar, Fatma Shaban, Varun Nikam, Madeline Marshall and Simon Mutch.
1 maintainer

Metadata
1 maintainer
Release files for astrodatapy 1.1.0
For a detailed explanation of source distributions (sdists) and built distributions (wheels), please see the package formats documentation.
Source distribution (sdist)
| File | Size | Uploaded | Provenance | Actions |
|---|---|---|---|---|
| astrodatapy-1.1.0.tar.gz | 13.4 MB | With provenance | Details for astrodatapy-1.1.0.tar.gz |
Built distribution (wheel)
| File | Interpreter | ABI | Platform | Actions Reset |
|---|---|---|---|---|
| astrodatapy-1.1.0-py3-none-any.whl | Python 3 | none | any | Details for astrodatapy-1.1.0-py3-none-any.whl |
Total release size: 22.7 MB
Release files / astrodatapy-1.1.0.tar.gz
| Download URL | astrodatapy-1.1.0.tar.gz |
|---|---|
| Size | 13.4 MB |
| Tags | Source |
|
SHA-256 checksum How to use checksums |
a999e9b0ad2226b80901e82edd2b550798408e86f824f747821638378fed3935
|
|
BLAKE2b-256 checksum How to use checksums |
b1cf1f5fe05f5967e54c88555c1e45358a74492042e4f3000687f12b7a42d160
|
| Upload date | |
|
Uploaded using Trusted Publishing? What is trusted publishing? |
Yes |
| Uploaded via |
twine/7.0.0 CPython/3.13.16
|
Provenance
Provenance describes where a file came from. On PyPI, provenance is shared via attestations, which provide a verifiable record of the build or publishing details. View details, limitations and caveats.


PyPI Publish Attestation
PyPI verified that this artifact, at this checksum, originated from the publisher listed below.
Signed by GitHub Actions, verified by PyPI on Nov 15, 2026.
Transparency logRelease files / astrodatapy-1.1.0-py3-none-any.whl
| Download URL | astrodatapy-1.1.0-py3-none-any.whl |
|---|---|
| Size | 9.3 MB |
| Tags | Python 3 |
|
SHA-256 checksum How to use checksums |
24045bb9f43e2e7ad0b1e8ed482e369ef1a2a0cc4169258e7dbbdba1603e4acc
|
|
BLAKE2b-256 checksum How to use checksums |
5755814f4c49880d9e7d3f042882401c83c32d32069d44ec8f35658a89ec9f48
|
| Upload date | |
|
Uploaded using Trusted Publishing? What is trusted publishing? |
Yes |
| Uploaded via |
twine/7.0.0 CPython/3.13.16
|
Provenance
Provenance describes where a file came from. On PyPI, provenance is shared via attestations, which provide a verifiable record of the build or publishing details. View details, limitations and caveats.
PyPI Publish Attestation
PyPI verified that this artifact, at this checksum, originated from the publisher listed below.
Signed by GitHub Actions, verified by PyPI on Nov 15, 2026.
Transparency logSecurity for astrodatapy 1.1.0
Provenance
Provenance describes where a file came from. On PyPI, provenance is shared via attestations, which provide a verifiable record of the build or publishing details. View details, limitations and caveats.
Full provenance
Both files in this release have been uploaded with provenance metadata.
Attestation for astrodatapy-1.1.0.tar.gz
PyPI Publish Attestation
PyPI verified that this artifact, at this checksum, originated from the publisher listed below.
Signed by GitHub Actions, verified by PyPI on Nov 15, 2026.
Transparency logA note on package security
PyPI is a repository for distributing packages, not a service for auditing them. While third-party security researchers and our staff do their best to detect and remove malicious packages, PyPI cannot guarantee the quality, security or suitability of any given package.
To learn more about protecting yourself from malicious actors, visit our package security documentation.














