Sankey diagrams simply
Verified details
These details have been verified by PyPIProject links
GitHub Statistics
Maintainers

Project description
ausankey
Uses matplotlib to create simple Sankey diagrams flowing only from left to right.


This package is available on PyPi and can be installed via:
pip install ausankey
User documentation for the repository is published via GitHub Pages: https://avc-adelaide.github.io/ausankey/
Code documentation by Mkdocs is available here: https://avc-adelaide.github.io/ausankey/reference/
Minimal example
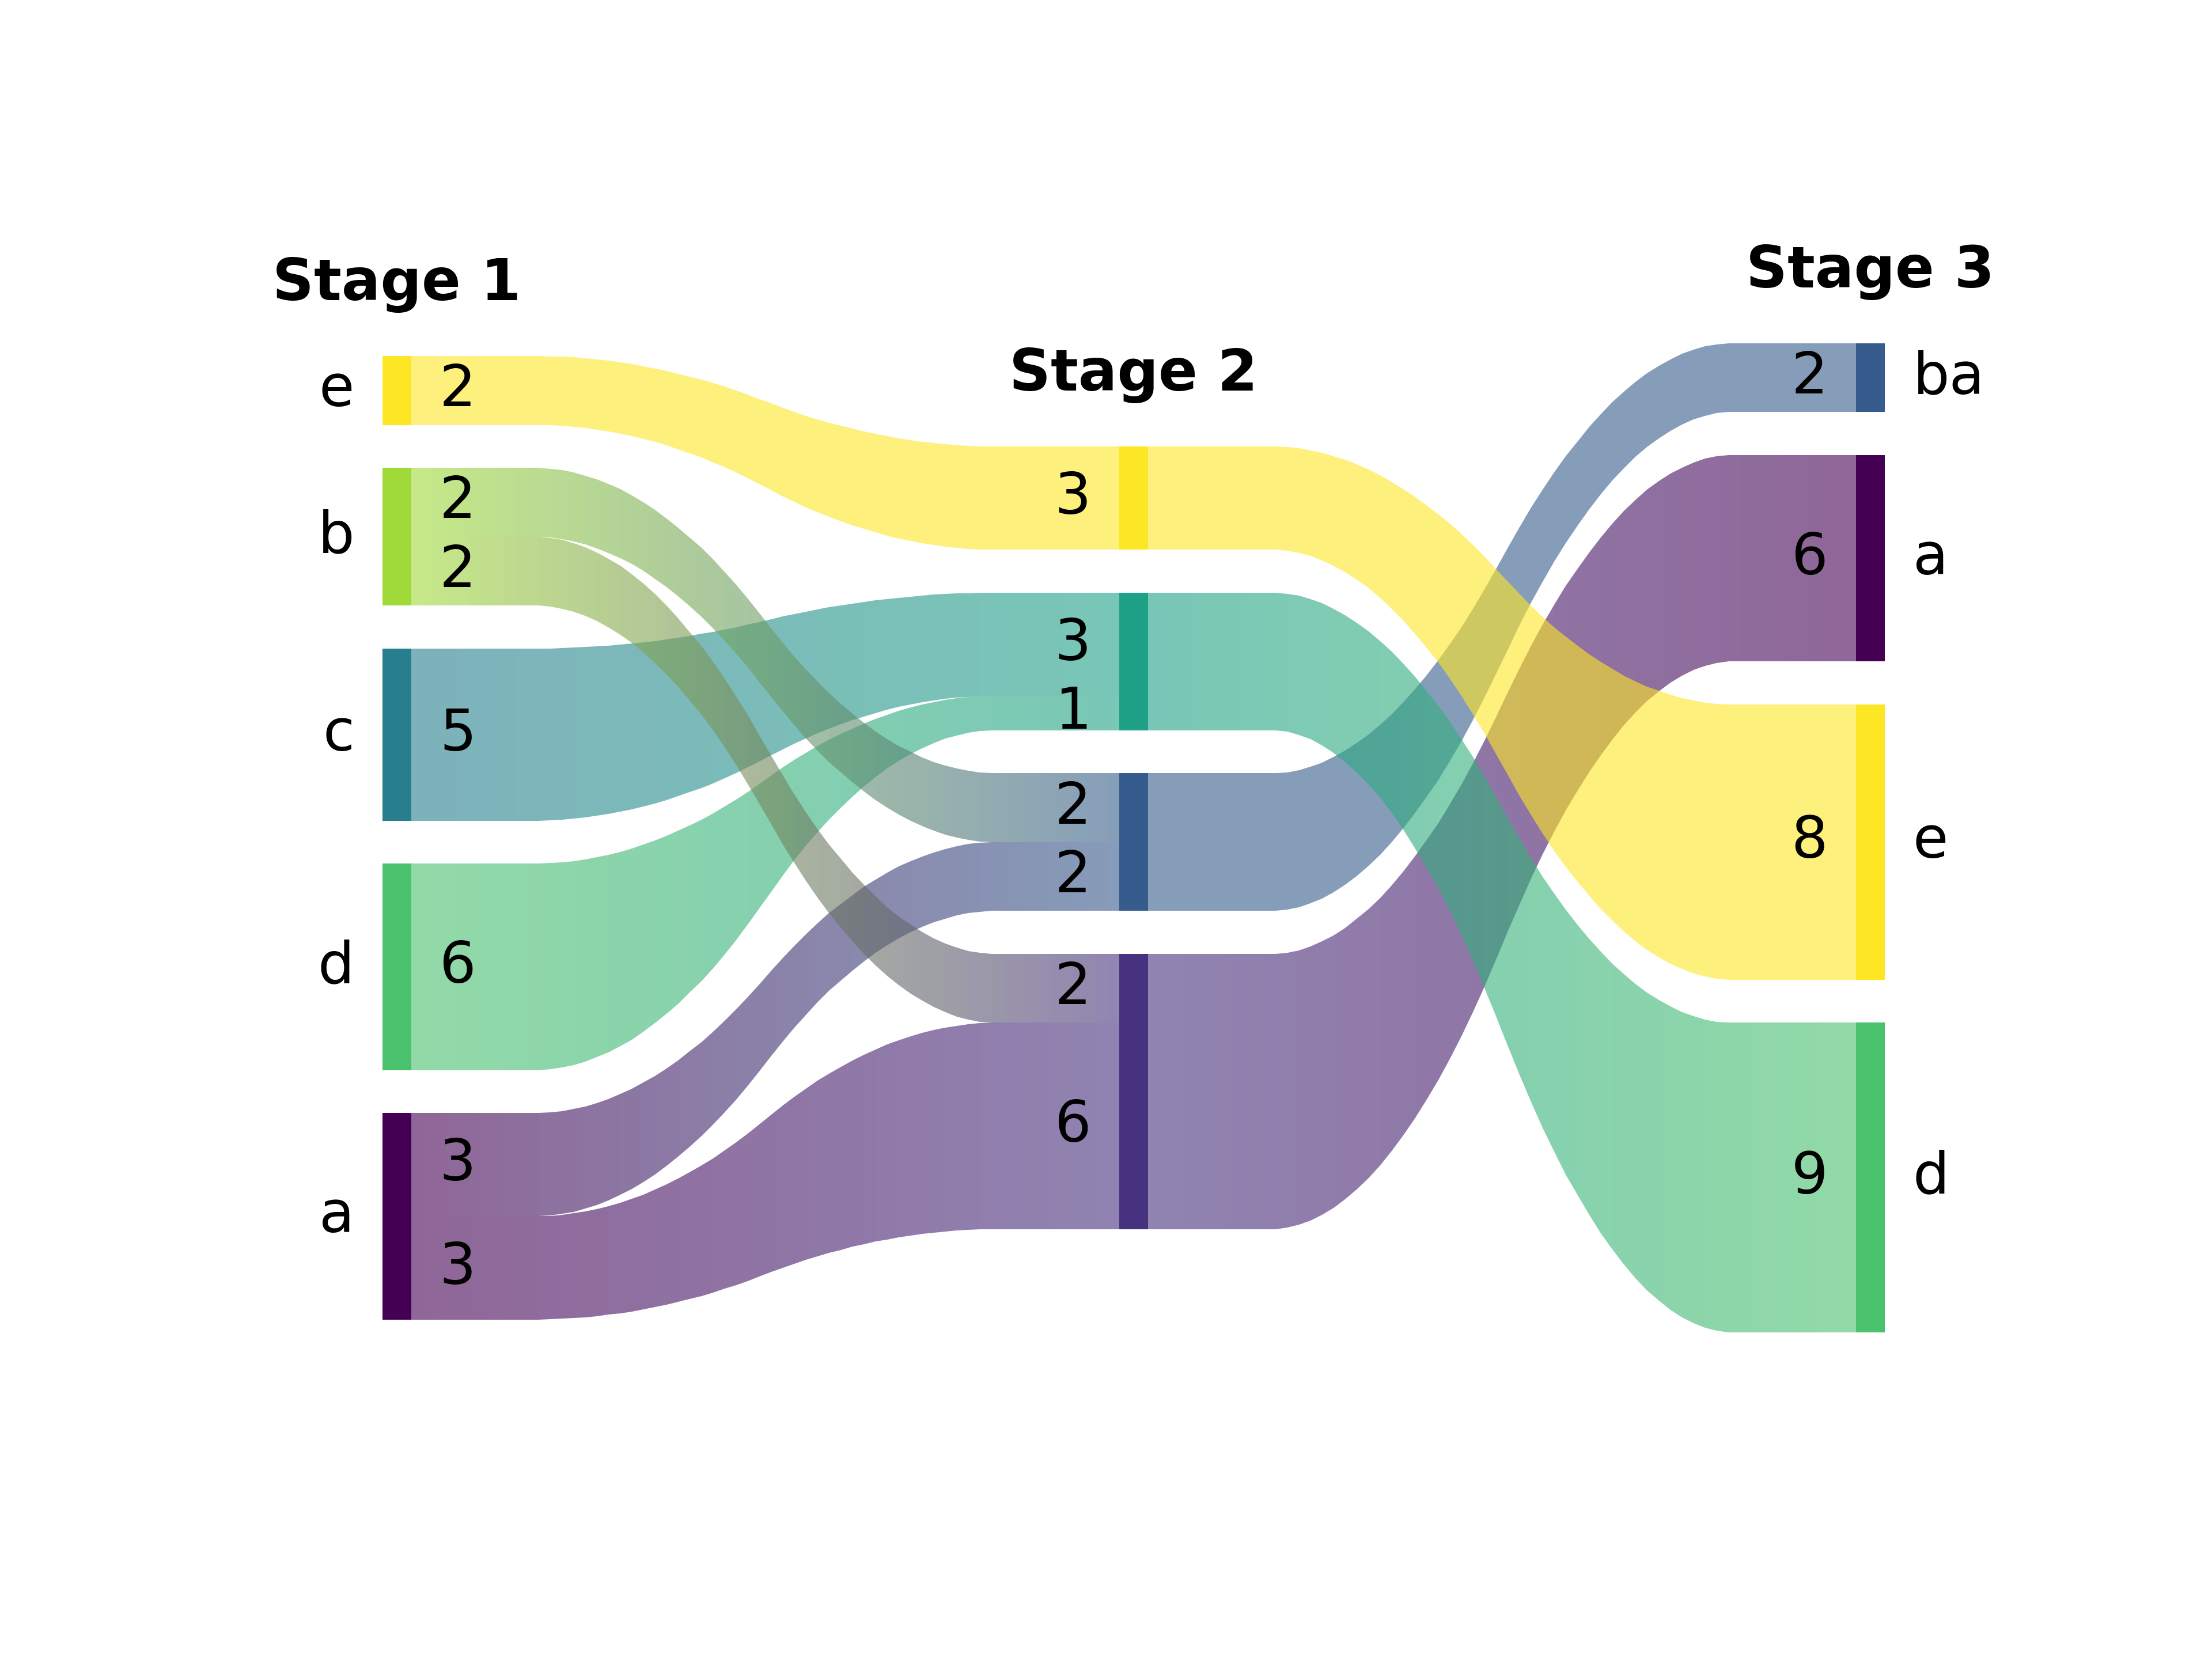
import ausankey as sky
import matplotlib.pyplot as plt
import pandas as pd

data = pd.DataFrame([
  ("a",1.0,"ab",2.0,"a",1.0),
  ("a",1.0,"ba",0.8,"ba",0.4),
  ("c",1.5,"cd",0.5,"d",2.0),
  ("b",0.5,"ba",0.8,"ba",0.4),
  ("b",0.5,"ab",0.8,"a",1.0),
  ("d",2.0,"cd",0.4,"d",1.0),
  ("e",1.0,"e",1.0,"e",3.0),
])

plt.figure()
sky.sankey(
  data,
  sort      = "top",
  titles    = ["Stage 1","Stage 2","Stage 3"],
  valign    = "center",
)
plt.show()
If you are a uv user, this will get you started:
cd ausankey-example && mkdir ausankey-example
uv init --bare
uv add ausankey
uv run ausankey-example.py
(with ausankey-example.py given above.)
Requirements
- Python 3.x
- matplotlib
- numpy
- pandas
Project details
Verified details
These details have been verified by PyPIProject links
GitHub Statistics
Maintainers
Release history Release notifications | RSS feed


Download files
Download the file for your platform. If you're not sure which to choose, learn more about installing packages.
Source Distribution
Built Distribution
Filter files by name, interpreter, ABI, and platform.
If you're not sure about the file name format, learn more about wheel file names.
Copy a direct link to the current filters
File details
Details for the file ausankey-1.9.tar.gz.
File metadata
- Download URL: ausankey-1.9.tar.gz
- Upload date:
- Size: 36.9 kB
- Tags: Source
- Uploaded using Trusted Publishing? Yes
- Uploaded via: twine/6.1.0 CPython/3.13.7
File hashes
| Algorithm | Hash digest | |
|---|---|---|
| SHA256 |
10da7124dcb407d3343dce669599769d069adb8b48edfb8c5e331308846cb1eb
|
|
| MD5 |
0091649dfe7067e639d15384c68efd24
|
|
| BLAKE2b-256 |
8b236e9992ade5599e6483628e20e61d2ae1b894a4a93811869d4e961253fd64
|
Provenance
The following attestation bundles were made for ausankey-1.9.tar.gz:
Publisher:
release.yml on avc-adelaide/ausankey
-
Statement:
-
Statement type:
https://in-toto.io/Statement/v1 -
Predicate type:
https://docs.pypi.org/attestations/publish/v1 -
Subject name:
ausankey-1.9.tar.gz -
Subject digest:
10da7124dcb407d3343dce669599769d069adb8b48edfb8c5e331308846cb1eb - Sigstore transparency entry: 820859086
- Sigstore integration time:
-
Permalink:
avc-adelaide/ausankey@f79b85d02910b8072c765988837711ca56954736 -
Branch / Tag:
refs/tags/v1.9 - Owner: https://github.com/avc-adelaide
-
Access:
public
-
Token Issuer:
https://token.actions.githubusercontent.com -
Runner Environment:
github-hosted -
Publication workflow:
release.yml@f79b85d02910b8072c765988837711ca56954736 -
Trigger Event:
push
-
Statement type:
File details
Details for the file ausankey-1.9-py3-none-any.whl.
File metadata
- Download URL: ausankey-1.9-py3-none-any.whl
- Upload date:
- Size: 36.4 kB
- Tags: Python 3
- Uploaded using Trusted Publishing? Yes
- Uploaded via: twine/6.1.0 CPython/3.13.7
File hashes
| Algorithm | Hash digest | |
|---|---|---|
| SHA256 |
184d76fa000f5c608a219a17612df5e38ce8d0d96c09a1881afb4bf86a3a9b50
|
|
| MD5 |
a8aa98bcd667a9078a4f2d8b26bd9b7d
|
|
| BLAKE2b-256 |
f6b275cfa31dbb89fa8e244be8a5894be3932d6139a5d67a9a4486e271473329
|
Provenance
The following attestation bundles were made for ausankey-1.9-py3-none-any.whl:
Publisher:
release.yml on avc-adelaide/ausankey
-
Statement:
-
Statement type:
https://in-toto.io/Statement/v1 -
Predicate type:
https://docs.pypi.org/attestations/publish/v1 -
Subject name:
ausankey-1.9-py3-none-any.whl -
Subject digest:
184d76fa000f5c608a219a17612df5e38ce8d0d96c09a1881afb4bf86a3a9b50 - Sigstore transparency entry: 820859096
- Sigstore integration time:
-
Permalink:
avc-adelaide/ausankey@f79b85d02910b8072c765988837711ca56954736 -
Branch / Tag:
refs/tags/v1.9 - Owner: https://github.com/avc-adelaide
-
Access:
public
-
Token Issuer:
https://token.actions.githubusercontent.com -
Runner Environment:
github-hosted -
Publication workflow:
release.yml@f79b85d02910b8072c765988837711ca56954736 -
Trigger Event:
push
-
Statement type:


