Automated EDA reports with quality scores, human-readable insights, and actionable recommendations

Project description
AutoEDA+
Automated Exploratory Data Analysis with quality scores, human-readable insights, and actionable preprocessing recommendations.


What is AutoEDA+?
AutoEDA+ is a Python library for exploring Pandas DataFrames and CSV files. It goes beyond raw statistics to provide:
- Dataset Quality Score (0-100) with weighted breakdown
- Per-Column Health Scores with specific checks and flags
- Human-readable insights (e.g., "Salary is heavily right-skewed")
- Actionable recommendations (e.g., "Impute Age using Median")
Installation
pip install autoeda-plus
Quick Start
import autoeda as ae
import pandas as pd

# Load your dataset
df = pd.read_csv("titanic.csv")

# Run the complete analysis pipeline
result = ae.analyze(df)

# View the overall quality score
print(result.quality.score)
Features Overview
1. Dataset Overview
Provides rows, columns, memory usage, missing cells, duplicate rows, and column type breakdown.
2. Dataset Quality Score
An overall health score from 0-100 computed from 5 weighted dimensions:
- Completeness (30%): Fraction of non-missing cells
- Duplicates (20%): Fraction of non-duplicate rows
- Outliers (20%): Inverse average outlier rate
- Consistency (15%): No mismatched data types
- Balance (15%): Category frequency balance
3. Column Health Score
Every column receives a score (0-100) with individual checks:
- Correct data type
- Missing value evaluation
- Outlier detection
- Cardinality checks
- Skewness detection
4. Human-Readable Insights
Transforms statistical metrics into accessible natural language.
Instead of: Skewness = 2.4
AutoEDA+ says: 'Salary' is highly right-skewed (skewness = 2.40). Most values are concentrated at the lower end with a long upper tail.
5. Smart Recommendations
Provides prioritized rule-based suggestions for data preprocessing.
[HIGH]   Investigate outliers in 'Income'
[MEDIUM] Impute 'Age' using Median
[MEDIUM] Convert 'JoinDate' to datetime
[LOW]    One-Hot Encode 'Gender'
6. Dataset Comparison (Train vs Test)
Compare two datasets to detect Data Drift and Schema Mismatches:
- Detects missing columns (e.g., target missing from test set).
- Calculates numeric distribution drift using the Kolmogorov-Smirnov (KS) test.
- Calculates categorical frequency shifts.
- Visualizes differences with overlaid histograms and grouped bar charts.
Complete Public API Reference
Below are all the available API methods. You can easily copy and paste these into your project.
import autoeda as ae

# Full Pipeline Analysis
result = ae.analyze(dataframe)

# Dataset Comparison (Train vs Test)
comp = ae.compare(train_dataframe, test_dataframe)

# Dataset Profiling & Quality
ae.overview(dataframe)
ae.quality(dataframe)
ae.column_health(dataframe)[column_name]

# Statistical DataFrames & Metrics
ae.missing(dataframe)
ae.duplicates(dataframe)
ae.dtypes(dataframe)
ae.statistics(dataframe)
ae.outliers(dataframe)
ae.correlation(dataframe)
ae.distribution(dataframe)

# Insights & Recommendations
ae.insights(dataframe)
ae.recommend(dataframe)

# Visualizations (Standard EDA Plots)
ae.histogram(dataframe, column_name)
ae.boxplot(dataframe, column_name)
ae.countplot(dataframe, column_name)
ae.heatmap(dataframe)
ae.missing_heatmap(dataframe)
ae.scatter(dataframe, x_column_name, y_column_name)

# Visualizations (Dataset Comparison Plots)
ae.compare_histogram(train_dataframe, test_dataframe, column_name)
ae.compare_countplot(train_dataframe, test_dataframe, column_name)
API Examples & Outputs
Dataset Profiling & Quality
ae.overview()
Returns a high-level summary profile of the dataset including shape and memory footprint.
In [1]: ae.overview(df)
Out[1]: DatasetProfile(n_rows=891, n_cols=12, memory='83.7 KB', ...)
ae.quality()
Calculates an overall 0-100 quality score based on completeness, duplicates, and outliers.
In [2]: ae.quality(df)
Out[2]: QualityResult(score=78.5, grade='C+', sub_scores=[...])
ae.column_health()
Returns specific health metrics (0-100 score) and flagged issues for a single column.
In [3]: ae.column_health(df)['Age']
Out[3]: ColumnHealth(score=80.0, missing_pct=19.87, outlier_pct=0.0)
Statistical DataFrames
ae.missing()
Generates a pandas DataFrame listing the exact count and percentage of missing values per column.
In [4]: ae.missing(df).head(2)
Out[4]:
       missing_count  missing_pct
Cabin            687        77.10
Age              177        19.87
ae.duplicates()
Evaluates the dataset for completely identical rows and returns the count and percentage.
In [5]: ae.duplicates(df)
Out[5]: {'count': 0, 'percentage': 0.0}
ae.dtypes()
Returns a pandas DataFrame of the pandas internal data types of each column.
In [6]: ae.dtypes(df).head(2)
Out[6]:
             type
PassengerId  int64
Survived     int64
ae.statistics()
Computes core descriptive statistics (mean, standard deviation, min, max) for all numeric columns.
In [7]: ae.statistics(df).head(2)
Out[7]:
             mean        std   min   max
PassengerId  446.00   257.35     1   891
Survived       0.38     0.48     0     1
ae.outliers()
Detects statistical outliers in numeric columns using the IQR method and returns their frequencies.
In [8]: ae.outliers(df).head(2)
Out[8]:
       outlier_count  outlier_pct
Fare             116        13.02
SibSp             46         5.16
ae.correlation()
Constructs a Pearson correlation matrix DataFrame mapping relationships between numeric variables.
In [9]: ae.correlation(df).iloc[:2, :2]
Out[9]:
             PassengerId  Survived
PassengerId     1.000000 -0.005007
Survived       -0.005007  1.000000
Insights & Recommendations
ae.insights()
Analyzes statistical anomalies and formulates human-readable text insights regarding the dataset.
In [10]: ae.insights(df)[0]
Out[10]: "Dataset has 891 rows and 12 columns."
ae.recommend()
Generates a prioritized list of actionable data cleaning steps (e.g. dropping columns, imputing values).
In [11]: ae.recommend(df)[0]
Out[11]: "[HIGH] Drop 'Cabin' due to excessive missing values (77.10%)."
Dataset Comparison (Data Drift)
ae.compare()
Cross-references two datasets to detect schema mismatches and distribution drift (Kolmogorov-Smirnov test).
In [12]: comp = ae.compare(train_df, test_df)
         print(comp.insights[0])
         print([c.column for c in comp.drifted_columns])
Out[12]:
Drift detected in 'Fare' (KS p-value = 0.0031).
['Fare', 'Age']
Visualizations
When called in a Jupyter Notebook, these visualization functions natively render interactive Plotly graph_objects.Figure charts.
Standard EDA Plots
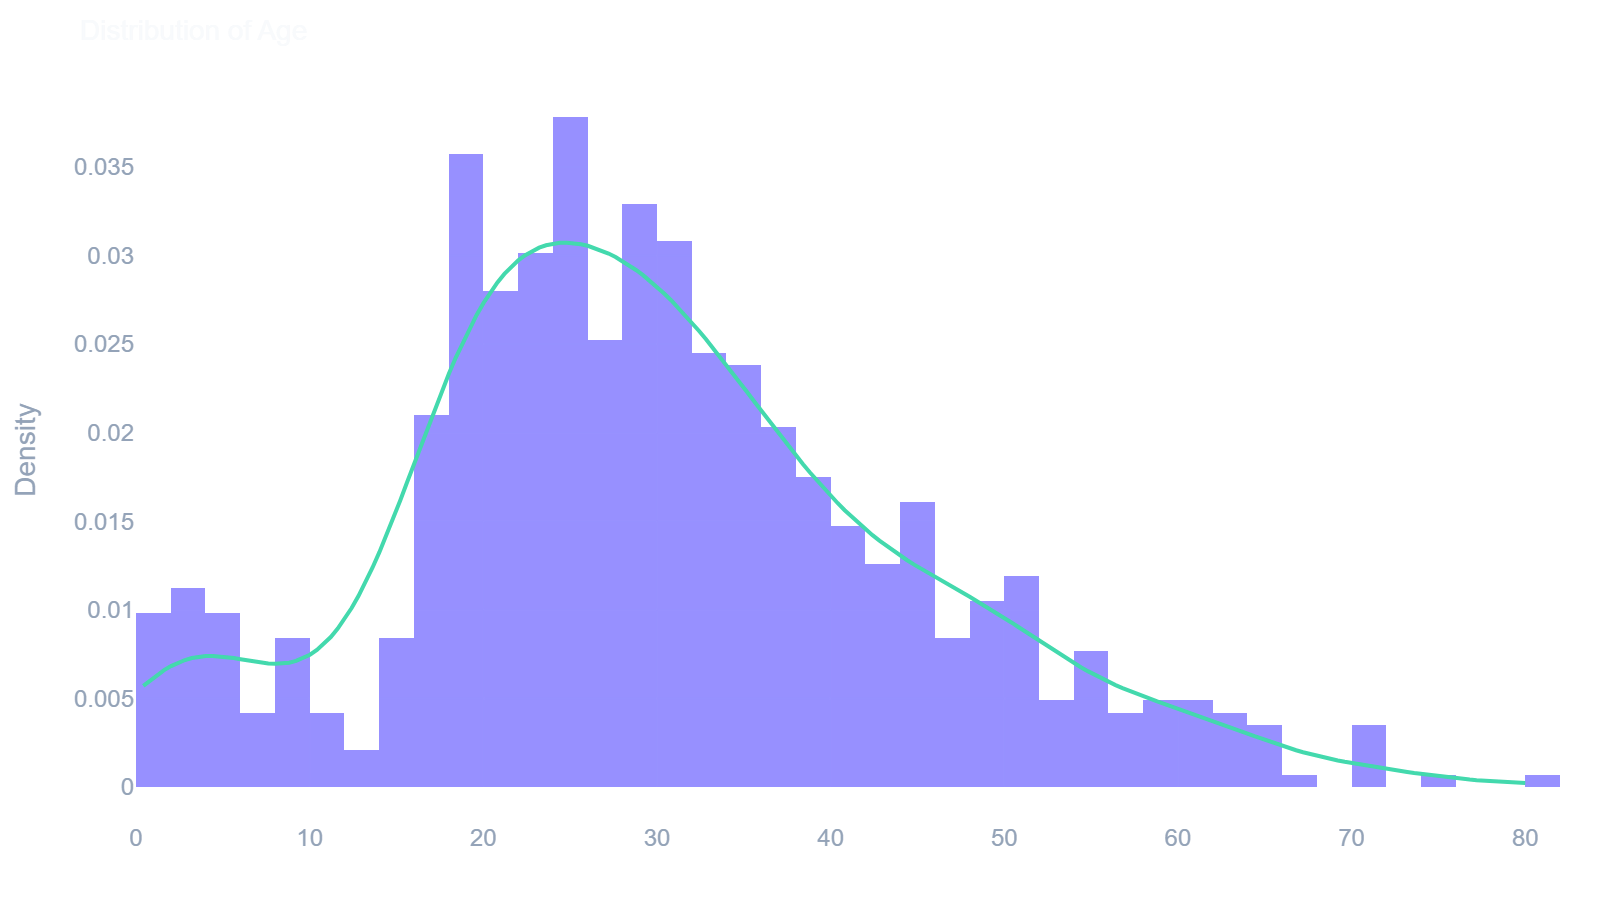
ae.histogram()
Displays the distribution of a numeric column with a Kernel Density Estimate (KDE) overlay.
In [13]: ae.histogram(df, 'Age')
Out[13]:
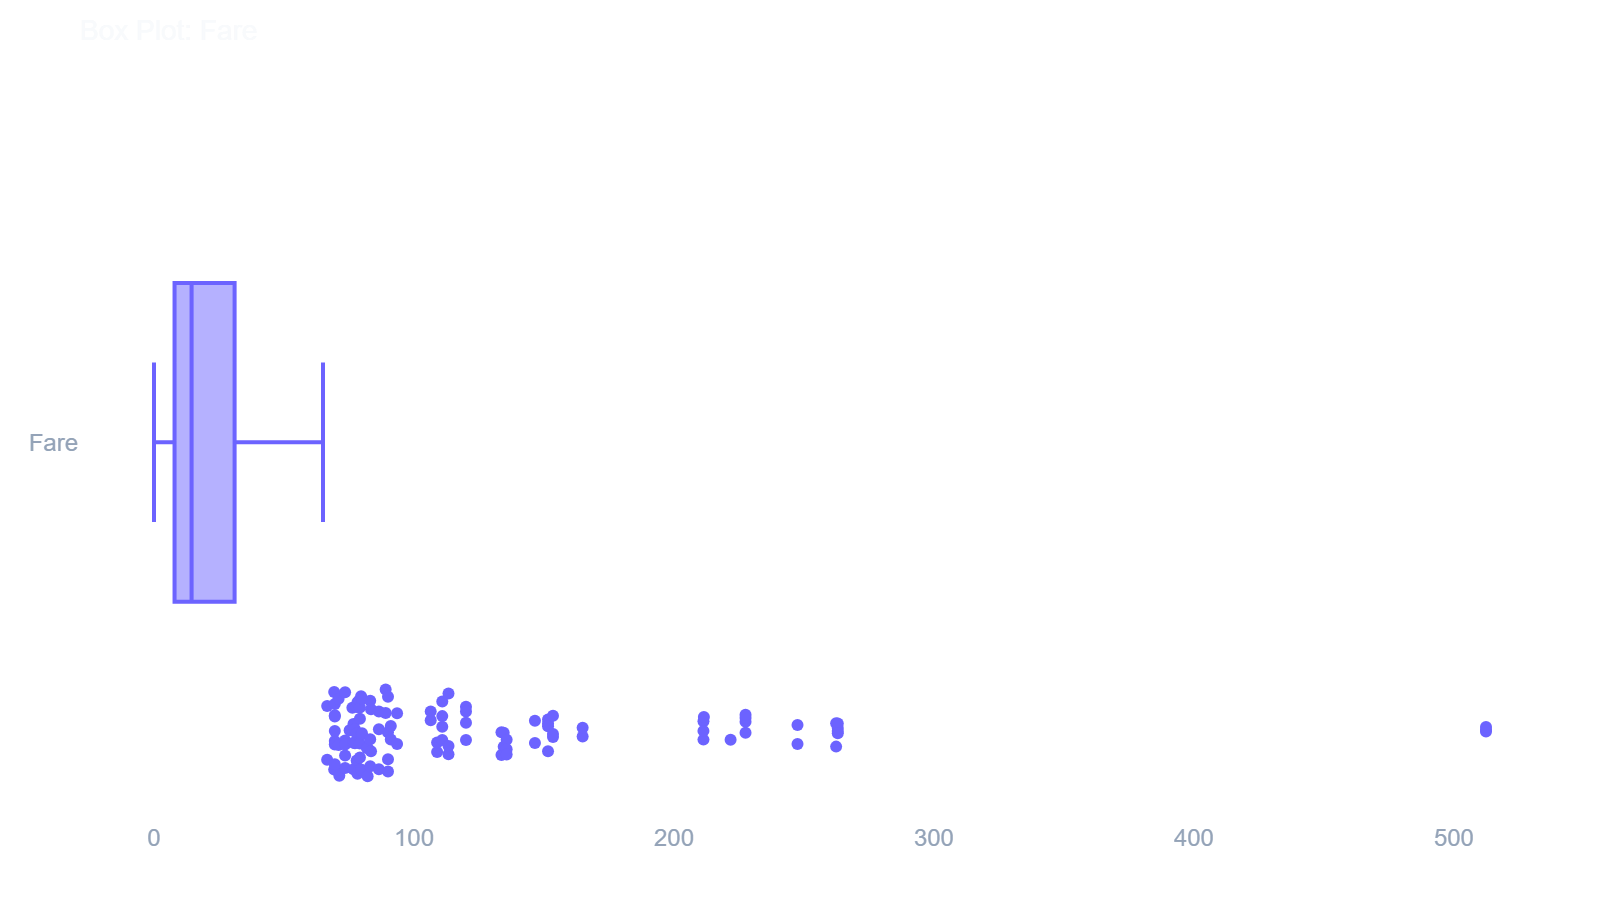
ae.boxplot()
Visualizes data dispersion and isolates statistical outliers for a specified numeric column.
In [14]: ae.boxplot(df, 'Fare')
Out[14]:
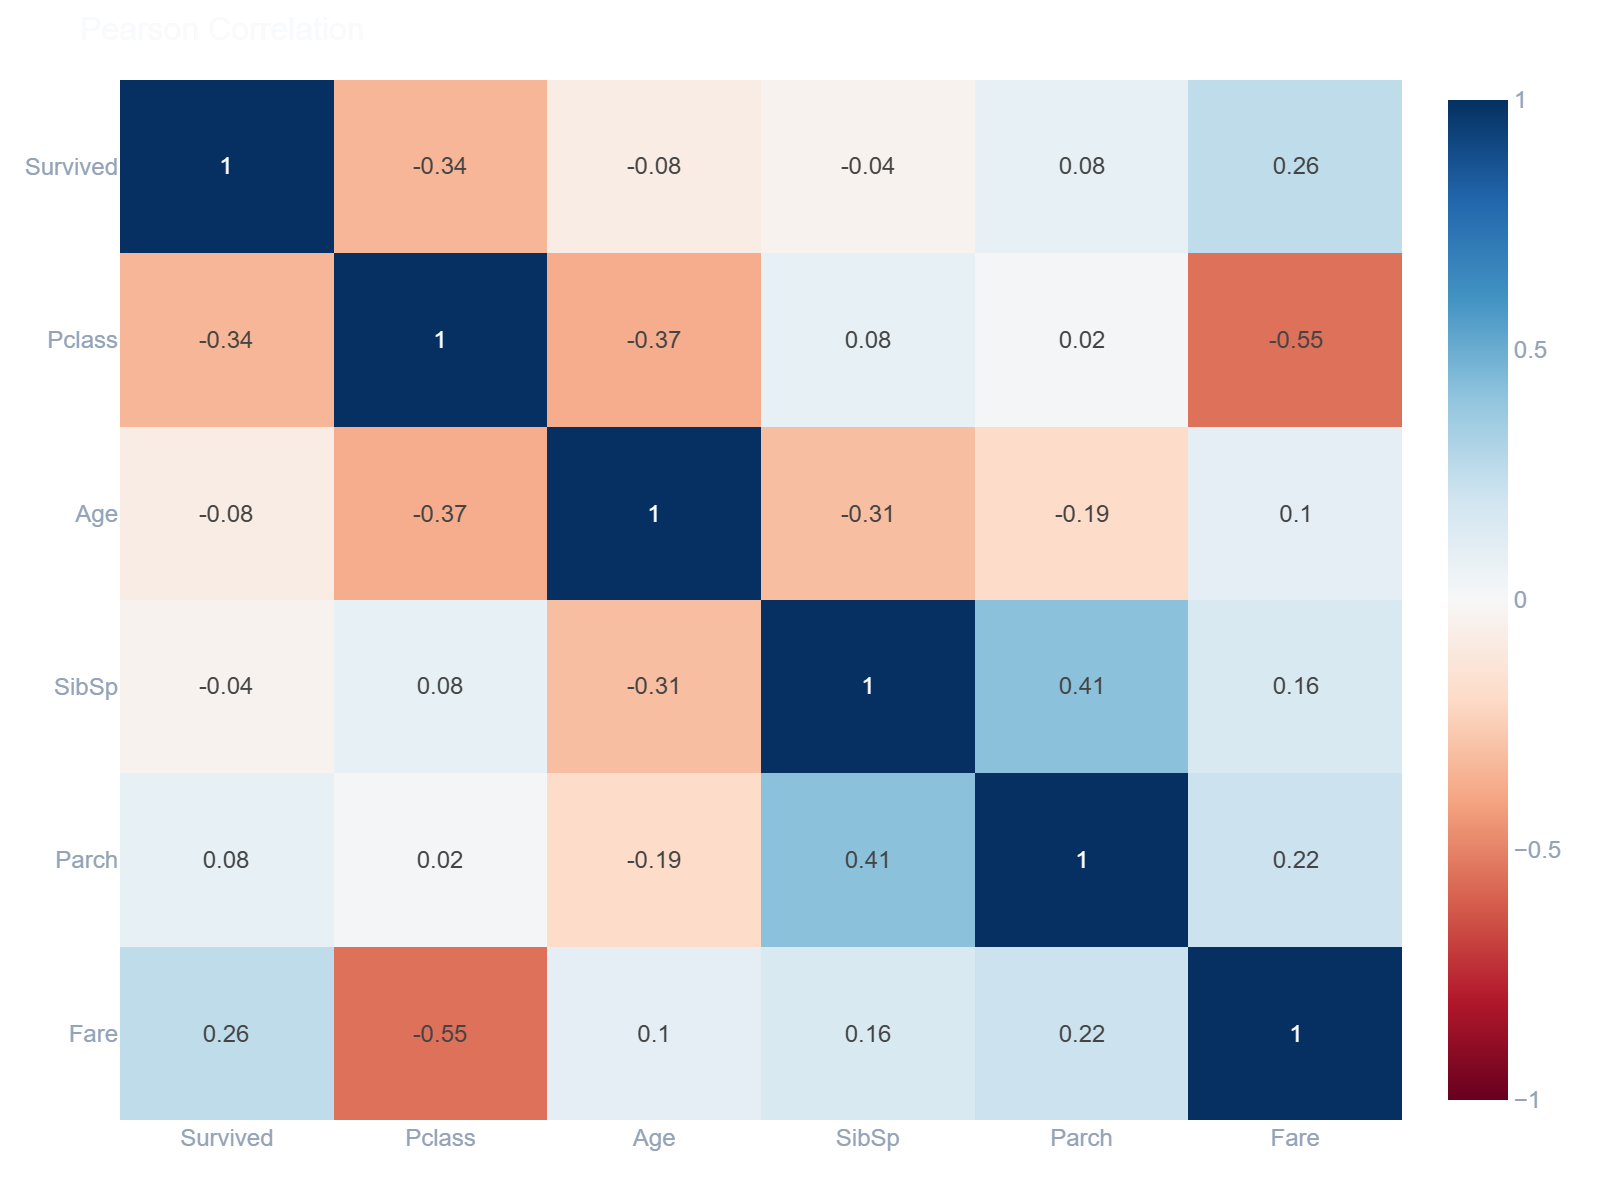
ae.heatmap()
Renders an interactive correlation matrix heatmap connecting all numeric variables.
In [15]: ae.heatmap(df)
Out[15]:
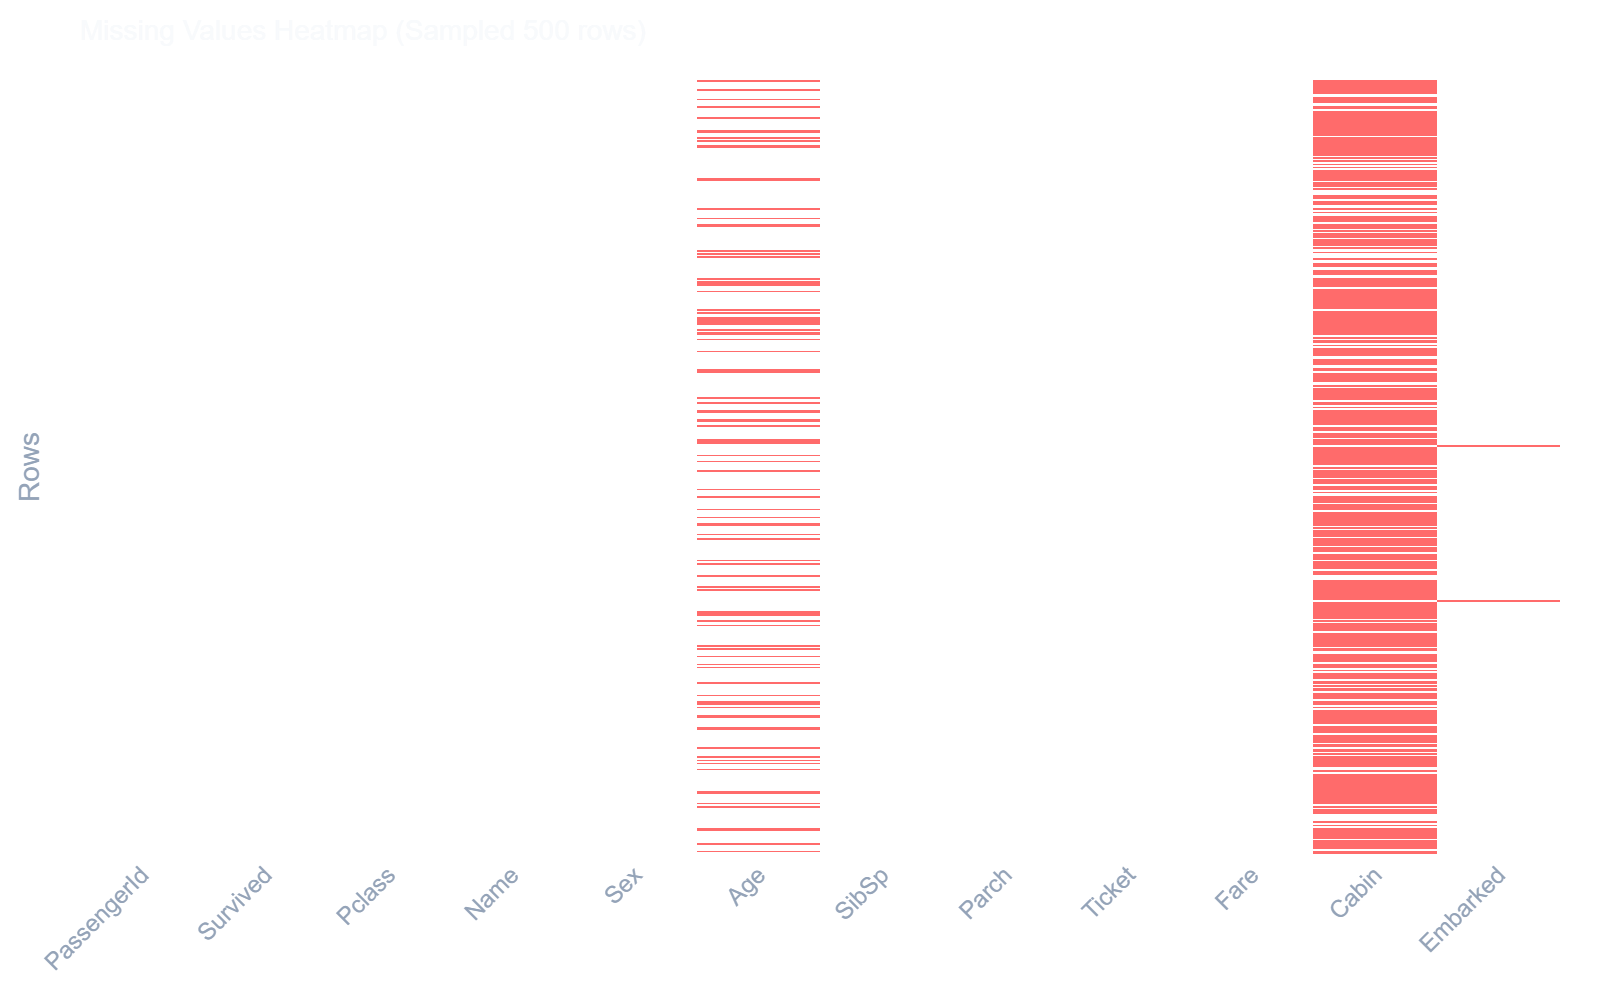
ae.missing_heatmap()
Generates a visual nullity matrix indicating precisely where missing values occur across rows.
In [16]: ae.missing_heatmap(df)
Out[16]:
Dataset Comparison Plots
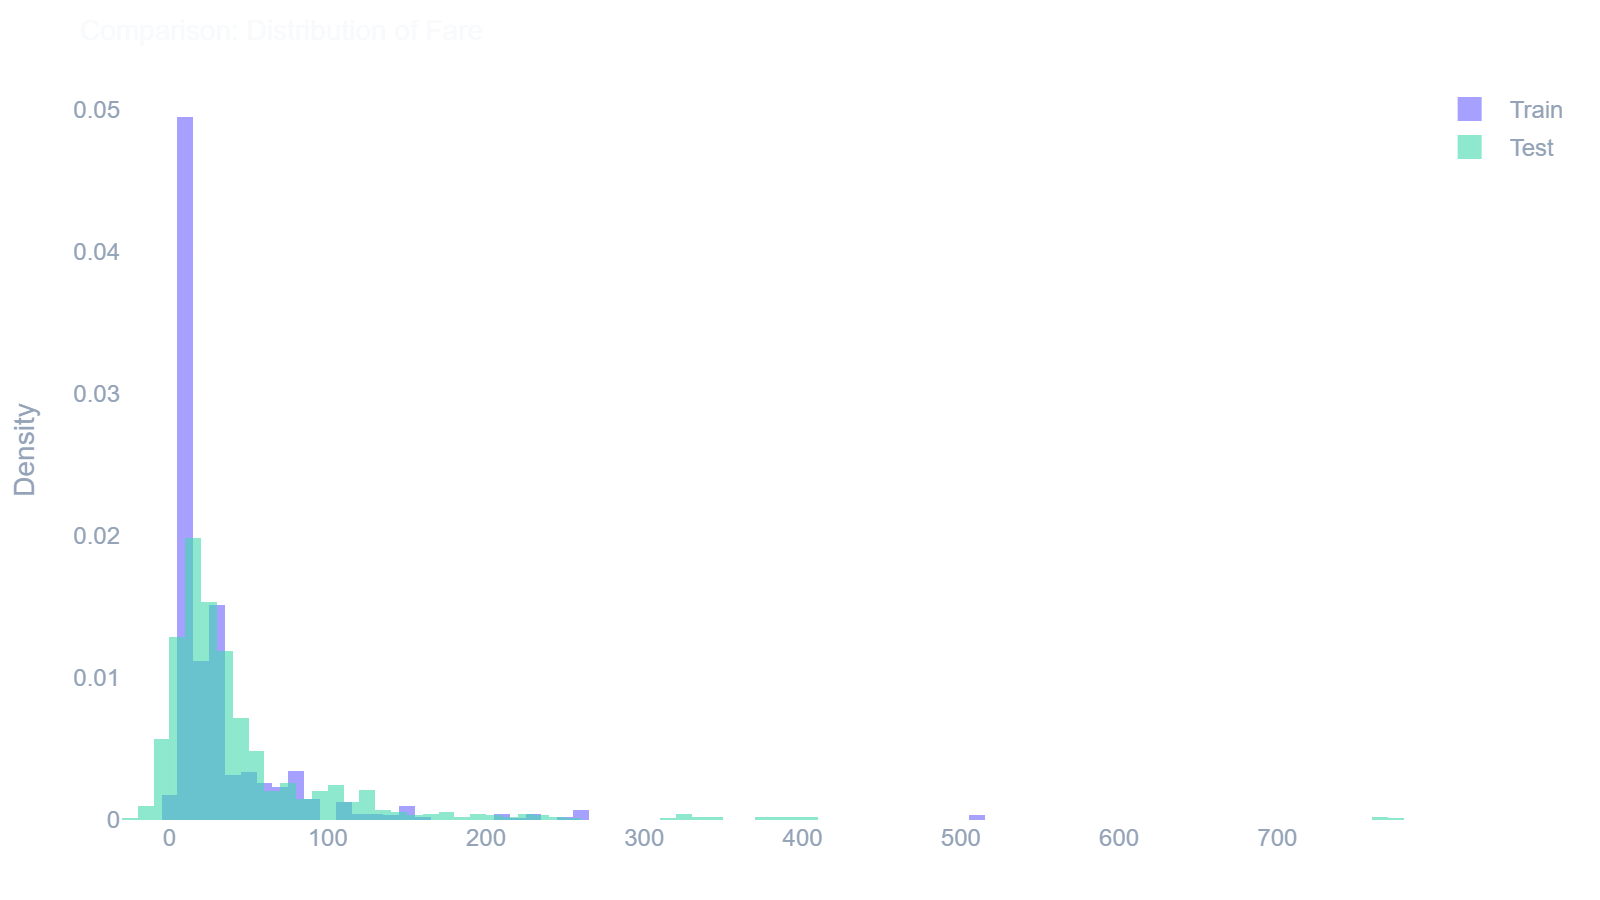
ae.compare_histogram()
Overlays two distributions to visually compare a numeric column between a training and testing set.
In [17]: ae.compare_histogram(train_df, test_df, 'Fare')
Out[17]:
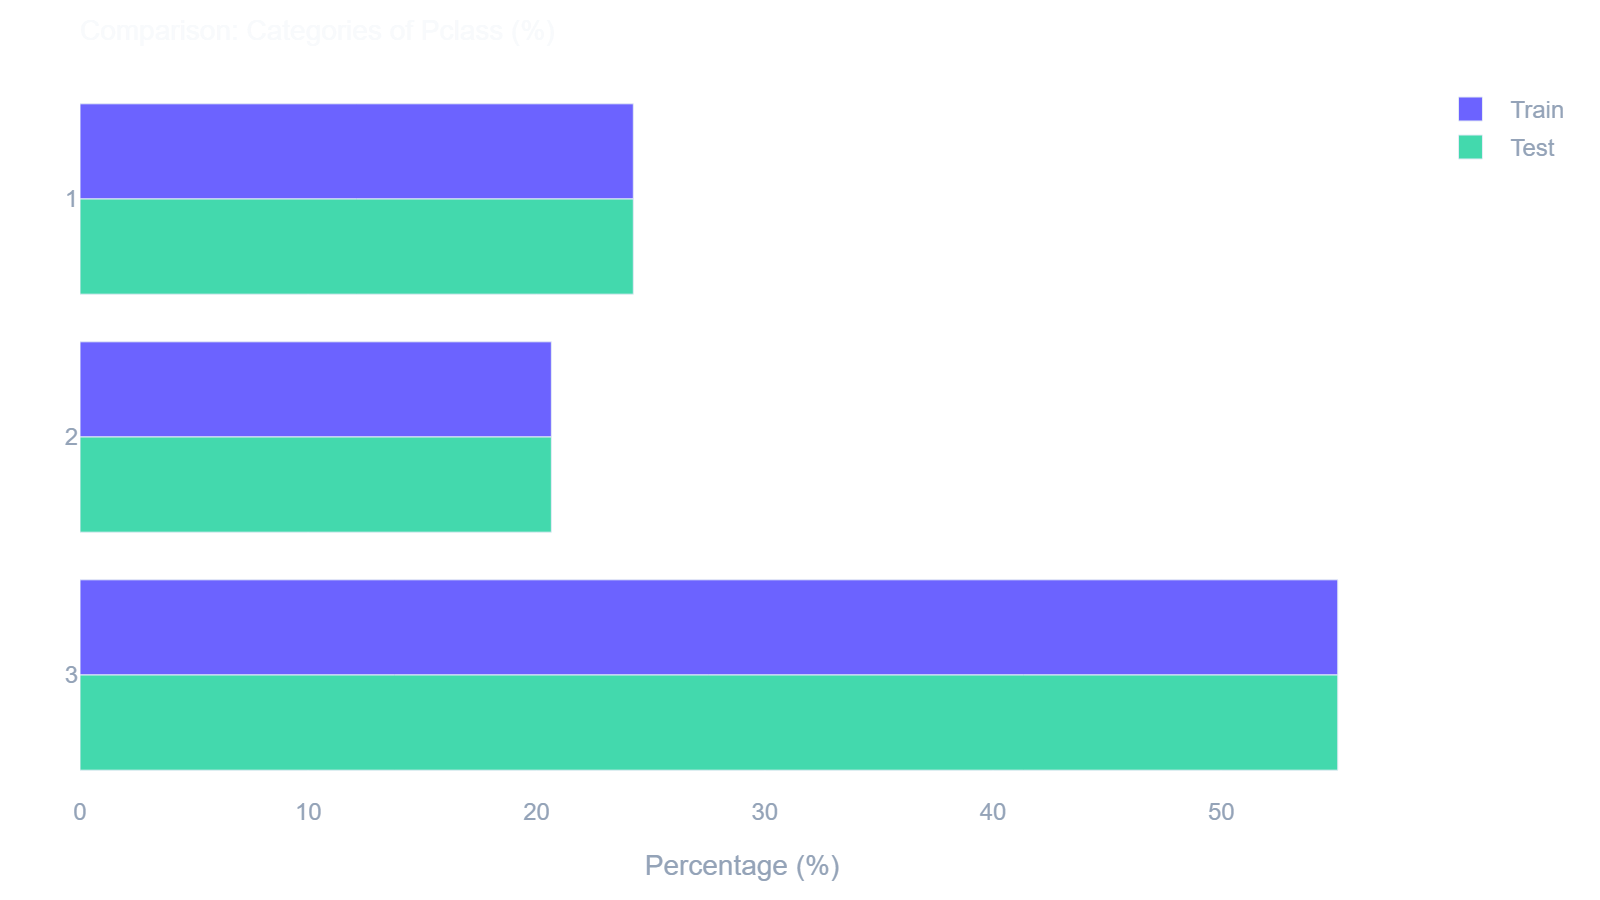
ae.compare_countplot()
Aligns categorical frequencies side-by-side to visually compare classifications across two datasets.
In [18]: ae.compare_countplot(train_df, test_df, 'Pclass')
Out[18]:
Dependencies
| Package | Version | Purpose |
|---|---|---|
| pandas | ≥ 1.3 | DataFrame operations |
| numpy | ≥ 1.21 | Numerical computations |
| scipy | ≥ 1.7 | KDE, skewness, kurtosis |
| plotly | ≥ 5.0 | Interactive Visualizations |
License
MIT License — see LICENSE.
Release history Release notifications | RSS feed

Download files
Download the file for your platform. If you're not sure which to choose, learn more about installing packages.
Source Distribution
Built Distribution
Filter files by name, interpreter, ABI, and platform.
If you're not sure about the file name format, learn more about wheel file names.
Copy a direct link to the current filters
File details
Details for the file autoeda_plus-1.0.0.tar.gz.
File metadata
- Download URL: autoeda_plus-1.0.0.tar.gz
- Upload date:
- Size: 22.9 kB
- Tags: Source
- Uploaded using Trusted Publishing? No
- Uploaded via: twine/6.2.0 CPython/3.11.0
File hashes
| Algorithm | Hash digest | |
|---|---|---|
| SHA256 |
d98ae3626a3412fc8f3d2ecab6d692b5a41f463d3b0cb4891f5bc127af62ccc5
|
|
| MD5 |
d9936390bddb9dbd98aef5043b013e9e
|
|
| BLAKE2b-256 |
95db83b68b83a74354d5a1c174f4ffc437ffd5dfc8e3f7ef39347c657b120b57
|
File details
Details for the file autoeda_plus-1.0.0-py3-none-any.whl.
File metadata
- Download URL: autoeda_plus-1.0.0-py3-none-any.whl
- Upload date:
- Size: 27.9 kB
- Tags: Python 3
- Uploaded using Trusted Publishing? No
- Uploaded via: twine/6.2.0 CPython/3.11.0
File hashes
| Algorithm | Hash digest | |
|---|---|---|
| SHA256 |
570ee81a015b67d47c33ab6c991f985dd4b49ce3f92ba3e24edab3b5c9877caa
|
|
| MD5 |
b447c243fdd9bb695ed08de511fe24b9
|
|
| BLAKE2b-256 |
3d503459f7cffd182e3559b92f5799f1da4a9c3b3f7c4f45dd697e60847a6148
|


