






Independent cartography in Python, with a familiar plotting API.
Build maps from geographic data, compose scientific figures, and explore them in an interactive viewer. Azimlib owns its geometry, projections, coordinate transformations, map layers, layout and rendering. Matplotlib and other GIS engines are not runtime dependencies.
Getting started · API reference · Examples · Compatibility
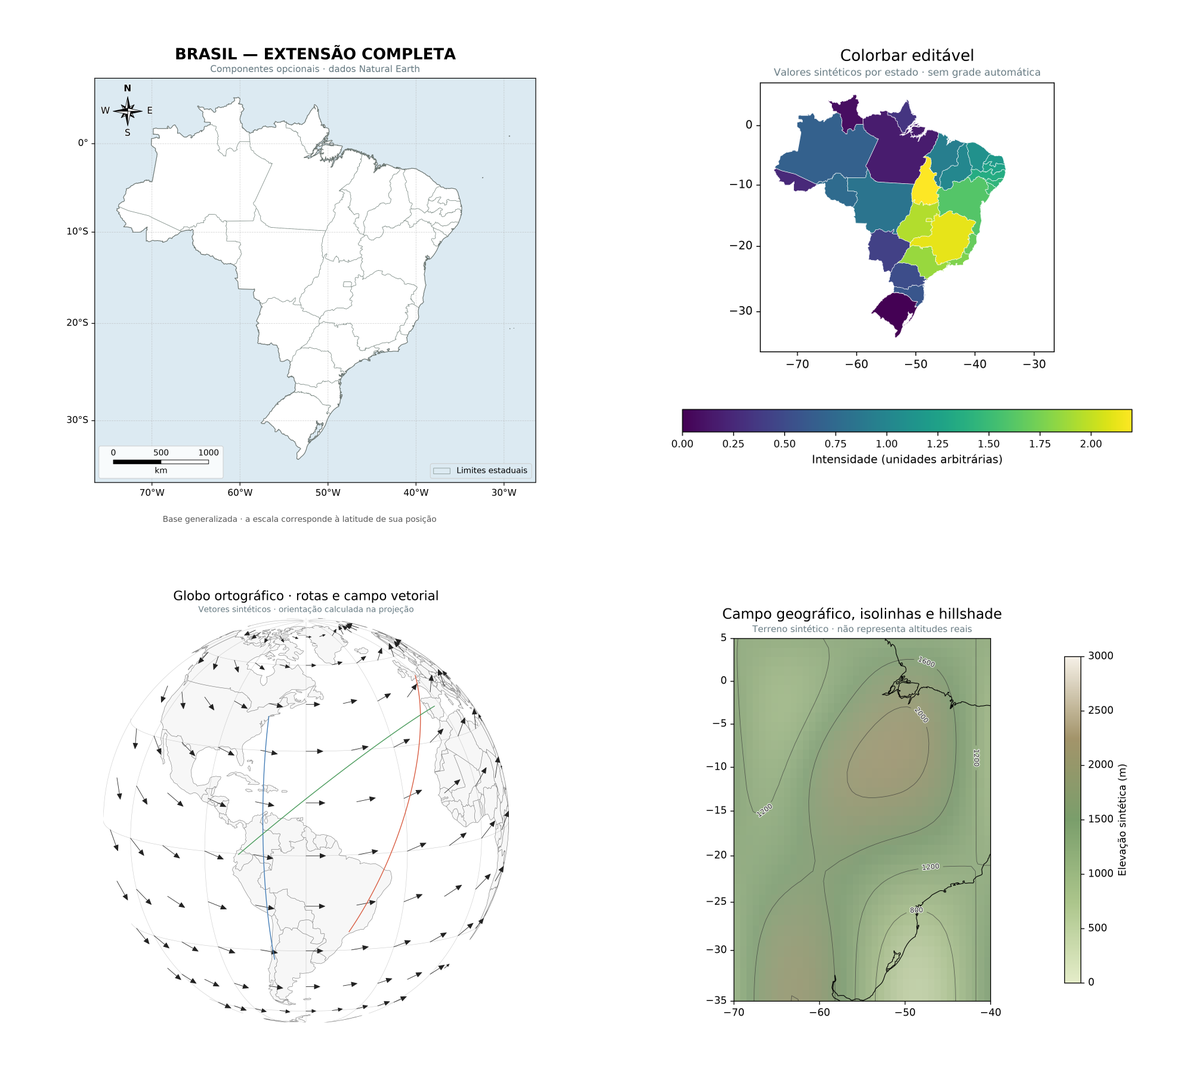
The examples above use Azimlib's own renderer. Boundaries and rivers are from Natural Earth; thematic values, terrain and vectors are synthetic. See the reproducible showcase.
Install
Requires Python 3.10 or newer. Azimlib is available on PyPI. Choose the output you need:
python -m pip install azimlib           # SVG and portable HTML; no dependencies
python -m pip install "azimlib[png]"    # PNG export
python -m pip install "azimlib[gui]"    # Interactive desktop viewer + PNG
For development, install directly from the source:
git clone https://github.com/Kernerian/azimlib.git
cd azimlib
python -m pip install ".[gui]"
The desktop viewer requires Tk, normally included with official Windows and
macOS Python installations; on Linux it may need an operating-system package.
Pillow, aggdraw and NumPy provide low-level raster support. Optional
azimlib[accelerate] uses NumPy/Numba to compile Azimlib's own coverage kernel.
No external cartography library is required for any of these installations.
Your first map
Both import styles expose the familiar figure/axes workflow:
import azimlib as azl
# Or: import azimlib.pyplot as plt

fig, ax = azl.subplots(figsize=(8, 9), projection="mercator")
ax.map("brazil", facecolor="white", edgecolor="black", linewidth=0.8)
ax.states(edgecolor="#777777", linewidth=0.4)
ax.rivers(color="#237f96", linewidth=0.8, label="Rivers")
ax.scatter(
    lon=[-46.63, -43.17], lat=[-23.55, -22.90],
    s=[40, 60], c="#c34968", label="Cities",
)
ax.set_title("Brazil")
ax.set_xlabel("Longitude")
ax.set_ylabel("Latitude")
ax.legend()
ax.scale_bar()
ax.north_arrow()

fig.savefig("brazil.svg")        # Static export; no viewer controls
fig.savefig("brazil.png", dpi=200)
azl.show()                       # Interactive desktop viewer
Longitude and latitude are geographic coordinates. Use
subplot_kw={"projection": "mercator"} if you prefer the Matplotlib-style
subplot configuration. A GeoJSON path, dictionary or feature collection can be
added with ax.geojson(data).
savefig() writes a static PNG or SVG. show() opens the independent desktop
canvas with Home, Back, Forward, Pan, Zoom, Subplots, Save and cursor
coordinates. A separate portable HTML viewer is available with
fig.show(backend="browser", path="map.html"); it navigates an exported scene,
without a live Python connection.
For the recommended plain light figure, see clean view and clean_map.py. Azimlib 0.3 adds opt-in map rotation and composition contracts.
Add only the components you need
Grid, legend, colorbar, scale bar, north arrow, compass and overview map are optional. There is no default minimap or grid. North arrow and compass are separate components, and a legend has a title only when you provide one.
ax.grid(linestyle="--", linewidth=0.5)
scale = ax.scale_bar()
scale.set_visible(False)
scale.set_visible(True)
ax.compass()
ax.overview(context="brazil")
fig.canvas.draw_idle()
Artists expose editing, visibility and removal controls. You can set limits, change styles, edit labels and update scalar data while retaining the same figure. See components and Artist editing.
Thematic and scientific maps
import azimlib.pyplot as plt
from azimlib import datasets

data = datasets.load("states", country="brazil")
values = list(range(len(data["features"])))  # Synthetic example values

fig, ax = plt.subplots(projection="mercator")
layer = ax.choropleth(data, values, cmap="viridis", bins=None)
bar = fig.colorbar(layer, ax=ax, orientation="horizontal", label="Example value")
ax.set_title("Values by state")
layer.set_clim(0, 30)
bar.set_label("Updated example value")
fig.savefig("thematic.svg")
| Build | With |
|---|---|
| Political and regional maps | Countries, states, boundaries, ax.state("SP") |
| Physical and hydrographic maps | Coastlines, rivers, lakes, geographic labels |
| Choropleths and categories | Feature styles, colormaps, norms, editable colorbars |
| Points and proportional bubbles | Scatter, markers, symbols, values mapped to size/color |
| Routes and vector fields | Styled lines, arrows, spherical routes, quiver |
| Density and scalar fields | Heatmaps, raster fields, isolines, hillshade |
| Atlases and regional focus | Subplots, GridSpec, mosaics, shared axes, insets/overviews |
Lines support widths, opacity, dashes, caps, joins and arrows; polygons support per-feature styling and hatches. Text offers alignment, rotation, backgrounds and halos. Layout includes tight/constrained modes, physical sizing and editable ticks. Colorbars support horizontal/vertical placement, ticks, labels and norms.
The spherical projection implementations include equirectangular, Mercator, orthographic, Lambert conformal conic, Albers equal area and Equal Earth. An orthographic globe is a 2D projection, not a 3D terrain engine.
Learn more
- Tutorial and Matplotlib → Azimlib guide
- API reference
- Maps and components gallery
- Coordinate systems and datasets
- Architecture
- Roadmap and remaining work
- Changelog
- Verified 0.2.0 publication
Azimlib is an early independent cartography library, not a complete replacement for every Matplotlib API. Read the compatibility boundaries before migrating. Detailed views can still require expensive rasterization. Automated CI covers Windows, Linux and macOS. The recorded human visual acceptance also covers Linux/macOS native artifacts; screenshots do not establish physical mouse latency.
Documentation and validation
Development documentation · Migration guide · Integrated gallery · API stability
The 80-item checklist records implementation, validation and release acceptance separately. See the urban guide for cities, neighbourhoods, streets and buildings.
Contribute and get help
Report bugs or ask questions through GitHub Issues. Include a minimal example, Python/Azimlib versions and the relevant output format. See the contribution guide for local tests, data provenance and independent implementation requirements. Please follow the code of conduct. Use the security policy for sensitive vulnerability reports.
License and provenance
Original code and visual compositions: BSD 3-Clause, copyright 2026 Kernerian. Bundled geographic data, fonts and palettes retain their own terms: Natural Earth is public domain; DejaVu fonts retain their license; Viridis, Plasma, Inferno and Magma tables are CC0; Blues retains ColorBrewer terms. The default AZIM10 color sequence is independently selected.
This product includes color specifications and designs developed by Cynthia Brewer (http://colorbrewer.org/).
See LICENSE, third-party notices and branding assets. The familiar API and navigation are implemented independently; Matplotlib artwork and source code are not distributed as Azimlib's implementation.
Azimlib 0.3 capabilities
Azimlib 0.3 adds independent SHP/SHX/DBF, KML, local OSM XML and scalar georeferenced raster/GeoTIFF readers. See formats and limits and versioned optional data. The real urban OSM example keeps its database license separate and is never downloaded implicitly.
Geodesy, UTM and crossing viewports use own implementations with explicit numerical limits. Visual finishing includes curved labels, limited equations, provenance-aware symbols/patterns and own vector PDF; see the original gallery.
Interaction includes optional picking, widgets, local live viewers, Qt and notebook updates. Experimental own 3D terrain and building extrusion document metric units, camera/depth rendering, export policy and performance limits. Temporal maps and regional atlas have finite sources, explicit writers and bounded playback.
Read the 0.3.0 release notes, migration guide, API policy and release checklist. The hosted development documentation retains the version metadata of its recorded snapshots. Published versions are listed on PyPI.
1 maintainer

Metadata
1 maintainer
Release files for azimlib 0.3.0
For a detailed explanation of source distributions (sdists) and built distributions (wheels), please see the package formats documentation.
Source distribution (sdist)
| File | Size | Uploaded | |
|---|---|---|---|
| azimlib-0.3.0.tar.gz | 22.7 MB | Details |
Built distribution (wheel)
| File | Interpreter | ABI | Platform | Reset |
|---|---|---|---|---|
| azimlib-0.3.0-py3-none-any.whl | Python 3 | none | any | Details |
Total release size: 26.0 MB
Release files / azimlib-0.3.0.tar.gz
| Download URL | azimlib-0.3.0.tar.gz |
|---|---|
| Size | 22.7 MB |
| Tags | Source |
|
SHA-256 checksum How to use checksums |
d334df9a9602f3612279663ee3a6659aaaa01631fc4c052c8a8e49aa4b578af4
|
|
BLAKE2b-256 checksum How to use checksums |
a7558246ff8b4fcce4d9d03ca819d4368c7d96584488e96c1b76f32b644f66f8
|
| Upload date | |
|
Uploaded using Trusted Publishing? What is trusted publishing? |
Yes |
| Uploaded via |
twine/7.0.0 CPython/3.13.14
|
Provenance
Provenance describes where a file came from. On PyPI, provenance is shared via attestations, which provide a verifiable record of the build or publishing details. View details, limitations and caveats.


PyPI Publish Attestation
PyPI verified that this artifact, at this checksum, originated from the publisher listed below.
Signed by GitHub Actions, verified by PyPI on Oct 8, 2026.
Transparency logRelease files / azimlib-0.3.0-py3-none-any.whl
| Download URL | azimlib-0.3.0-py3-none-any.whl |
|---|---|
| Size | 3.3 MB |
| Tags | Python 3 |
|
SHA-256 checksum How to use checksums |
83b78a6d953cc1cfecce8b3485631d1792fe3d66e33e9674211761ee256a04cf
|
|
BLAKE2b-256 checksum How to use checksums |
739bad3d1776118a0ae1124165ae67479c65ef08fef4af2c92a1fb8110fceb67
|
| Upload date | |
|
Uploaded using Trusted Publishing? What is trusted publishing? |
Yes |
| Uploaded via |
twine/7.0.0 CPython/3.13.14
|
Provenance
Provenance describes where a file came from. On PyPI, provenance is shared via attestations, which provide a verifiable record of the build or publishing details. View details, limitations and caveats.
PyPI Publish Attestation
PyPI verified that this artifact, at this checksum, originated from the publisher listed below.
Signed by GitHub Actions, verified by PyPI on Oct 8, 2026.
Transparency log













