Azure Debugging Relay: distributed cross-network remote debugging for Python


Project description
Azure Debugging Relay for Python
Azure Debugging Relay is a Visual Studio Code extension and a Python package for distributed remote debugging. It solves a problem of debugging code running in the cloud and on remote devices, simultaneously across multiple nodes and between different networks.
- Azure Debugging Relay extension on Visual Studio Marketplace
- azure-debug-relay package on PyPI
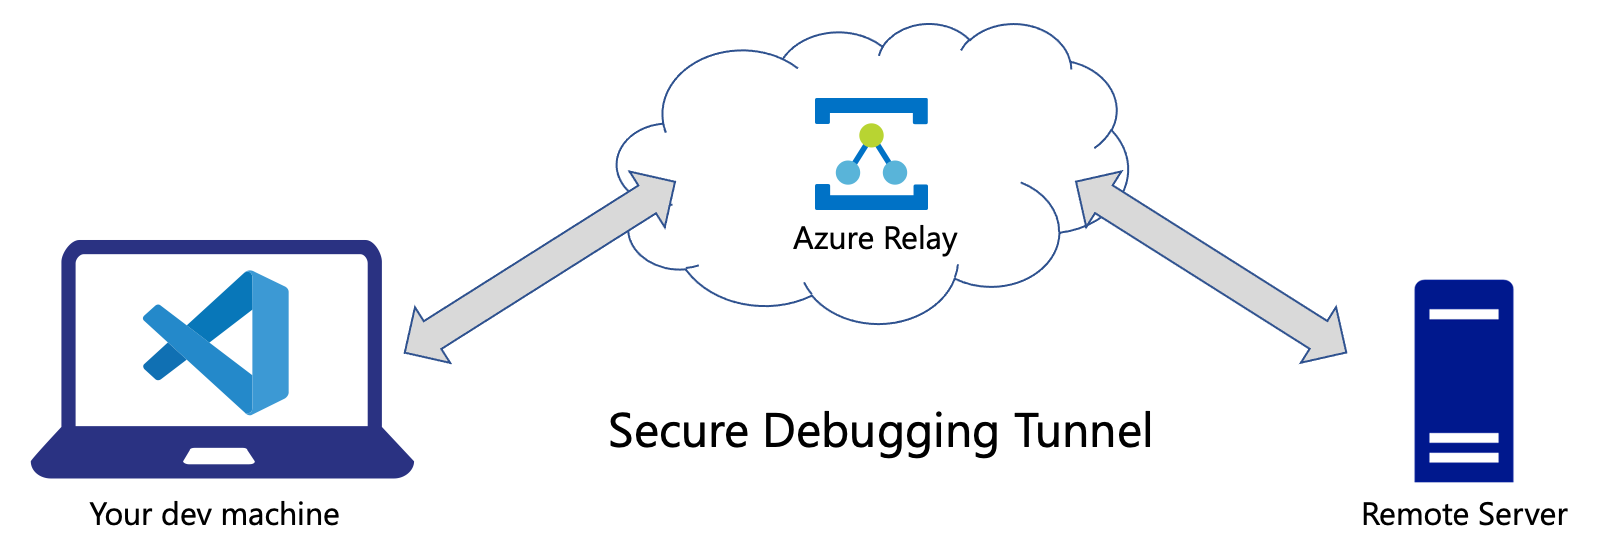
Azure Debugging Relay uses debugpy and Azure Relay service to create a debugging tunnel between 2 machines:
- Your local Visual Studio Code debugger in
listenmode. - Your remote code in
attachmode.
Both machines can be isolated behind NAT or virtual networks.
Azure Relay maintains a secure tunnel, just as if these VS Code and a remote process you debug are running in the same localhost network.
Remote components can run in any cloud, local network, with or without public internet access -- all they need is to be able to connect to Azure Relay resource.
The debugging tunnel is handled by Azure Relay Bridge utility which is downloaded and installed automatically by Azure Debugging Relay. Azure Relay Bridge can maintain secure TCP and UDP tunnels for different purposes.
We currently use a private fork of Azure Relay Bridge repo.
Requirements
- Python 3.6+
- debugpy 1.2.1+
- Visual Studio Code 1.34+ (for using VS Code extension)
Azure Relay Bridge tool is a .NET Core application, so you may need to install apt-transport-https and other .NET Core 3.1 Runtime prerequisites on Linux and Windows.
You don't have to install .NET Runtime itself - Azure Relay Bridge builds are self-contained.
Supported Operating Systems
- Ubuntu 18+
- Debian 10+
- macOS 10+
- Windows 10
Installation
On the debugger side (usually your dev machine with Visual Studio code):
Install Azure Debugging Relay extension from Visual Studio Marketplace.
On the server side:
python3 -m pip install azure-debug-relay
Usage
Before you start debugging with Azure Debugging Relay, there are 3 places you configure it:
- Azure Portal or CLI where you create an Azure Relay resource and an Azure Hybrid Connection in it.
- Local dev machine where you run Visual Studio Code, its Python extension, and Azure Debugging Relay extension with 2 configuration settings.
- Remote machine where you run the same code files that open locally in VS Code, with 2 lines that initiate debugging session for a certain request on an execution flow.
In Azure Portal
- Create Azure Relay resource. Better make one in a region closest to your location.
- Once created, switch to the resource, and select
Hybrid Connectionsoption in the vertical panel. - Add a hybrid connection (
+ Hybrid Connectionbutton), give it a memorable name (e.g.test🙂) - this is your Hybrid Connection Name. - Switch to that new hybrid connection, then select
Shared Access Policiesin the vertical panel. - Add a new policy with
SendandListenpermissions. - Once created, copy its
Primary Connection String, this is your Connection String.
Azure CLI version
Choose your name instead of mydebugrelay1 for an Azure Relay resource, and your custom name for Hybrid Connection instead of debugrelayhc1. Same applies to debugRelayResourceGroup as resource group.
az group create --name debugRelayResourceGroup --location westus2

az relay namespace create --resource-group debugRelayResourceGroup --name mydebugrelay1 --location westus2

az relay hyco create --resource-group debugRelayResourceGroup --namespace-name mydebugrelay1 --name debugrelayhc1

az relay hyco authorization-rule create --resource-group debugRelayResourceGroup --namespace-name mydebugrelay1 --hybrid-connection-name debugrelayhc1 --name sendlisten --rights Send Listen

az relay hyco authorization-rule keys list --resource-group debugRelayResourceGroup --namespace-name mydebugrelay1 --hybrid-connection-name debugrelayhc1 --name sendlisten
Last command will show you something like this:
{
  "keyName": "sendlisten",
  "primaryConnectionString": "Endpoint=sb://mydebugrelay1.servicebus.windows.net/;SharedAccessKeyName=sendlisten;SharedAccessKey=REDACTED1;EntityPath=debugrelayhc1",
  "primaryKey": "REDACTED1",
  "secondaryConnectionString": "Endpoint=sb://mydebugrelay1.servicebus.windows.net/;SharedAccessKeyName=sendlisten;SharedAccessKey=REDACTED2;EntityPath=debugrelayhc1",
  "secondaryKey": "REDACTED2"
}
Use primaryConnectionString or secondaryConnectionString value as your Connection String.
Hybrid Connection Name would be the one you choose instead of debugrelayhc1.
Remotely with remote_server_demo.py or your code
Remote Server example (in samples/simple_demo/remote_server_demo.py) assumes that Azure Relay credentials will are passes via .azrelay.json file in the current directory or via environment variables. Therefore, you have 2 options:
Option 1: Create .azrelay.json file in your workspace directory root or whatever directory will be "current",
and set 2 variables:
AZRELAY_CONNECTION_STRINGto your Connection String.AZRELAY_CONNECTION_NAMEto your Hybrid Connection Name.
For example:
{
  "AZRELAY_CONNECTION_STRING": "Endpoint=sb://mydebugrelay1.servicebus.windows.net/;SharedAccessKeyName=sendlisten;SharedAccessKey=REDACTED1;EntityPath=debugrelayhc1",
  "AZRELAY_CONNECTION_NAME": "debugrelayhc1"
}
Make sure you add .azrelay.json to .gitignore so won't be committed.
Option 2: You can assign these 2 variables as environment variables: AZRELAY_CONNECTION_STRING and AZRELAY_CONNECTION_NAME instead.
Prepare local Visual Studio Code
Use .azrelay.json file in the root of your workspace as above or .vscode/settings.json with the following settings (actual values are ones you have):
{
  "azure-debug-relay.azrelay-connection-string": "Endpoint=sb://your-relay.servicebus.windows.net/;SharedAccessKeyName=key_name;SharedAccessKey=REDACTED;EntityPath=test",

  "azure-debug-relay.azrelay-connection-name": "test",
}
Whenever Azure Debugging Relay VS Code extension detects non-empty
azure-debug-relay.hybrid-connection-stringandazure-debug-relay.hybrid-connection-namesettings (vscode/settings.json) orAZRELAY_CONNECTION_STRINGandAZRELAY_CONNECTION_NAMEin.azrelay.jsonfile, it launches Azure Relay Bridge every time a debugging session with debugpy inlistenmode is about to begin. If extension settings are not empty and.azrelay.jsonis present, Azure Relay Bridge prefers values from the extension settings (vscode/settings.json).
Visual Studio Code extension ignores AZRELAY_CONNECTION_STRING and AZRELAY_CONNECTION_NAME environment variables.
Start debugging in Visual Studio Code
This step must be done on your dev machine in Visual Studio Code before launching the remote code.
- Open
remote_server_demo.pyand put a breakpoint indo_work()function. - Makes sure your
.vscode/launch.jsonhasPython: Listen 5678configuration as in this repo's.vscode/launch.json. - Start debugging in your local Visual Studio Code in
Python: Listen 5678configuration.
Notice how the debugger maps paths on the local and the remote machines.
If your code has a different structure remotely, you may need to provide more sophisticated path mappings. Here is that piece in .vscode/launch.json:
"pathMappings": [
    {
        "localRoot": "${workspaceFolder}",
        "remoteRoot": "."
    }
]
It tells VS Code that the workspace directory locally is mapped to the "current" directory remotely.
When the debugger looks goes through a file remotely, it needs to find the corresponding file in your local VS Code workspace.
When debugging remote_server_demo.py, the debugger maps ./samples/simple_demo/remote_server_demo.py remotely to ${workspaceFolder}/samples/simple_demo/remote_server_demo.py locally.
Launch the example on the remote machine
- Clone the repo.
- Start
python3 ./samples/simple_demo/remote_server_demo.py --debug=attach. Notice that current directory must contain.azrelay.jsonfile unless configured with environment variables.
Terminal session where you start #2 must have the repo's directory as current directory - for a reason of mapping local and remote directories.
If everything works as it's supposed to, you will hit a breakpoint in your local Visual Studio Code.
Azure Debugging Relay Python API
remote_server_demo.py shows how you can use Azure Debugging Relay (azure-debug-relay package) with your code.
azdebugrelay module contains DebugRelay class that install and launches Azure Relay Bridge:
from azdebugrelay import DebugRelay, DebugMode, debugpy_connect_with_timeout

access_key_or_connection_string = "AZURE RELAY HYBRID CONNECTION STRING OR ACCESS KEY"
relay_connection_name = "HYBRID CONNECTION NAME" # your Hybrid Connection name
debug_mode = DebugMode.Connect # or DebugMode.WaitForConnection if connecting from another end
hybrid_connection_url = "HYBRID CONNECTION URL" # can be None if access_key_or_connection_string is a connection string
host = "127.0.0.1" # local hostname or ip address the debugger starts on
port = 5678 # any available port that you can use within your machine, may be a list of multiple ports
debugpy_timeout = 15 # 15 seconds for debugpy to connect

debug_relay = DebugRelay(access_key_or_connection_string, relay_connection_name, debug_mode, hybrid_connection_url, host, port)
debug_relay.open()

# attach to a remote debugger (usually from remote server code) with debug_mode = DebugMode.Connect
debugpy_connect_with_timeout(host, port, debugpy_timeout) # use instead of debugpy.connect
# if debug_mode = DebugMode.WaitForConnection, we are going to listen instead
# debugpy.listen((host, port))
# if debug_mode = DebugMode.WaitForConnection, you can start DebugRelay on multiple ports (ports parameter is a list)
# debugpy.listen must be called with each of these ports

# Debug, debug, debug
# ...
# ...

debug_relay.close()
access_key_or_connection_string- SAS Policy key or Connection String for Azure Relay Hybrid Connection. Must haveSendandListenpermissionsrelay_connection_name- name of the Hybrid Connectiondebug_mode- debug connection mode.DebugMode.WaitForConnectionwhen starting in listening mode,DebugMode.Connectfor attaching to a remote debugger.hybrid_connection_url- Hybrid Connection URL. Required when access_key_or_connection_string as an access key, otherwise is ignored and may be None.host- Local hostname or ip address the debugger starts on,127.0.0.1by defaultport- debugging port,5678by default
We added
debugpy_connect_with_timeoutmethod on top of debugpy.connect(). It acceptsconnect_timeout_secondsparameter - how long it should wait fordebugpy.connect()to connect. If the connection is not successfully made within the timeout, the debugging session aborts, and that can be handled in your code:debugpy_connect_with_timeout()returnsTrueif the connection was successful, andFalseotherwise.
Notice that DebugRelay accepts multiple ports to work with (ports parameter is a list).
That's because Azure Relay Bridge support forwarding on multiple ports.
This feature is primarily used by DebugRelay internally
for Simultaneous distributed debugging.
Azure Machine Learning samples
Simple Azure ML sample is located in samples/azure_ml_simple directory.
It has 2 components:
deploy_and_run.pyscript that deploys and launches an Azure ML pipeline with a single step.steps/train.pyscript which contains that simple step.
Look at the sample's readme file.
Advanced Azure Machine Learning sample is located in samples/azure_ml_advanced, and demonstrates a complex debugging scenario with parallel steps.
Look at the advanced sample's readme file.
Simultaneous distributed debugging
You can debug multiple simultaneously running remote nodes using different ports. Each execution flow you want to debug must use a separate port - both locally and remotely.
In Visual Studio code, it is achievable via so called "compound launch configurations". Compound launch configurations combine multiple launch configurations, and therefore start them at the same time.
Each launch configuration must be a Python listen configuration with a unique name and port:
{
  "name": "Python: Listen 5678",
  "type": "python",
  "request": "attach",
  "listen": {
      "host": "127.0.0.1",
      "port": 5678
  },
  "pathMappings": [
      {
          "localRoot": "${workspaceFolder}",
          "remoteRoot": "."
      }
  ]
}
You need as many launch configurations as number of simultaneous execution flows or nodes you'd like to debug.
Then you combine them in .vscode/launch.json to as a compound:
"compounds": [
  {
    "name": "Python: AML Advanced 3 Listeners",
    "configurations": [
      "Python: Listen 5678",
      "Python: Listen 5679",
      "Python: Listen 5680"
    ]
  }
]
Remotely, each node you debug should be aware of the port number it should use.
That port number must be passed to DebugRelay object and debugpy_connect_with_timeout().
Troubleshooting
Why using Azure Relay Bridge which is a .NET Core application that we have to install and use via subprocess calls?
Reasons:
- Azure Relay has SDKs for .NET, Java, and Node. No Python SDK or examples.
- Azure Relay Bridge does a lot of things we have to implement otherwise. It is a great tool that can help you connecting different networks for many purposes: for RDP, SSH and other protocols over TCP or UDP.
A private fork we are currently using is only to provide .NET Core 3.1 builds of the most recent code. There is a pending pul-requests: one and two.
Known issues
On macOS, there may be a situation when Azure Relay Bridge (
azbridge) cannot connect when creating a local forwarder (-Loption).
Reason: .NET Core wants you to add your Computer Name to /etc/hosts file, and make sure the hostname is configured.
Workaround: Make necessary edits of /etc/hosts file, and configure hostname:
- Look for your computer's name in
Settings → Sharing. - Run the following command:
scutil --set HostName "your-computer-name". (replaceyour-computer-namewith your computer's name) - Open
/etc/hostsin a text editor in sudo mode (VS Code can save it later in sudo mode). - Add the following line (replace
your-computer-namewith your computer's name). Save the file.
127.0.0.1 your-computer-name
I launched the debugger as described and nothing happened
Reason: you probably didn't put a breakpoint in your VS Code locally. Make sure that breakpoint is in a place that your server process actually runs through.
I do everything right, but nothing works
Reason: Stop all debugging sessions (if any). Kill all azbridge processes locally and remotely. Try again.
Doesn't help? File an issue! Thank you!
Release history Release notifications | RSS feed


Download files
Download the file for your platform. If you're not sure which to choose, learn more about installing packages.
Source Distribution
Built Distribution
Filter files by name, interpreter, ABI, and platform.
If you're not sure about the file name format, learn more about wheel file names.
Copy a direct link to the current filters
File details
Details for the file azure-debug-relay-0.5.1.tar.gz.
File metadata
- Download URL: azure-debug-relay-0.5.1.tar.gz
- Upload date:
- Size: 20.1 kB
- Tags: Source
- Uploaded using Trusted Publishing? No
- Uploaded via: poetry/1.1.4 CPython/3.8.7 Darwin/20.3.0
File hashes
| Algorithm | Hash digest | |
|---|---|---|
| SHA256 |
dfe64e04c5cec9c286437ca2af71212b3b43cbc2243b6596dbb5ea005a75a458
|
|
| MD5 |
f2b473c592043f70409b09dedea9f703
|
|
| BLAKE2b-256 |
5b19b9eb5d2e5a4fdf838c9ff81666479863bb0ef978180cba18e40065efbab3
|
File details
Details for the file azure_debug_relay-0.5.1-py3-none-any.whl.
File metadata
- Download URL: azure_debug_relay-0.5.1-py3-none-any.whl
- Upload date:
- Size: 15.7 kB
- Tags: Python 3
- Uploaded using Trusted Publishing? No
- Uploaded via: poetry/1.1.4 CPython/3.8.7 Darwin/20.3.0
File hashes
| Algorithm | Hash digest | |
|---|---|---|
| SHA256 |
9aea1c46e54266a3400ea005c32302d5aa18b8987cd058cebd9f879f5bcbb1e3
|
|
| MD5 |
0c74a734ab2740a3b0885720e0410245
|
|
| BLAKE2b-256 |
a9bc27d9cbcd9006c3d5cb4d7baac279f5b87bfb2a3b2b32d69bf5b47dcaa5a1
|


