









The problem · Which GPUs · How it works · Quickstart · Measured, not assumed · Findings · API · Method · Roadmap · Clean-room
The problem
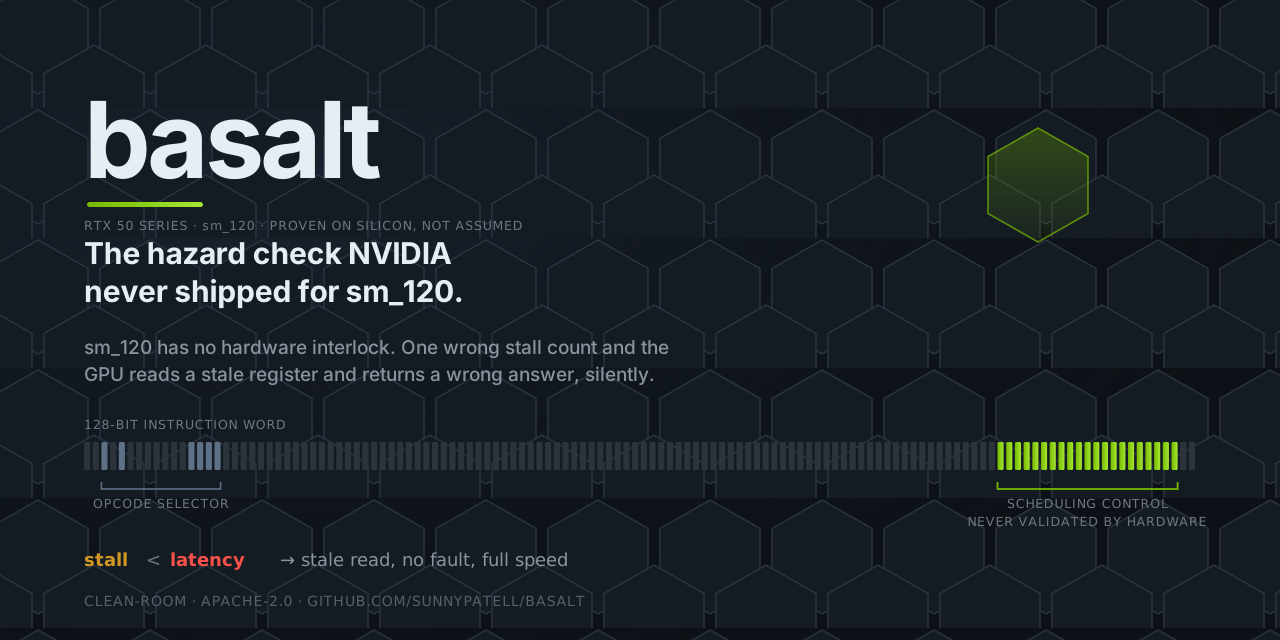
An NVIDIA GPU instruction is 128 bits, and 21 of them are not the instruction at all. They are a scheduling control word, stall through reuse: how many cycles to stall before issuing the next instruction, which scoreboards to signal, which to wait on, and which operands may be served from the reuse cache.
The hardware does not check any of it. On sm_120 there is no interlock on fixed-latency instructions. The silicon trusts whatever produced the control word. If a stall count is shorter than the latency of a value the next instruction consumes, nothing faults, nothing stalls, and no warning is emitted. The instruction reads a register that has not been written yet and computes on stale data, at full speed, every single time.
That is a strange kind of bug. It does not crash. It does not appear in a debugger. It produces numbers that are merely wrong, which in a matrix multiply or an attention kernel means a model that trains slightly badly rather than one that visibly breaks.
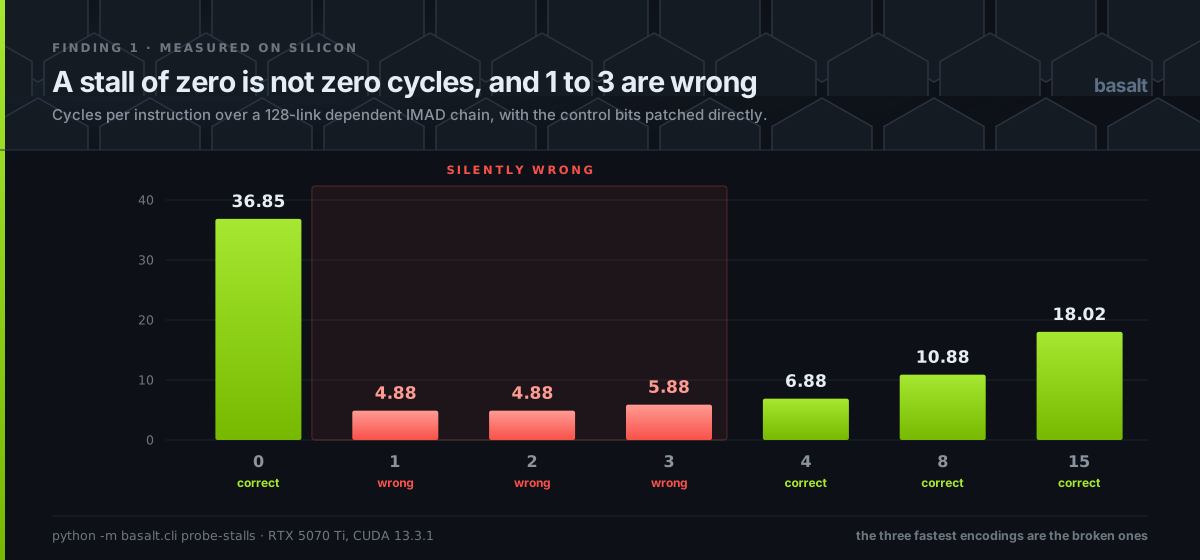
The three cheapest encodings are the broken ones, and nothing anywhere reports it. Note also what the left-hand bar is doing: a stall of zero is not zero cycles, it is a distinct safe encoding that waits for outstanding results and costs about nine times a scheduled instruction. A checker that read it as zero would call correct programs broken.
Tools that generate machine code for this architecture assign those control bits from a latency model. basalt is the thing that checks the answer.
The check NVIDIA never shipped
NVIDIA gives you a compiler that writes those 21 bits. It gives you nothing that reads them back and tells you they are safe, and neither does anyone else.
Assemblers for NVIDIA GPUs have existed for a decade, the Blackwell encoding has been
reverse engineered before, there are published cycle-level characterisations of sm_120,
and one public assembler for this architecture already assigns the scheduling control bits
itself and runs its own kernels on a card to see that the answers come out right. All true,
and none of it is the claim:
Nothing else can be handed a cubin it did not produce and told to say whether its scheduling control bits are safe.
Your compiler emitted that cubin, or a library shipped it, or somebody hand-wrote it, and until now there was no way to ask. On an architecture with no hardware interlock that is the difference between "it ran" and "it is correct", and the difference is invisible: a stall one cycle short reads a stale register and returns a wrong number at full speed, with no fault and no warning, every single time.
Everything else here exists to make that sentence testable. The assembler is what builds a program with one stall deliberately shortened. The scheduler is what forces the model to commit to an answer rather than grade someone else's. And the audit is where the sentence stops being an absence and becomes a measurement: basalt pointed at 2,473 sm_120 kernels NVIDIA ships in cuBLAS, cuSOLVER, cuSPARSE, NPP and the rest.
Why it did not exist, in the field's own words. The most used SASS assembler says in its own documentation that "checking rigorous correctness of the whole program … [is] far from possible without official support. So, it is left to the user to guarantee the correctness of the program, with very limited help from the assembler." SIP, on autotuning SASS schedules, states that "validation is impossible for GPU native assembly codes because the formal semantics of the sass is closed-source."
Both are about semantic correctness: whether a kernel computes what it is supposed to. basalt does not answer that, and nothing here claims to. It answers a strictly smaller question, and the point is that the smaller question is decidable without the semantics:
Do this program's control bits cover its own data dependencies?
That needs the dependency structure, which the encoding gives up, and a latency model, which the silicon gives up under measurement. Neither requires knowing what any instruction computes. A kernel can pass this check and still be the wrong algorithm; what it cannot do is read a register before the value lands.
Second, nothing else is measured against the vendor's own bytes. basalt's reference is
ptxas output, so a disagreement is basalt's bug until proven otherwise. Its assembler has
to reproduce the compiler's exact 128 bits. Its scheduler has to throw away every control bit
the compiler chose, compute new ones, and have the GPU compute the same answer.
One standard for all of it: agree with the vendor exactly, or say why not.
| What it does | How it is checked | Result | |
|---|---|---|---|
| Assembler | SASS text to the 128-bit word | Reassemble every instruction ptxas emitted and compare bytes |
59,693 of 59,760 exact across four optimisation levels, 0 wrong |
| And 5.2M instructions of shipped library code it had never seen | 4,585,336 exact, 652,112 refused by name, 0 wrong | ||
| Checker | Reads a schedule, reports hazards | The vendor's own output must verify clean, and a deliberately shortened stall must be caught | 0 errors over 1,323 vendor kernel and optimisation-level pairs, 0 missed on 233 broken ones |
| Audit | The same checker, on shipped libraries | Run it over production sm_120 kernels held out of every table it reads | 0 errors over 2,762 kernels and 10,218,030 dependencies, all 2,762 fully analysed |
| Scheduler | Assigns every control bit from scratch | Discard the vendor's, compute new ones, run both on the GPU against eight inputs, compare output bytes | 439 of 439 comparable kernels byte-identical, at all three optimisation levels |
And the part a scheduler is usually quiet about: what the correctness costs. basalt's schedules spend 1.05x the vendor's issue cycles, slower on 111 of the 1,323 kernel and optimisation-level pairs and cheaper on 842, with every comparable kernel still byte-identical on the GPU.
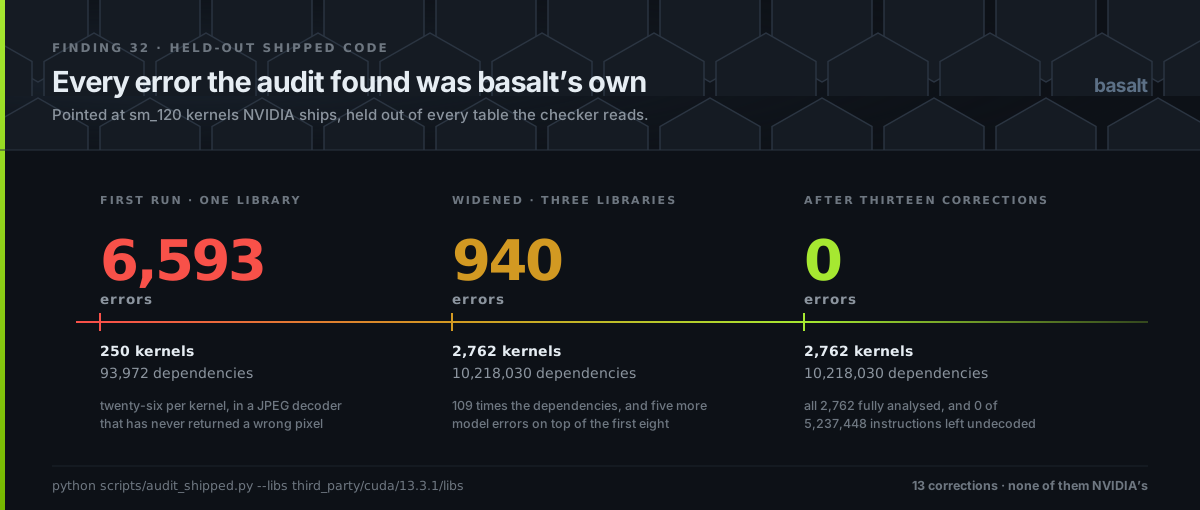
The third row is the one that changed the other three. A checker calibrated on a corpus cannot fail on that corpus: the tightest gap the compiler was seen to leave is the floor, by construction, for exactly the code it was measured on. The first time this one saw code from somewhere else it reported twenty-six hazards per kernel in a JPEG decoder that has never returned a wrong pixel, and all 6,593 were basalt's. Fixing those took it to zero, and zero over one library was not evidence either: widening the held-out set to three libraries and 5.2 million instructions took it straight back to 940, and found five more model errors on top of the first eight. Thirteen corrections, none of them NVIDIA's, and the requirement re-mined from 24,311 shipped kernels put a guard predicate at 13 cycles across 229,567 observations, which is the number fault injection had measured on this card by breaking a program on purpose. See finding 32.
Cheaper than the vendor is not a claim to be smug about. basalt schedules every dependency
at the tightest gap ptxas was ever seen to leave for that exact pairing, and ptxas is
balancing register pressure and memory alongside issue latency while this optimises one
number. It was also not believed on sight: the first time the ratio went under 1.0 the
hardware round trip broke, and the number only stood once the bug it exposed was fixed. The
ratio is pinned from both sides in the test suite for that reason.
The middle column is the point. A checker and a scheduler that share a latency model agree with each other while both being wrong, so neither is evidence for the other; only the silicon has no stake in the argument. Running the scheduler over seven hand-written kernels passed seven of seven for a long time. Running it over three hundred found forty-one wrong ones, and every correction in findings came out of watching that number move.
The same applies to the inputs. A stale read only changes the answer when the stale value and the fresh one differ, so one pattern of bytes is one chance to notice, and running every kernel against a second, third and fourth pattern immediately found a carry-out predicate the operand model had been reading as a source since the beginning. It had survived every control up to that point, including the round trip itself.
The same discipline decides what the assembler is allowed to do, and it is worth separating the two numbers it has.
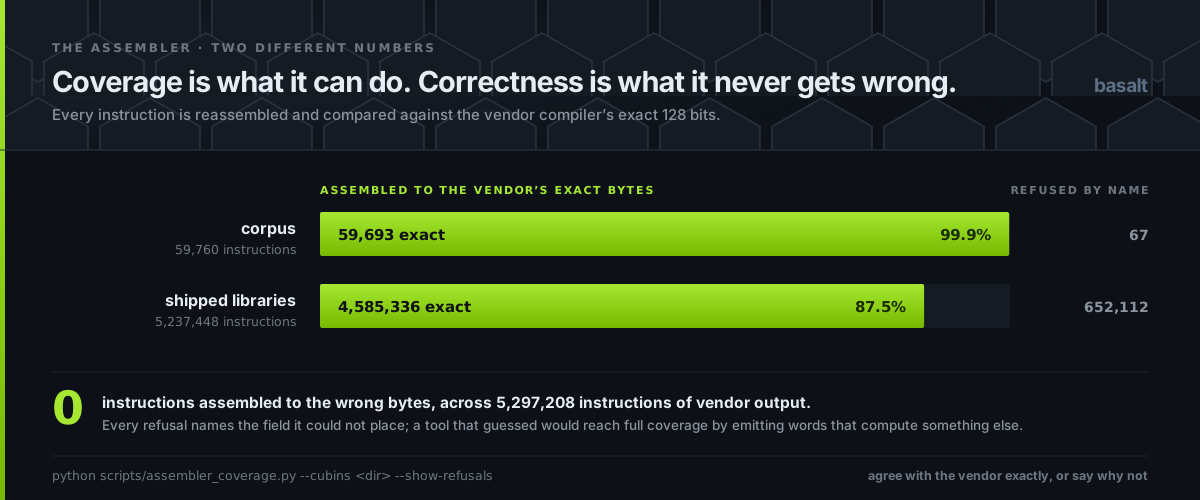
Coverage is 99.9% of the corpus and 87.5% of shipped library code. Correctness is 100%, and that is the number pinned by a test. The gap between them is instructions basalt refuses, each naming the field it could not place, because a tool that guessed would reach full coverage by emitting words that disassemble to the right text and compute something else. It has never emitted one, across 59,760 corpus instructions and 5,237,448 shipped ones.
It got there only after eight separate rounds of being confidently incorrect:
- writing a register number into the encoding of an immediate form,
- treating a uniform register as interchangeable with a regular one,
- keeping the branch target of whichever kernel the form was harvested from,
- putting the integer 15 into a field that holds a half-precision float,
- writing an operand into bits that turned out to be a reuse flag,
- writing into a field the prober had only partly attributed, leaving the rest still encoding the old value,
- spreading a register number across the bit that selects which register file it is in,
- and reading a register-indexed constant load's index as a displacement.
Every one of those produced a word that assembles, disassembles back to exactly the text it came from, and computes something else. That is the same failure the rest of this repository exists to catch, which is why all eight are now refused with a reason naming what the field really holds, and why the count of instructions that assemble to the wrong bytes is a test pinned at zero rather than a number in a table.
A ninth turned up the first time the assembler was pointed at machine code it had not
produced, and it was a different kind. c[0x0][UR4] indexes its offset by a register where
the recorded form holds a number, and the encoder raised rather than refusing. A crash on
foreign input is worse than a wrong verdict, because the caller gets neither.
Which GPUs



sm_120 is not a model number. It is the compute capability shared by the whole consumer
Blackwell line, so the instruction encoding, the database, the assembler and the checker
apply to every card in it:
| Card | Compute capability | Covered |
|---|---|---|
| GeForce RTX 5090, 5090D | 12.0 (sm_120) |
yes |
| GeForce RTX 5080, 5070 Ti, 5070 | 12.0 (sm_120) |
yes |
| GeForce RTX 5060 Ti, 5060, 5050 | 12.0 (sm_120) |
yes |
| GeForce RTX 50 series laptop parts | 12.0 (sm_120) |
yes |
| RTX PRO Blackwell workstation cards | 12.0 (sm_120) |
yes |
| Datacentre Blackwell (B100, B200, GB200) | 10.0 (sm_100) |
no, different encoding |
ptxas also targets sm_121, a different chip in the same family. basalt has never run on
one, and does not claim to support it. What it can say is measured: the compiler emits
byte-identical code, control words included, for all six targets it offers here, so the
schedule a kernel needs is a property of the architecture rather than of the part
(finding 28). If that were not true, NVIDIA's own compiler would be
emitting an unsafe schedule for one of them.
Every number measured on silicon comes from one physical card, named exactly, because "a 5070 Ti" is not enough to reproduce a run:
| The card | Exactly what it is |
|---|---|
| Board | Gigabyte GeForce RTX 5070 Ti EAGLE OC |
| Reported by the driver | NVIDIA GeForce RTX 5070 Ti |
| Compute capability | 12.0 |
| Streaming multiprocessors | 70 |
| Boost clock | 2542 MHz |
| Toolchain | CUDA 13.3.1, ptxas V13.3.73 |
What needs a GPU, and what does not
Most of basalt needs no GPU at all. Both oracles, the instruction database, the
assembler and the hazard checker run against ptxas and nvdisasm as ordinary
subprocesses, which is why they run in CI on a machine with no graphics card in it. 237 of
the 252 tests are in that group, and 200 need neither a card nor the NVIDIA binaries.
A GPU is needed for exactly three things, and they are the three that turn a plausible tool into a believable one:
| Needs a card | Why |
|---|---|
measure, probe-stalls |
Timing an instruction, and finding what a dependency really requires by breaking it |
scripts/roundtrip_corpus.py |
Rescheduling every corpus kernel and running both versions to compare output bytes |
scripts/agreement_sweep.py |
Shortening one dependency per kernel and asking the silicon whether basalt was right |
The factory overclock does not move the measurements. Every latency here is in cycles,
which is a property of the pipeline rather than of the clock, and the boost figure is
recorded beside them only so a wall-clock comparison stays possible. What the board does
affect is reproducibility, which is why basalt measure --board records it.
Why one card is a caveat and not a footnote
Everything measured here was measured on one card, and basalt records the SKU alongside every measurement rather than presenting them as universal. A 5090 has more than twice the SMs and its own clock behaviour; the encoding will be identical and the latencies should be re-measured rather than assumed:
python -m basalt.cli measure -o my-card.json
python -m basalt.cli verify kernel.cubin --latencies my-card.json
That is not modesty. A latency model shared between a checker and a scheduler is exactly where a wrong number hides, so a second card is the most useful thing anyone can contribute.
How it works
Everything rests on two oracles, both of which are stock NVIDIA binaries driven as external processes. No NVIDIA source, headers, or libraries are used or redistributed.
| Oracle | Invocation | What it gives |
|---|---|---|
| Ground truth | ptxas → cubin → nvdisasm -c -hex |
Encodings the vendor compiler actually emits. Semantics beyond dispute. |
| Probe | nvdisasm -b SM120a over raw bytes |
Decodes words ptxas will never emit, which turns the encoding space into something searchable rather than something to guess at. |
The probe oracle is the one that matters. A tool limited to compiler output can only ever rediscover what the compiler already does. Feeding synthesised 128-bit words straight to the decoder means the instruction set can be measured.
Neither oracle needs a GPU, so the entire instruction database rebuilds in CI on any machine.
Deriving the encoding by changing it
basalt does not read a table of opcodes from anywhere. It takes an encoding that assembled, flips one bit, decodes the result, and records what moved. A bit that changes the destination register is a destination bit; a bit that changes the mnemonic is a selector; a bit that changes nothing observable is inert.
Run against IADD R5, R5, 0x2a, the measurement comes out as:
operand[0]  bits 16:23     flip 16 -> R4,  flip 17 -> R7      destination register
operand[1]  bits 24:31     plus bit 72, which negates it      source register
operand[2]  bits 32:63     flip 32 -> 0x2b, flip 33 -> 0x28   32-bit immediate
opcode      bits 2, 4, 12:15
inert       36 bits        no observable effect
invalid     11 bits        the decoder rejects the mutation
Eight-bit register fields and a 32-bit immediate, arrived at by experiment rather than assumption.
The control word
| Field | Bits | Meaning |
|---|---|---|
stall |
108:105 | Cycles to wait before issuing the next instruction |
yield |
109 | Hint that the warp scheduler may switch warps |
write_barrier |
112:110 | Scoreboard to signal on write-back (7 = none) |
read_barrier |
115:113 | Scoreboard to signal on operand read (7 = none) |
wait_mask |
121:116 | Scoreboards that must be clear before issuing |
reuse |
125:122 | Operand reuse-cache flags, one per source slot |
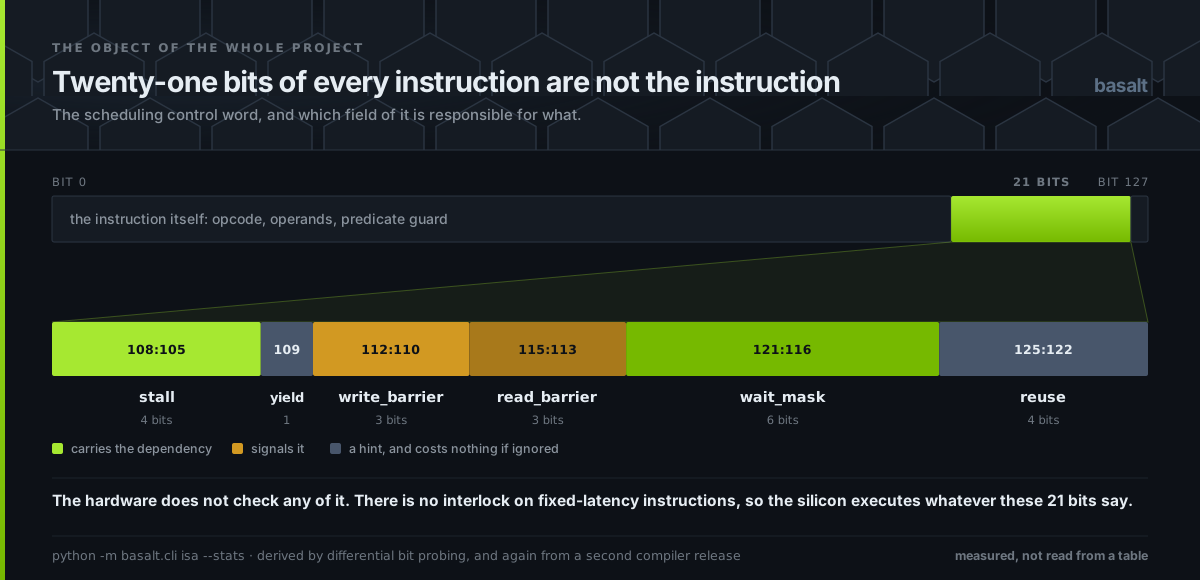
The layout validates itself on contact. In a trivial kernel, S2R sets write_barrier=0 and the IMAD consuming its result carries wait_mask=0x01; LDCU.64 sets write_barrier=1 and the dependent STG.E carries wait_mask=0x02. Every producer and consumer pair lines up, and instructions that nvdisasm annotates .reuse have the matching reuse bit set.
Quickstart
No CUDA installation and no GPU. The toolchain script fetches pinned redistributables, roughly 45 MB, no administrator rights, nothing added to your PATH.
git clone https://github.com/sunnypatell/basalt.git
cd basalt
python -m venv .venv && source .venv/bin/activate   # Windows: .\.venv\Scripts\Activate.ps1
pip install -e ".[dev]"

python scripts/fetch_toolchain.py     # pinned ptxas + nvdisasm
python -m basalt.cli doctor           # verify both oracles end to end
python scripts/verify_all.py          # every control in this README, in order
$ python -m basalt.cli doctor
ok    toolchain   V13.3.73 in third_party/cuda/13.3.1/bin
ok    ptxas       assembled sm_120a
ok    cubin oracle  16 instructions with encodings
ok    probe oracle 16/16 mnemonics round-tripped

both oracles healthy. no GPU required for anything above.
Where it looks for ptxas and nvdisasm
basalt drives both as external processes and redistributes neither, so it has to find a copy. It takes the first that answers, and any CUDA 13 install will do: nothing has to be the pinned redistributable.
| Order | Where |
|---|---|
| 1 | --cuda-bin, passed on the command line |
| 2 | BASALT_CUDA_BIN, a directory holding both binaries |
| 3 | CUDA_PATH, CUDA_HOME or CUDA_ROOT, each plus /bin |
| 4 | ptxas on your PATH |
| 5 | third_party/cuda/<version>/bin in a checkout, newest first |
basalt doctor prints which one it resolved, and exits non-zero when it cannot find one, so
it works as a build-step precondition rather than only as a thing to read.
Querying the instruction database needs no toolchain at all, because the database is measured ahead of time and ships inside the package:
basalt isa --stats
basalt isa --opcode QMMA
Rebuild the instruction database from scratch, or query the committed one:
python -m basalt.cli build-isa          # harvest, probe, write src/basalt/data/isa/sm_120a.json
python -m basalt.cli isa --stats
python -m basalt.cli isa IMAD.WIDE.U32  # one form, with its measured field layout
python -m basalt.cli isa --opcode QMMA  # every form of one opcode
Check machine code you did not write
This is the part nothing else does, and it needs no GPU and no arguments. The measured latency model and the mined requirement table are both committed, so a fresh clone can be pointed straight at a cubin, whatever produced it:
python -m basalt.cli verify kernel.cubin
$ python -m basalt.cli verify nvjpeg.sm_120.cubin
  25 kernels, 0 with an error
  7984 instructions in 789 blocks, 11580 dependencies checked across blocks: 0 errors, 3 warnings
  pair data: 3957 pairings from 25634 kernels, 427 producers with enough observations to use
  latency model: measured on NVIDIA GeForce RTX 5070 Ti
A library ELF holds hundreds of kernels and each is checked on its own, because offsets
restart at zero and nothing falls through from one into the next. Add --strict to exit
non-zero on a hazard, which is what a build step wants. If you have an sm_120 card and want
the model measured on your own silicon rather than on the one in this repository:
python -m basalt.cli measure -o my-card.json   # needs a GPU, once
python -m basalt.cli verify kernel.cubin --latencies my-card.json
Every command, and which need a card
| Command | What it does | Needs a GPU |
|---|---|---|
doctor |
Check both oracles end to end | no |
build-isa |
Harvest and probe, write the instruction database | no |
isa |
Query a form, an opcode, or the coverage | no |
validate-isa |
Prove the measured fields can be written through | no |
mine-stalls |
Learn per-pair requirements from what the compiler schedules | no |
verify |
Check a cubin's control bits for data hazards | no |
schedule |
Assign a cubin's control bits from scratch and check the result | no |
assemble |
Encode SASS text, or a whole cubin, and read it back to prove it | no |
measure |
Time instruction latency on real silicon | yes |
probe-stalls |
Find the required stall by breaking programs on purpose | yes |
Everything the CLI does is importable, and the library surface with runnable examples is
in docs/API.md.
And the two controls that keep the rest honest. The first needs a card; the second needs the shipped libraries and no hardware at all:
python scripts/roundtrip_corpus.py    # reschedule all 441 corpus kernels, run both on the GPU

python scripts/fetch_toolchain.py --libs                  # ~1.2 GB, no admin, nothing on PATH
python scripts/audit_shipped.py --libs third_party/cuda/13.3.1/libs
$ python -m basalt.cli verify kernel.cubin --latencies src/basalt/data/latency/rtx-5070-ti.json
kernel.cubin
  32 instructions in 3 blocks, 23 dependencies checked: clean
  latency model: measured on NVIDIA GeForce RTX 5070 Ti
Measured, not assumed
Numbers here are printed by the tooling and regenerate from a clean checkout. The commands above are the source of truth; these tables are snapshots.
Instruction database. Every entry carries an encoding that really assembled and the compiler build that produced it.
| Instruction database | Count |
|---|---|
| Instruction forms | 345 |
| Distinct opcodes | 90 |
| Forms with a full operand map | 339 |
| Tensor-core forms | 46 |
| Built with | ptxas V13.3.73 |
Tensor coverage is where the low-precision hardware lives: HMMA and IMMA, QMMA across the FP8, FP6 and FP4 types including asymmetric operand pairs, the scale-factor forms QMMA.SF and OMMA.SF that carry a per-block exponent, sparse IMMA.SP, and the matrix movement instructions LDSM, STSM and MOVM in every shape including the transposing variants.
Latency, on an RTX 5070 Ti. 70 SMs, every fit R² ≥ 0.9998. Measured by timing dependent chains and taking the slope, with the chain length read back out of the compiled SASS rather than assumed.
| Instructions | Cycles |
|---|---|
IMAD IADD3 FFMA FADD FMUL LOP3 SHF |
4 |
POPC |
18 |
I2FP + F2I together |
24 |
MUFU |
44 |
DADD DFMA |
64 |
Three of those contradict the assumed model basalt shipped with: DADD was assumed 48, POPC was assumed 4, and each conversion was assumed 6 against 24 measured for the round trip.
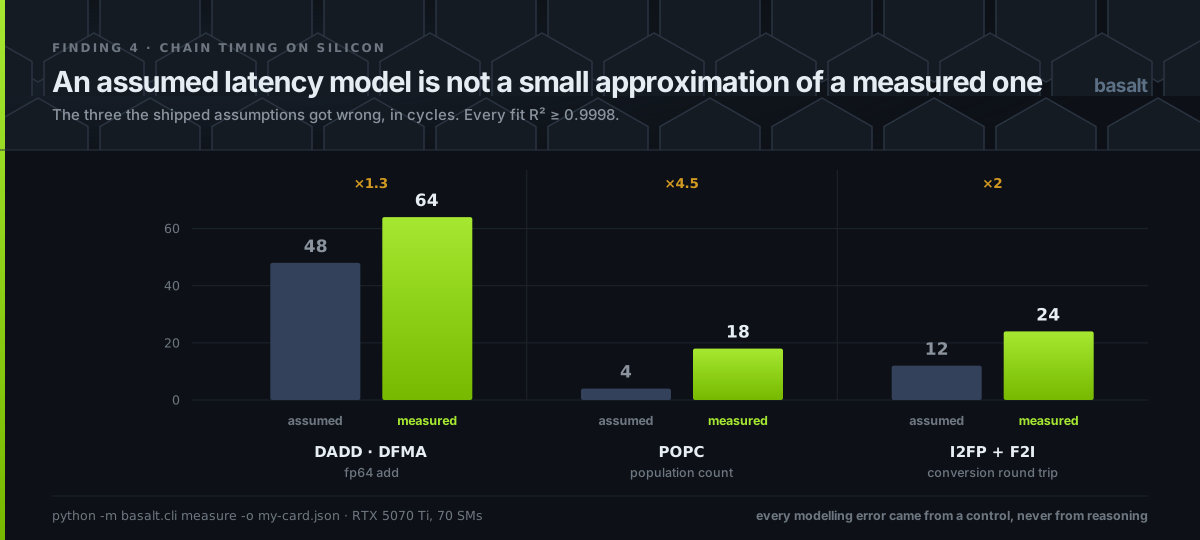
An assumed latency model is not a small approximation of a measured one, which is the entire argument for measuring.
And a stall of zero is not zero cycles. It is a distinct safe encoding that waits for outstanding results, costing about 37 cycles where a scheduled instruction costs 4. That is why ptxas -O0 emits an entirely zeroed control word and the code still computes correctly, roughly nine times slower.
stall |
cycles/instruction | result |
|---|---|---|
| 0 | 36.85 | correct |
| 1 | 4.88 | wrong |
| 2 | 4.88 | wrong |
| 3 | 5.88 | wrong |
| 4 | 6.88 | correct |
It agrees with the vendor compiler on every kernel in the corpus. Every kernel ptxas builds from the corpus is verified against its own scheduling, at every optimisation level that schedules: 30,421 dependencies, zero errors. That sweep runs in CI on every push, and every modelling error this project has made was caught by it rather than by reasoning.
The verdicts match the silicon. For every encodable stall on a dependent producer, basalt's static answer and what the hardware actually computes agree, including the zero case. That is held as a test, not asserted here. Full evidence, including three independent methods for the required stall and the corrections made along the way, is in findings.
And when it says a schedule is unsafe, the silicon agrees. Take the vendor's own working schedule for 233 kernels, shorten one real dependency in each, and compare basalt's verdict against what the GPU computes: 79 that it called broken were broken, and nothing it called safe computed a wrong answer. That number started at 34 missed rather than zero, and findings says what the cause was and what fixing it cost in false alarms, because a sweep that only ever reported its final figure would be worth less than one that reported its first.
It can assign the control bits too
The verifier answers whether a schedule is safe. The scheduler answers what a safe schedule would be, from the same measurements: it discards every control bit ptxas produced, computes its own, hands the result back to the verifier, and then runs it on the GPU beside the vendor's version of the same kernel.
Run over the whole corpus on the card, at every optimisation level that produces a schedule, all 439 comparable kernels come out computing byte-identical results to the vendor schedule, from control bits basalt worked out itself. The 2 that are excluded read the clock and the grid id, so they do not agree with themselves either, and findings says so rather than folding them into a percentage.
That control is the reason any of the rest is trustworthy. The checker and the scheduler read the same latency model, so a wrong entry in it satisfies both at once and they agree with each other while both being wrong. Only the silicon has no stake in the argument. Running the scheduler over seven hand-written kernels passed seven of seven for a long time; running it over three hundred found forty-one wrong ones, and every model correction since came out of watching that number move.
That loop is where the real bugs came from. Stall spent outside the window between a producer and its consumer counts for nothing, and spending it there ends the search with a program that is still short. A stall pinned to the safe encoding was being overwritten by a later pass, replacing a guarantee with a small number. fp64 operands occupy register pairs with nothing in the mnemonic to say so, so half of every fp64 dependency was invisible to both the checker and the scheduler. A predicate used as an instruction's guard needs thirteen cycles where the same predicate read as data needs five, because a guard has to be resolved before the instruction issues at all. And waiting on a scoreboard does not settle a dependency completely: the producer still owes a small stall of its own, two cycles for fp64 add, and one cycle less is silently wrong. None of those were found by reasoning; every one was found by running the output and getting the wrong number.
[!NOTE] 1.0, and specific about what that means. What is done: both oracles, the instruction database with its fields proven writable, the hazard checker over a real control-flow graph, latency measured on one SKU by three independent methods, a scheduler that round-trips every comparable corpus kernel through the hardware byte-for-byte, and an audit of 2,762 shipped kernels held out of every table the checker reads. What is not: 12 corpus kernels that are not runnable by construction and 2 whose vendor output is not deterministic, all named in the findings; ten opcodes still carry an assumed latency rather than a measured one, none of them ever a producer in either body of code; and only one GPU has been measured, which finding 28 shows matters less than it sounds. Where something is inferred rather than measured, the tooling says so rather than rounding it up to a fact. See the roadmap and the method.
Repository layout
Where everything lives
src/basalt/
  toolchain.py     Locating and driving ptxas / nvdisasm
  encoding.py      The 128-bit instruction word and its control fields
  disasm.py        Both oracles: cubin ground truth and raw-word probe
  harvest/         PTX corpus generation and encoding extraction
  probe/           Differential bit probing and field inference
  isa/             The generated instruction database and its builder
  asm/             The assembler, and the ELF reader that rewrites words in place
  sched/           Assigning the control bits, and costing the result
  verify/          Register def-use analysis, hazard model, latency checking
  gpu/             Driver-API bindings and the latency measurement harness
src/basalt/data/   The measured tables, inside the package so an installed copy
                   has them: the ISA database, the latency model and the mined
                   stall requirement
docs/              Findings, method, the Python API, roadmap, artwork sources
scripts/           Toolchain fetch, asset rendering, drift check, and the two
                   hardware controls: the corpus round trip and the agreement sweep
tests/             Unit tests, plus toolchain- and GPU-marked suites
Clean-room position
basalt is an independent, clean-room work for interoperability. It contains no NVIDIA source code, headers, libraries, or documentation, and redistributes none. It observes the behaviour of publicly distributed executables and records it, which is the footing this kind of work has stood on for over a decade.
NVIDIA, CUDA, and Blackwell are trademarks of NVIDIA Corporation. This project is not affiliated with, endorsed by, or sponsored by NVIDIA.
Licensed under Apache-2.0. Apache rather than something restrictive on purpose: a correctness tool nobody is allowed to build on is a correctness tool nobody runs, and the patent grant matters for work this close to hardware.
Contributing
The highest-value contribution is an encoding basalt gets wrong. See CONTRIBUTING.md and the ISA gap template, which collects enough to reproduce without your machine.
SUPPORT.md says where a question goes, GOVERNANCE.md what a change has to clear, RELEASING.md how a release is cut and verified, and SECURITY.md how to report privately.
Citing basalt
If basalt informs a paper, a tool, a model or a bug report, please cite it. GitHub reads
CITATION.cff natively, so Cite this repository in the sidebar gives you
APA and BibTeX with no transcription. The same file is what Zenodo and citation managers
parse, and it is the authoritative record of authorship.
The key below is the one GitHub generates, so copying from here and copying from the sidebar give the same entry rather than two that look like different works:
@software{Patel_basalt_a_hazard_2026,
  author = {Patel, Sunny},
  license = {Apache-2.0},
  month = aug,
  title = {{basalt: a hazard checker, assembler and scheduler for NVIDIA consumer Blackwell (sm\_120)}},
  url = {https://github.com/sunnypatell/basalt},
  version = {1.0.0},
  year = {2026}
}
Once the archive is minted, cite the concept DOI rather than this URL or a version DOI.
It resolves to the newest release, so it stays correct without ever being edited again, and
it appears in both forms above automatically once CITATION.cff carries it.
If you reuse the measured tables (src/basalt/data/) or reproduce a figure, cite the release
they came from rather than main: the numbers are regenerated by scripts/verify_all.py at
a specific commit, and a tag is what makes that reproducible.
Attribution is a licence term, not a courtesy. Apache-2.0 §4 requires that
LICENSE and NOTICE travel with any redistribution or derivative work,
and NOTICE carries the authorship and the clean-room statement. Forks, vendored copies and
repackaged wheels all keep both files.
Author
Sunny Patel · sunnypatel.net · github.com/sunnypatell
1 maintainer

Download files
Download the file for your platform. If you're not sure which to choose, learn more about installing packages.
Source Distribution
Built Distribution
Filter files by name, interpreter, ABI, and platform.
If you're not sure about the file name format, learn more about wheel file names.
Copy a direct link to the current filters
File details
Details for the file basalt_sass-1.0.0.tar.gz.
File metadata
- Download URL: basalt_sass-1.0.0.tar.gz
- Upload date:
- Size: 811.9 kB
- Tags: Source
- Uploaded using Trusted Publishing? Yes
- Uploaded via:
twine/7.0.0 CPython/3.13.14
File hashes
| Algorithm | Hash digest | |
|---|---|---|
| SHA256 |
ec4abd1589ac892d90223024f542cf642b618c2b8b4eee6a20f246353466a575
|
|
| MD5 |
85a1485163e92bdc5c4c1f6366987ec3
|
|
| BLAKE2b-256 |
7f92ea53ae12b8e2c8087dd191bf2c693f3668fb2508aab08e49d04168323e87
|
Provenance
The following attestation bundles were made for basalt_sass-1.0.0.tar.gz:
Publisher:
publish-pypi.yml on sunnypatell/basalt
-
Statement:
-
Statement type:
https://in-toto.io/Statement/v1 -
Predicate type:
https://docs.pypi.org/attestations/publish/v1 -
Subject name:
basalt_sass-1.0.0.tar.gz -
Subject digest:
ec4abd1589ac892d90223024f542cf642b618c2b8b4eee6a20f246353466a575 - Sigstore transparency entry: 2577182185
- Sigstore integration time:
-
Permalink:
sunnypatell/basalt@4c39eafe52bd49b042cdd8db5d7f5568c721c448 -
Branch / Tag:
refs/heads/main - Owner: https://github.com/sunnypatell
-
Access:
public
-
Token Issuer:
https://token.actions.githubusercontent.com -
Runner Environment:
github-hosted -
Publication workflow:
publish-pypi.yml@4c39eafe52bd49b042cdd8db5d7f5568c721c448 -
Trigger Event:
workflow_dispatch
-
Statement type:
File details
Details for the file basalt_sass-1.0.0-py3-none-any.whl.
File metadata
- Download URL: basalt_sass-1.0.0-py3-none-any.whl
- Upload date:
- Size: 792.3 kB
- Tags: Python 3
- Uploaded using Trusted Publishing? Yes
- Uploaded via:
twine/7.0.0 CPython/3.13.14
File hashes
| Algorithm | Hash digest | |
|---|---|---|
| SHA256 |
86a7842d028fafb275c03b6b3b54a9421fc93ec9a4107e4d0b6b8df646b7223f
|
|
| MD5 |
a93dca9bc6b17ea3fa847edd43bf984d
|
|
| BLAKE2b-256 |
34deb8280697c8e1c3ace655a58044e7d1cc06980e8424a0b55173e0bfd521d6
|
Provenance
The following attestation bundles were made for basalt_sass-1.0.0-py3-none-any.whl:
Publisher:
publish-pypi.yml on sunnypatell/basalt
-
Statement:
-
Statement type:
https://in-toto.io/Statement/v1 -
Predicate type:
https://docs.pypi.org/attestations/publish/v1 -
Subject name:
basalt_sass-1.0.0-py3-none-any.whl -
Subject digest:
86a7842d028fafb275c03b6b3b54a9421fc93ec9a4107e4d0b6b8df646b7223f - Sigstore transparency entry: 2577182275
- Sigstore integration time:
-
Permalink:
sunnypatell/basalt@4c39eafe52bd49b042cdd8db5d7f5568c721c448 -
Branch / Tag:
refs/heads/main - Owner: https://github.com/sunnypatell
-
Access:
public
-
Token Issuer:
https://token.actions.githubusercontent.com -
Runner Environment:
github-hosted -
Publication workflow:
publish-pypi.yml@4c39eafe52bd49b042cdd8db5d7f5568c721c448 -
Trigger Event:
workflow_dispatch
-
Statement type:







