
Create basic SVG charts

Project description
basic-svg-chart
A simple Python library for creating basic SVG charts, dependency-free: it uses builtin xml.etree.ElementTree.
To see what kind of charts can be created with this library, go to examples.
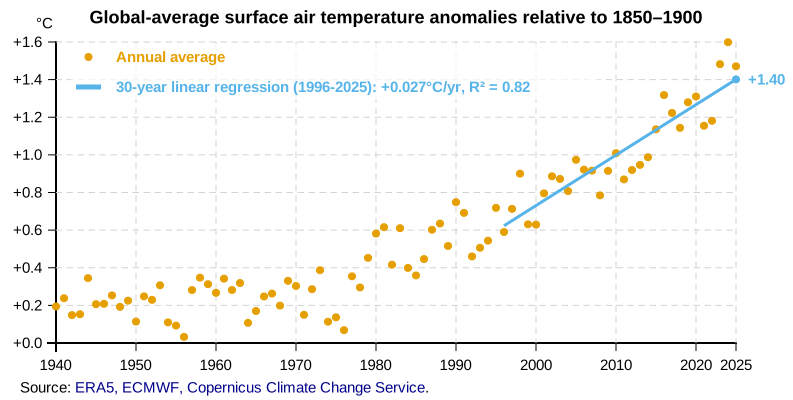
Why another charting library?
Just because I didn't find a library that totally suits my needs, so after creating a few SVG charts manually with Calc formulas, I decided to lose tens (hundreds?) of hours to develop a new one. Yes, it is about that stupid.
More specifically, I wanted SVG charts with real text (that you can copy), real links (that you can click on) and some CSS interactions on hovering chart.
You can find a lot of others SVG chart packages on PyPI which maybe better suit you needs, for example:
When should I use it?
Unless you really like it and want to create basic SVG charts without large customisation, you probably should NOT use this library. More specifically, don't use it at least in these cases:
- Only line and scatter types are available for now, so of course if you want a bar, pie, radar, treemap, sankey, etc. chart, don't use it
- Customisation is limited (see Customisation), if you want very fine customisation you should probably prefer one of the above mentioned Python packages or tools like 🐍 matplotlib, 🇷 ggplot2, 📜 Apache ECharts, 🧮 LibreOffice Calc...
- Lots of data points to draw:
- for line charts, if more than 100,000 points, result might be slow to display and svg file will be large. See example era5_moving_averages.svg: about 120,000 data points, 2MB svg file. Or test_large_dataset.py which creates a 600,000 points line chart.
- for scatter charts, more than 10,000 data points can cause slowing. See example meteo.svg: 8760 circles, 800kB svg file.
- If you want a static image (either for using it in a
<img>html tag or just to open it in a picture viewer), the css interactions, the links, the copyable text will be useless. - For using it in a PDF file, a word processor or in a presentation program. They often handle badly css and the image will probably not render as in a web browser.
🚧 WIP 🚧
[!warning] ⚠️ It's still alpha version, API is not stable yet and will definitely break in the future!
Installation
With pip:
python3 -m pip install basic-svg-chart
As it does not have any dependency, you can also just download .py files from the src directory and import them as simple python modules.
Usage
import basic_svg_chart

# Create a SVG chart and store it in a string
my_chart = basic_svg_chart.chart(
    type = "line",
    x = range(3),
    y = [[10, 20, 30], [15, 8, 22], [None, 15, 5]],
    width = 800, height = 500,
)

# Add to html file
html_page = f"""<!DOCTYPE html><html lang="en"><head><meta http-equiv="Content-Type" content="text/html; charset=utf-8" ><title>Chart example</title></head><body><h1>Line chart</h1><figure id="chart">
{my_chart}
'<figcaption>A <a href="https://developer.mozilla.org/en-US/docs/Web/SVG">SVG</a> chart</figcaption></figure><p>Made with Python.</p></body></html>"""

with open("/tmp/chart.html", "w") as outputfile:
    outputfile.write(html_page)

# Write a scatter chart to a file
basic_svg_chart.scatter_chart(
    x = range(2020, 2026),
    y = (100, 102.6, 103.7, 101.03, 99.9),
    y_ticks_interval = 10,
    title = "Example scatter chart",
    legend_position = None,
    fullscreen = True,
    output = "/tmp/chart.svg")
See real examples and simple tests examples for more.
Reference
This library has one chart() function with 3 aliases line_chart(), scatter_chart() and scatter_line_chart() with fixed chart type.
basic_svg_chart.chart(x, y, chart_type="line" , names=None , title=None , desc=None , lang=None , colors=None , width=1200 , height=800 , fullscreen=False , x_unit=None , y_unit=None , x_ticks=6 , x_axis_discrete=True , y_ticks=6 , y_ticks_interval=None , y_min=0 , y_max=None , big_mark=None , decimal_mark=None , x_ticks_format="{:n}" , y_ticks_format="{:n}" , show_values=None , values_position="top" , values_position_shift=None , values_format="{y}{y_unit}" , tooltip_type=("title", "value") , title_tooltip_format=DEFAULT_TOOLTIP , extra_data=None , circles=4 , extra_lines=None , legend_position="right" , legend_background=None , css=None , notes=None , font_size=15 , background_color="auto" , dark_mode="user" , pretty=False , output="string")
Create a SVG chart
Parameters:
x : Sequence[int | float | str] : The x values.
y : Sequence[Sequence[int | float | None]] | Sequence[int | float | None] : The y values. If multiple series must be drawn, must be a sequence of sequences. If some series has missing values, they have to be specified with None. If series sequence length < len(x), the last values will be missing.
chart_type : str | Sequence[str], optional, default "line"
: The type of the chart, can be "line", "scatter" or "scatter line".
If a sequence is provided and there are multiple series, each series will have the specified type (based on sequence position, same as y).
names : Sequence[str] | str, optional
: Names of a the series. The position in the sequence must match the position of the series in y sequence.
If not provided (or less names than the number of series defined in y), defaults to "Data series n" (with n incremental) or to title if there is just one series.
title : str, optional
: The optional title of the chart. If provided, will be printed as a <text> element above the plotting area + a <title> element.
desc : str
: The optional description of the chart, used in a <desc> element which is referenced by the <svg> aria-describedby attribute.
lang : str, optional
: A BCP 47 language tag used in lang and xml:lang attributes added to the root <svg> element.
if "fr" then big_mark parameter defaults to " " and decimal_mark to ",".
colors : Sequence[str], optional
: The colors of the series. Can be either a color name (e.g. "green") or a hex code (e.g. "#e91585").
If not provided (or less names than the number of series defined in y), defaults to Okabe-Ito palette if 8 series or less, and Viridis palette if 9 ≤ len(series) ≤ 20.
If more than 20 series in y, colors must be provided.
width : int | float, optional, default 1200
: The width of the <svg> element. Used in a viewbox attribute (viewBox="0 0 {width} {height}").
Will also be used in a <svg> width attribute if fullscreen = True.
height : int | float, optional, default 800
: The height of the <svg> element. Used in a viewbox attribute (viewBox="0 0 {width} {height}")
Will also be used in a <svg> height attribute if fullscreen = True.
fullscreen : bool, optional, default False
: If True, the root <svg> element will have width and height attributes as specified in the eponymous parameters.
x_unit : str, optional
: An optional unit for x values. If specified, will be drawn below the x axis (and centered).
Can also be used in x_ticks_format, values_format and title_tooltip_format parameters as "{x_unit}".
y_unit : str, optional
: An optional unit for y values. If specified, will be drawn above the y axis.
Can also be used in y_ticks_format, values_format and title_tooltip_format parameters as "{y_unit}".
x_ticks : int | Sequence[int | float | str], optional, default 6
: The ticks drawn in the x axis. Can be either an int representing the number of ticks to show (see x_axis_discrete),
or a sequence of values.
x_axis_discrete : bool, optional, default True
: If True and x_ticks is an integer, the x ticks will be equally distributed from min(x) to max(x), even if the ticks are not included in x values.
If False and x_ticks is an integer, the x ticks values will be pulled from x values.
y_ticks : int | Sequence[int | float], optional, default 6
: The ticks drawn in the y axis. Can be either an int representing the number of ticks to show (not used if y_ticks_interval provided),
or a sequence of values.
y_ticks_interval : int | float, optional
: If y_ticks is not a sequence, y_ticks_interval defines the fixed interval between each tick, from y_min to y_max.
y_min : int | float, optional, default 0 : The min value drawn on the y ticks.
y_max : int | float, optional
: The max value drawn on the y ticks. If not provided and y_ticks not provided as a sequence, will be defined as max(y), or will be computed using y_ticks_interval is provided.
big_mark : str, optional
: Can be used to replace default "_" big mark separator when some numbers are formatted with "{:_}" in x_ticks_format, y_ticks_format, values_format or title_tooltip_format.
In such a case, dont use "_" as literal text in these formats as it will also be replaced by big_mark.
decimal_mark : str, optional
: Can be used to replace default "." decimal mark when some numbers are formatted with "{:.1f}" in x_ticks_format, y_ticks_format, values_format or title_tooltip_format.
In such a case, dont use "." as literal text in these formats as it will also be replaced by decimal_mark.
x_ticks_format : str, optional, default "{:n}" : The string format used to format x ticks values. "{x}" (with formatting options) will be replaced by the tick value and "{x_unit}" by the corresponding parameter.
y_ticks_format : str, optionall, default "{:n}" : The string format used to format y ticks values. "{y}" (with formatting options) will be replaced by the tick value and "{y_unit}" by the corresponding parameter.
show_values : str | Sequence[int | float | str], optional
: If provided, the specified values will be drawn on the chart (as <text> elements), next to the corresponding data points.
Can be either "all" for displaying all values, or a sequence of x values for displaying only the corresding y values.
values_position : str, optional, default "top"
: Where the value will be drawn relatively to the corresponding data point when show_values is provided or tooltip_type contains "value".
Can be one of "top", "right", "bottom", "left".
values_position_shift : Sequence[int | float], optional
: The specific shift in px defined as (x, y) relatively to the data points where to draw values when show_values is provided or tooltip_type contains "value".
Defaults to (0, -12) when values_position="top", (0, 20) when "bottom", (12, 0) when "right" and (-12, 0) when "left".
values_format : str, optional, default "{y}{y_unit}"
: The string format used to format values when show_values is provided or tooltip_type contains "value".
"{y}" will be replaced by the y value, "{x}" by the x value, "{name}" by the series name, and "{x_unit}" and "{y_unit}" by the corresponding parameters.
tooltip_type : str | Sequence[str] | None, optional, default ("title", "value")
: [-[Experimental]-] The type of tooltip to display when hovering a data point. Can be a sequence containing "title", "value", "vertical line" or None to display no tooltip.
"title" will use <title> elements inside each <circle> elements representing the data points. These <title> elements are not rendered in mobile browsers.
"value" will use <text> elements hidden by default and shown when hovering. It doesn't work well when there are close data points or multiple series overlapping.
"vertical line" will show a vertical line and all y values when hovering a x virtual vertical line. It doesn't work well if lots of x values.
title_tooltip_format : str | Sequence[str], optional, default "{name}: x = {x}{x_unit}, y = {y}{y_unit}"
: The string format used to format tooltip when tooltip_type contains "title".
"{y}" will be replaced by the y value, "{x}" by the x value, "{name}" by the series name, "{extra}" by the corresponding extra_data for the point/series hovered, and "{x_unit}" and "{y_unit}" by the corresponding parameters.
If a sequence is provided and there are multiple series, each series will have the specified tooltip format on hover (based on sequence position, same as y).
extra_data : Sequence[Sequence[int | float | str]] | Sequence[int | float | str], optional
: Extra data that can be used in title_tooltip_format when tooltip_type contains "title".
Must be the same type as y: each data point will match the specified extra data based on sequence (of sequence) position.
circles : int | float, optional, default 4
: The <circle> radius in px (as r attribute).
Used when chart_type contains "scatter", or show values is provided, or tooltip_type is not None.
extra_lines : Sequence[dict] | dict, optional
: Extra horizontal or vertical lines to draw on the chart.
Each line is defined by a dictionary containing between 1 and 4 keys:
* 'x' for a vertical line or 'y' for a horizontal line, the value representing where to draw the line in the x or y axis. Must be the same type as x and y, multiple lines are drawn is a sequence is provided.
* 'color' (optional, default "black"): the color of the line, either as a color name (e.g. "green") or a hex code (e.g. "#e91585").
* 'thickness' (optional, default 2): the stroke-width attribute of the <line> element.
* 'position' (optional, default "back"): whether the lines are drawn behind ("back") or in front of ("front") the plots.
Multiple lines can be drawn using a sequence of dictionaries.
legend_position : str | None, optional, default "right" : Where to draw the legend (containing series names). To draw the legend outside the plotting area, use one of "top", "right", "bottom", "left". To draw the legend inside the plotting area, use one of "top left", "top right", "bottom left", "bottom right". None if legend must not be displayed.
legend_background : str, optional : If provided, the background color of the legend, either as a color name (e.g. "green") or a hex code (e.g. "#e91585").
css : Sequence[str] | str, optional
: The optional css properties to add as is to the <style> element.
notes : str | Sequence[str], optional
: The optional notes to display as a <text> element above the chart.
Can contain svg elements (such as <a> for example) and raw text.
If a note starts with "<i>", text will be displayed in italic. If it starts with "<b>", text will be displayed in bold.
If a sequence is provided, each element will be treated as a new line, using
font_size : int | float, optional, default 15
: The font size (in px) of the root <svg> element.
background_color : str | None, optional, default "auto"
: If not None, draw a <rect> fill with the specified color behind the chart.
Can be a color name (e.g. "green") or a hex code (e.g. "#e91585").
Defaults to "auto", which translates to "black" if dark_mode="force", otherwise "white".
if dark_mode="user", the background <rect> will be hidden if the browser is configured in dark color scheme.
dark_mode : str | None, optional, default "user" : If "user", add a few css properties to handle color scheme preference of user on web browser. If "force", display the chart with a black background (instead of white in light mode) and white texts and axis lines (instead of black in light mode). Otherwise, use light mode (white background + black text and axis lines).
pretty : bool, optional, default False
: If True, the <svg> output will be prettified using xml.etree.ElementTree.indent() function.
If False, the <svg> output will be minified (fits in one line).
output : str, optional, default "string"
: If "string", the function will return the <svg> content as a string.
If "etree", the function will return the <svg> content as a xml.etree.ElementTree.Element.
Otherwise, will be interpreted as the name (absolute or relative path) of the svg file to create containing the chart.
In such a case, the function will also return the xml.etree.ElementTree.Element.
Returns:
str or xml.etree.ElementTree.Element
: SVG chart, either as a string if output="string" or a xml.etree.ElementTree.Element otherwise.
If output is the name (absolute or relative) of a file, the SVG content is written to that file
and the function returns the xml.etree.ElementTree.Element.
Customisation
There are several ways to cutomise the charts created with this library.
CSS
You can simply use the css parameter and add unlimited CSS declarations to the SVG chart. CSS is a very powerful language and you can do a lot for styling SVG.
Your custom css declarations will be added at the end of the <style> element so that they take precedence other the default declarations added by the library, in case you want to override some.
For example, if you want a 20px italic title, Liberation Mono font, green x axis, blinking y unit, no vertical dotted gridlines, and move legend, you can use a css parameter like:
import basic_svg_chart as bsc

bsc.scatter_chart(
    x = range(11),
    y = (range(11), [5] * 8),
    title = "CSS customisation example",
    y_unit = "€uros",
    css = (
        "text.title {font-size: 20px; font-style: italic;}",
        ":root {font-family: 'Liberation Mono';}",
        "#abscissa_lines > line {stroke: green;}",
        "#abscissa_text {fill: green;}",
        "#ordinate > text.unit {animation: blinker 1s linear infinite;}",
        "@keyframes blinker {50% {opacity: 0;}}",
        "#vertical_dotted_lines > line[stroke-dasharray] {display: none;}",
        ".legend {transform: translate(-300px, 500px);}"
    ),
    output = "/tmp/chart.svg"
)
See also Examples, some have a few custom css declarations (like carte.py, pop.py, keeling_curve.py, era5_moving_averages.py).
Programmatically
By using the output = "etree" parameter, the function will return the chart content as a . Then you can modify whatever you want before converting the chart to a string (using ) or writing it to a file (using ).
See also Examples, some are programmatically modified (like carte.py, pop.py, ips.py, secten.py).
Manually
SVG is quite a powerful and easy-to-understand format.
So you can also manually modify the svg generated file with any text editor for adding, removing, changing some elements for one-time adjustments. In such a case, use pretty = True parameter (or prettify the svg content with your text editor).
With a vector graphics editor?
The svg generated file can be graphically modified using a vector graphics editor, like Inkscape.
⚠️ Note that SVG editors don't necessarily handle well CSS, so you can have issues with that.
For instance, with default dark_mode parameter, Inkscape seems not to show the chart. You may have to comment (or remove) the line :root {color-scheme: light dark;} in the <style> element before opening the file with Inkscape. And after the file has been modifid in Inkscape, it seems some CSS declarations are slightly modified and don't work anymore (like circle replaced by .circle), so you probably should be careful with that too.
Compatibility
Tested on Linux Mint 22, with Python 3.10 to 3.14, and debian 13 + python 3.13. It probably works on other OS too, but it has not been tested.
Note that some examples rely on Linux platform, a few scripts must be changed to work on Windows, like specifying encoding = "utf-8" when reading csv files or changing the function to open the svg file after creation using subprocess.call(["start", out_file], shell = True) (see at the bottom of run_examples.py).
Chart render is not exactly the same on different web browsers, it has only been tested on Firefox and Chromium.
Old python versions
This library requires Python ≥ 3.10 to work. If you are using 3.6 ≤ Python < 3.10, you can use the file [old/basic_svg_chart.py], which is compatible with Python ≥ 3.6 but with a few differences/limitations:
typing.Unioninstead of|which was introduced in Python 3.10)isinstance(): classinfo can be a Union Type only since Python 3.10- Function annotations: replace
listbytyping.Listwich was introduced in Python 3.9 - Parameter
pretty = Truewon't work as it uses ElementTree.indent() which was introduced in Python 3.9
You can see the changes made for version 0.1.0 in this commit.
[!warning] Note that this old python version will probably not be maintened!
For Python < 3.6, it won't work at least because of heavy use of f-strings.
FAQ
Locale
if you want to use{:n} format with a specific [locale](https://docs.python.org/3/library/locale.html), you have to set it first with locale.setlocale(...).
Example:
import basic_svg_chart
import locale
print(locale.getlocale())
# locale.setlocale(locale.LC_ALL, "")
locale.setlocale(locale.LC_ALL, "fr_FR.utf8")

basic_svg_chart.line_chart(x = [x/100 for x in range(11)], y = range(0, 10001, 1000), output = "/tmp/chart.svg")
Other limitations
Probably a lot, but here are some:
- Dates cannot be used in x, you have to convert them to strings (see examples era5_moving_averages and meteo.py)
- If you use "<", ">" or "&" in a text, it must be replaced by html entities: "<", ">", "&"
- Most texts are left aligned (notes, legend, units), so it isn't adapted to right-to-left writing systems (and using
directionattribute will do weird things) - Other known issues


Download files
Download the file for your platform. If you're not sure which to choose, learn more about installing packages.
Source Distribution
Built Distribution
Filter files by name, interpreter, ABI, and platform.
If you're not sure about the file name format, learn more about wheel file names.
Copy a direct link to the current filters
File details
Details for the file basic_svg_chart-0.1.0.tar.gz.
File metadata
- Download URL: basic_svg_chart-0.1.0.tar.gz
- Upload date:
- Size: 40.2 kB
- Tags: Source
- Uploaded using Trusted Publishing? No
- Uploaded via: twine/6.2.0 CPython/3.14.3
File hashes
| Algorithm | Hash digest | |
|---|---|---|
| SHA256 |
5bf2277ea1ad9fb68523daf91322930f7637326bc6f8657a39cb2f10f5eeeb9b
|
|
| MD5 |
49116fa0face402536c2d9320b4de914
|
|
| BLAKE2b-256 |
0d7ca52f8392e3bf62a366a17138168b7d84814a194ac88313cd202bebfce5e9
|
File details
Details for the file basic_svg_chart-0.1.0-py3-none-any.whl.
File metadata
- Download URL: basic_svg_chart-0.1.0-py3-none-any.whl
- Upload date:
- Size: 28.3 kB
- Tags: Python 3
- Uploaded using Trusted Publishing? No
- Uploaded via: twine/6.2.0 CPython/3.14.3
File hashes
| Algorithm | Hash digest | |
|---|---|---|
| SHA256 |
62cc45fc4fe77277483fd82d46ee56fff1aa8656c3b8db527beeee9887940ea8
|
|
| MD5 |
89cad9000c5b38eff2a5da2eb2f0b86e
|
|
| BLAKE2b-256 |
fa059d445d95d95dbf5a1cf74332c46b944d96a80d68ef48930ee5d97d458cd9
|








