A flexible tool for batch plotting of thematic maps using GeoPandas and Matplotlib.

Project description
batch-map-plotter
batch-map-plotter is a powerful and flexible Python tool designed for batch plotting of thematic maps, mainly using GeoPandas and Matplotlib.
It supports both numeric and categorical variables, automatic binning, customized color maps, text labeling, and base map integration — with full support for both point and polygon geometries. Ideal for data analysts, geospatial researchers, and anyone seeking a production-ready geographic visualization workflow.
🚀 Key Features Summary
- Batch plotting multiple variables: Plot several numeric or categorical variables at once, saving time and effort.
- Flexible grouping: Automatically split maps by categorical groups (e.g., regions), supporting both global and group-wise binning.
- Smart binning strategies: Support for natural breaks, quantiles, equal intervals, with automatic bin edge calculation.
- Full color control: Custom color palettes with optional reversing of colormap and legend order, alpha transparency adjustment.
- Support for mixed data types: Automatic detection or manual setting of variable type (numeric, categorical, mixed).
- Labeling with overlap avoidance: Place text labels with configurable minimum spacing to avoid clutter.
- Geometry type adaptable: Handles both polygon and point GeoDataFrames.
- Basemap integration: Add background tiles via contextily for richer geographic context.
- High quality output: Configurable figure size, resolution, and file saving.
- Return updated GeoDataFrame: Optionally get back the data with added binning columns for further analysis.
🛠 Detailed Parameters and Options
| Parameter | Type | Default | Description |
|---|---|---|---|
| gdf | GeoDataFrame | — | Input GeoDataFrame containing geometry and attribute data. |
| vars | list of str | — | List of variable names (columns in gdf) to plot maps for. |
| var_config | dict | None | Dict specifying per-variable config: type ('numeric'/'categorical'), bins, palette, order, etc. |
| group_by | str | None | Column name to group data for separate map outputs (e.g., region, category). |
| bin_by_group | bool | True | Whether to bin numeric variables separately per group or use global binning across groups. |
| data_type | str | 'mixed' |
Default variable type if not specified: 'numeric', 'categorical', or 'mixed'. |
| geometry_type | str | 'polygon' |
Geometry type of data, 'polygon' or 'point'. |
| point_size | int | 30 | Marker size when plotting points. |
| basemap | contextily tile | None | Basemap tile provider, e.g. contextily.providers.CartoDB.Positron. 高德底图:contextily.providers.Gaode.Normal OpenStreetMap/OSM: contextily.providers.OpenStreetMap.Mapnik |
| layer_alpha | float (0–1) | 1.0 | Alpha transparency for the geometry fill layer. |
| bins | int | 5 | Number of bins for numeric variable binning. |
| binning_strategy | str | 'natural_breaks' |
Binning method: 'natural_breaks', 'quantiles', or 'equal_interval'. |
| palette | str or list | 'RdYlBu' |
Colormap name or list of colors for filling polygons or points. |
| reverse_colormap | bool | False | Reverse the order of colors in the colormap. |
| reverse_legend | bool | False | Reverse the order of items in the map legend. |
| alpha | float (0–1) | 0.7 | Transparency of fill colors. |
| show_labels | bool | True | Whether to draw text labels on the map. |
| label_col | str | 'name' |
Column used for label text. |
| label_min_dist | int | 3000 | Minimum spacing (in meters) between labels to avoid overlap. |
| label_fontsize | int | 8 | Font size of the labels. |
| fontfamily | str | 'Arial' |
Font family used for labels, title, and legend. 中文仿宋: 'FangSong' |
| output_dir | str | '.' |
Directory path to save output map images. |
| dpi | int | 300 | Resolution (dots per inch) for saved images. |
| figsize | tuple(int,int) | (10, 10) | Size of the output figure in inches (width, height). |
| return_updated_gdf | bool | False | Return the GeoDataFrame with added binning columns after plotting. |
🔧 Function Overview
def plot_batch_maps(
    gdf,
    vars,

    # === Variable Configuration ===
    var_config=None,
    group_by=None,
    bin_by_group=True,

    # === Geometry Settings ===
    data_type='mixed',
    geometry_type='polygon',
    point_size=30,
    basemap=None,
    layer_alpha=0.5,

    # === Binning & Colors ===
    bins=5,
    binning_strategy='natural_breaks',
    palette='RdYlBu',
    reverse_colormap=False,
    reverse_legend=False,
    alpha=0.7,

    # === Labeling Options ===
    show_labels=True,
    label_col='name',
    label_min_dist=3000,
    label_fontsize=8,
    fontfamily='Arial',

    # === Output Settings ===
    output_dir='.',
    dpi=300,
    figsize=(10, 10),
    return_updated_gdf=False
)
📦 Installation
pip install batch-map-plotter
🌍 Example Dataset
We use the official U.S. state population projections (2020–2024) combined with geographic boundaries to demonstrate plotting features. Sample file: assets/US_population_plot.geojson
|    | id   | name       | state      |   pop_estimat_2020 |   pop_estimat_2021 |   pop_estimat_2022 |   pop_estimat_2023 |   pop_estimat_2024 |   Change, July 1, 2023 to July 1,2024 |   Change, April 1, 2020 to July 1,2024 | region   | Attraction_Level   |
|---:|:-----|:-----------|:-----------|-------------------:|-------------------:|-------------------:|-------------------:|-------------------:|--------------------------------------:|---------------------------------------:|:---------|:-------------------|
|  0 | AL   | Alabama    | Alabama    |            5033094 |            5049196 |            5076181 |            5117673 |            5157699 |                                 40026 |                                 132330 | South    | Moderate           |
|  2 | AZ   | Arizona    | Arizona    |            7187135 |            7274078 |            7377566 |            7473027 |            7582384 |                                109357 |                                 424274 | West     | Moderate+          |
|  3 | AR   | Arkansas   | Arkansas   |            3014546 |            3026870 |            3047704 |            3069463 |            3088354 |                                 18891 |                                  76801 | South    | Moderate-          |
|  4 | CA   | California | California |           39521958 |           39142565 |           39142414 |           39198693 |           39431263 |                                232570 |                                -124411 | West     | Weak               |
|  5 | CO   | Colorado   | Colorado   |            5787129 |            5814036 |            5850935 |            5901339 |            5957493 |                                 56154 |                                 182169 | West     | Moderate           |
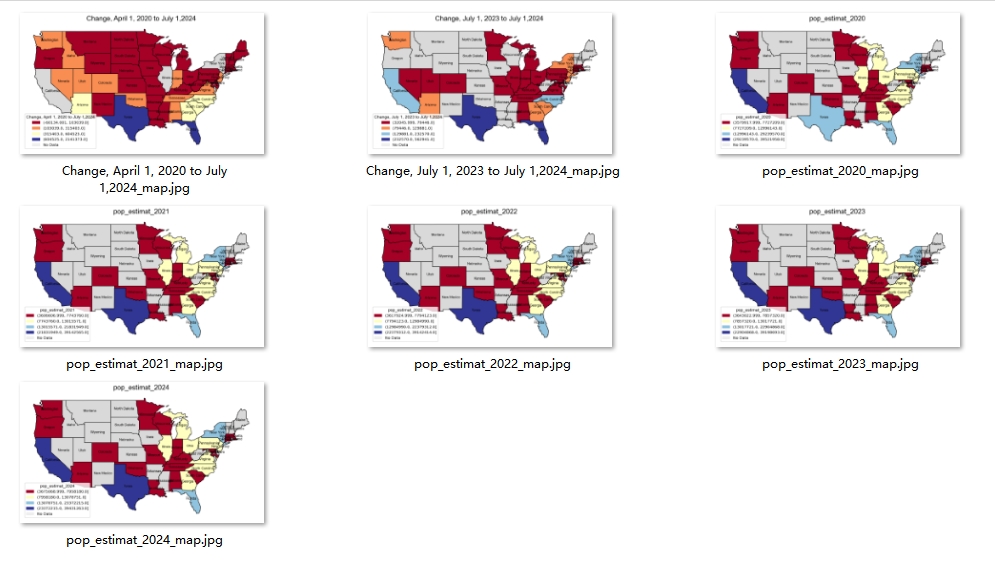
🧪 Usage Examples
1. Basic: Plot multiple numeric variables
#read file:
import geopandas as gpd
from batch_map_plotter import plot_batch_maps

US_pop = gpd.read_file('assets/US_population_plot.geojson')


plot_batch_maps(
    gdf=US_pop,
    vars=['pop_estimat_2020', 'pop_estimat_2021',
       'pop_estimat_2022', 'pop_estimat_2023', 'pop_estimat_2024',
       'Change, July 1, 2023 to July 1,2024',
       'Change, April 1, 2020 to July 1,2024'],

    bins=5,
    binning_strategy='natural_breaks',
    palette='RdYlBu',

    show_labels=True,
    label_col='name',

    dpi=300,
    figsize=(10, 10),
    return_updated_gdf=False,

    output_dir="."
)
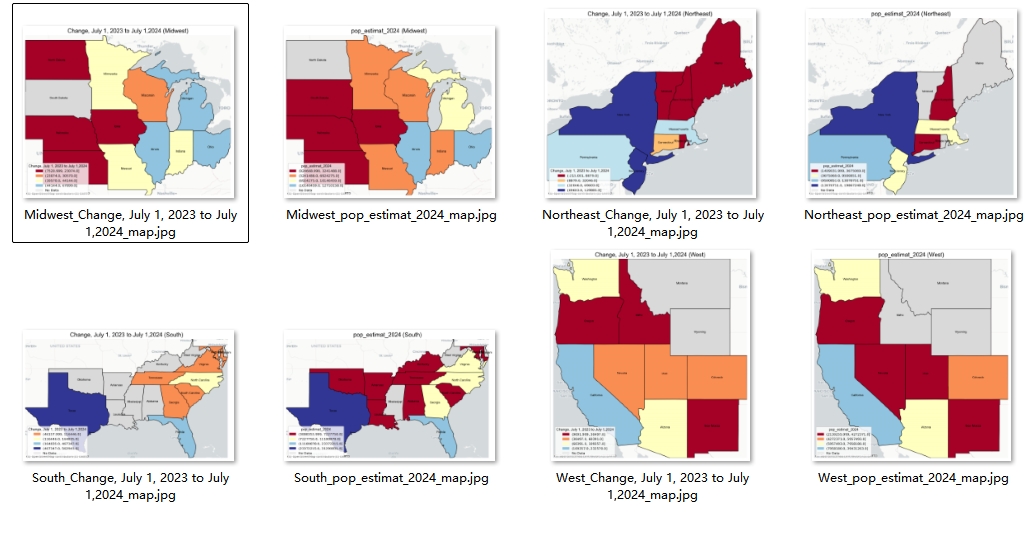
2. Grouped Maps with Basemap ( !! group-wise binning by default !! )
import contextily

plot_batch_maps(
    gdf=US_pop,
    vars=["pop_estimat_2024", 'Change, July 1, 2023 to July 1,2024'],
    group_by="region",
    basemap=contextily.providers.CartoDB.Positron,
    output_dir="."
)
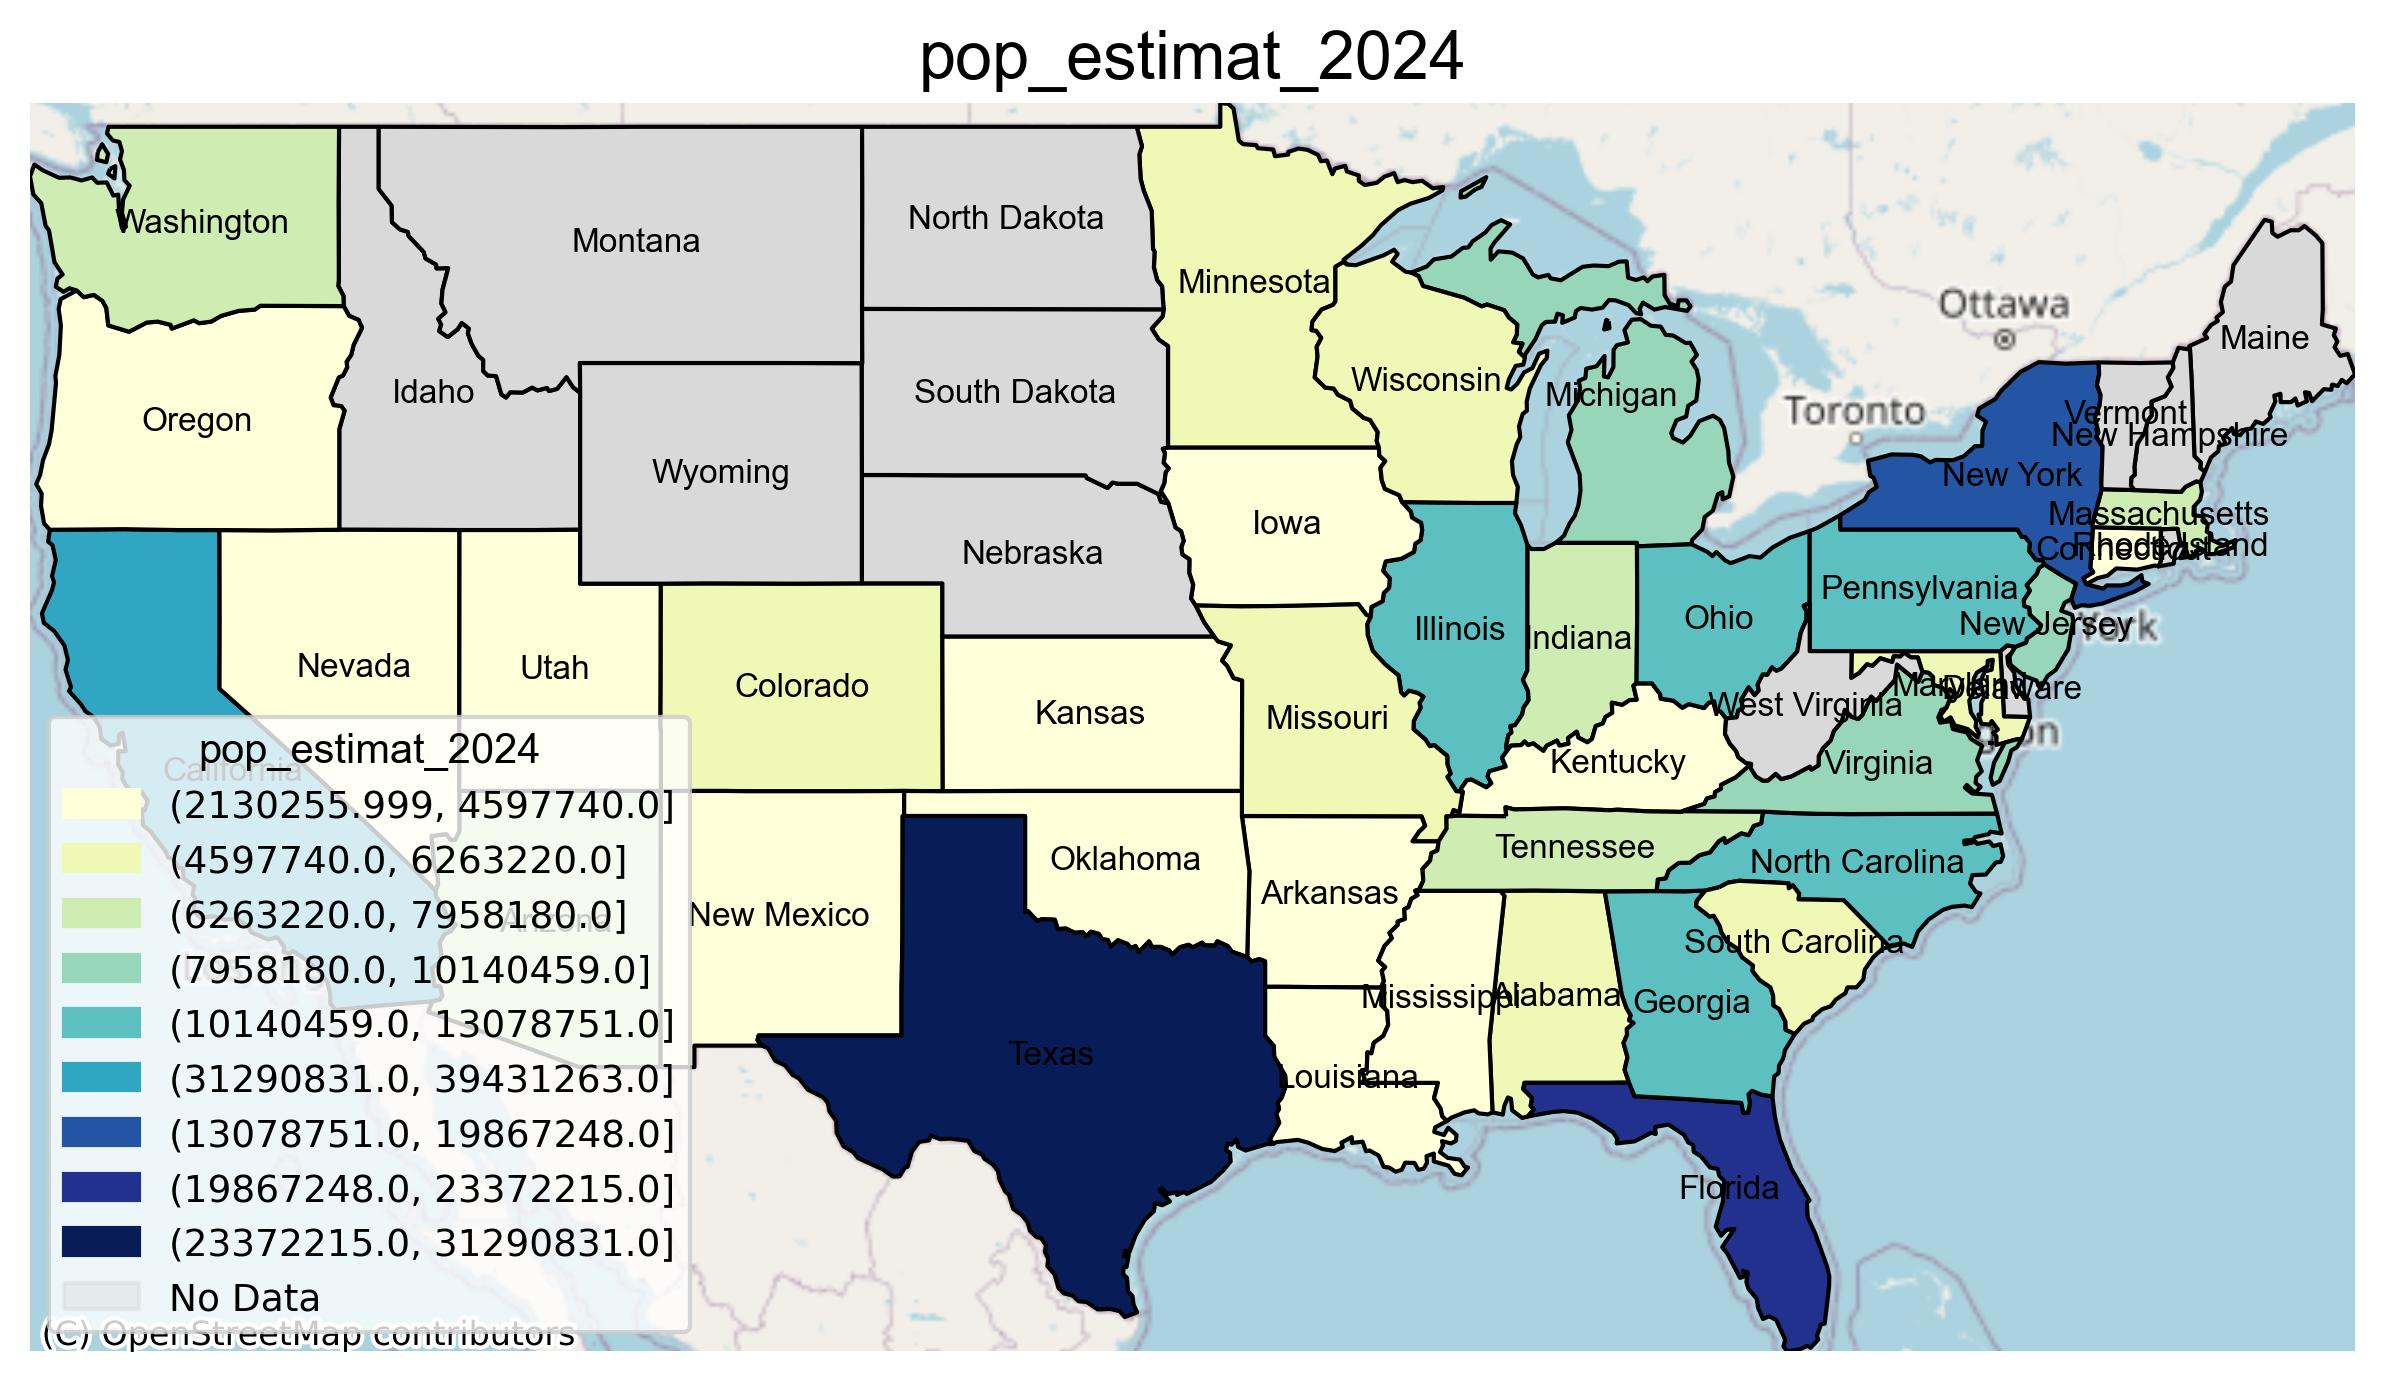
3. Custom Config Example
var_config = {
    "Attraction_Level": {
        "type": "categorical",
        "order": ["Strong", "Moderate+", "Moderate", "Moderate-", "Weak"],
        "order_by": "good_to_bad",
        "palette": ["#2166ac", "#67a9cf", "#d1e5f0", "#fddbc7", "#b2182b"]
    },
    "pop_estimat_2024": {
        "type": "numeric",
        "bins": 10,
        "strategy": "natural_breaks",
        "palette": "YlGnBu"
    }
}

plot_batch_maps(
    gdf=US_pop,
    vars=["Attraction_Level", "pop_estimat_2024"],
    var_config=var_config,
    basemap=contextily.providers.OpenStreetMap.Mapnik,
    label_col="name",
    reverse_legend=False,
    output_dir="."
)
population attraction level by state:

📜 License
MIT License
Release history Release notifications | RSS feed

Download files
Download the file for your platform. If you're not sure which to choose, learn more about installing packages.
Source Distribution
Built Distribution
Filter files by name, interpreter, ABI, and platform.
If you're not sure about the file name format, learn more about wheel file names.
Copy a direct link to the current filters
File details
Details for the file batch_map_plotter-0.1.0.tar.gz.
File metadata
- Download URL: batch_map_plotter-0.1.0.tar.gz
- Upload date:
- Size: 5.9 kB
- Tags: Source
- Uploaded using Trusted Publishing? No
- Uploaded via: twine/6.1.0 CPython/3.10.11
File hashes
| Algorithm | Hash digest | |
|---|---|---|
| SHA256 |
5be0da38d8bb2939daeeadbd349d66310ce1e7eaf588bdd3872d74c84094ba8c
|
|
| MD5 |
35f4ecc0a80d40b78131c6510ab24014
|
|
| BLAKE2b-256 |
b19f591655d3bbfa7969c7768307a611934f0bab6e5802dd2fe9ed7dd1c7d6eb
|
File details
Details for the file batch_map_plotter-0.1.0-py3-none-any.whl.
File metadata
- Download URL: batch_map_plotter-0.1.0-py3-none-any.whl
- Upload date:
- Size: 5.8 kB
- Tags: Python 3
- Uploaded using Trusted Publishing? No
- Uploaded via: twine/6.1.0 CPython/3.10.11
File hashes
| Algorithm | Hash digest | |
|---|---|---|
| SHA256 |
e447486561d8ce34a68cb006c3872e735b0b7f3bdd0d1a86d50322f6f1af5fd1
|
|
| MD5 |
2a7bb766e61b69264171c444bcfa451f
|
|
| BLAKE2b-256 |
c1c551679c04e4fa72bcb27dc96c350dfd2aa9dae5a45f436036115fe21987a9
|


