A package to download BC covid data and create simple EDA

Project description


bccovideda
Authors: Lianna Hovhannisyan, John Lee, Vadim Taskaev, Vanessa Yuen
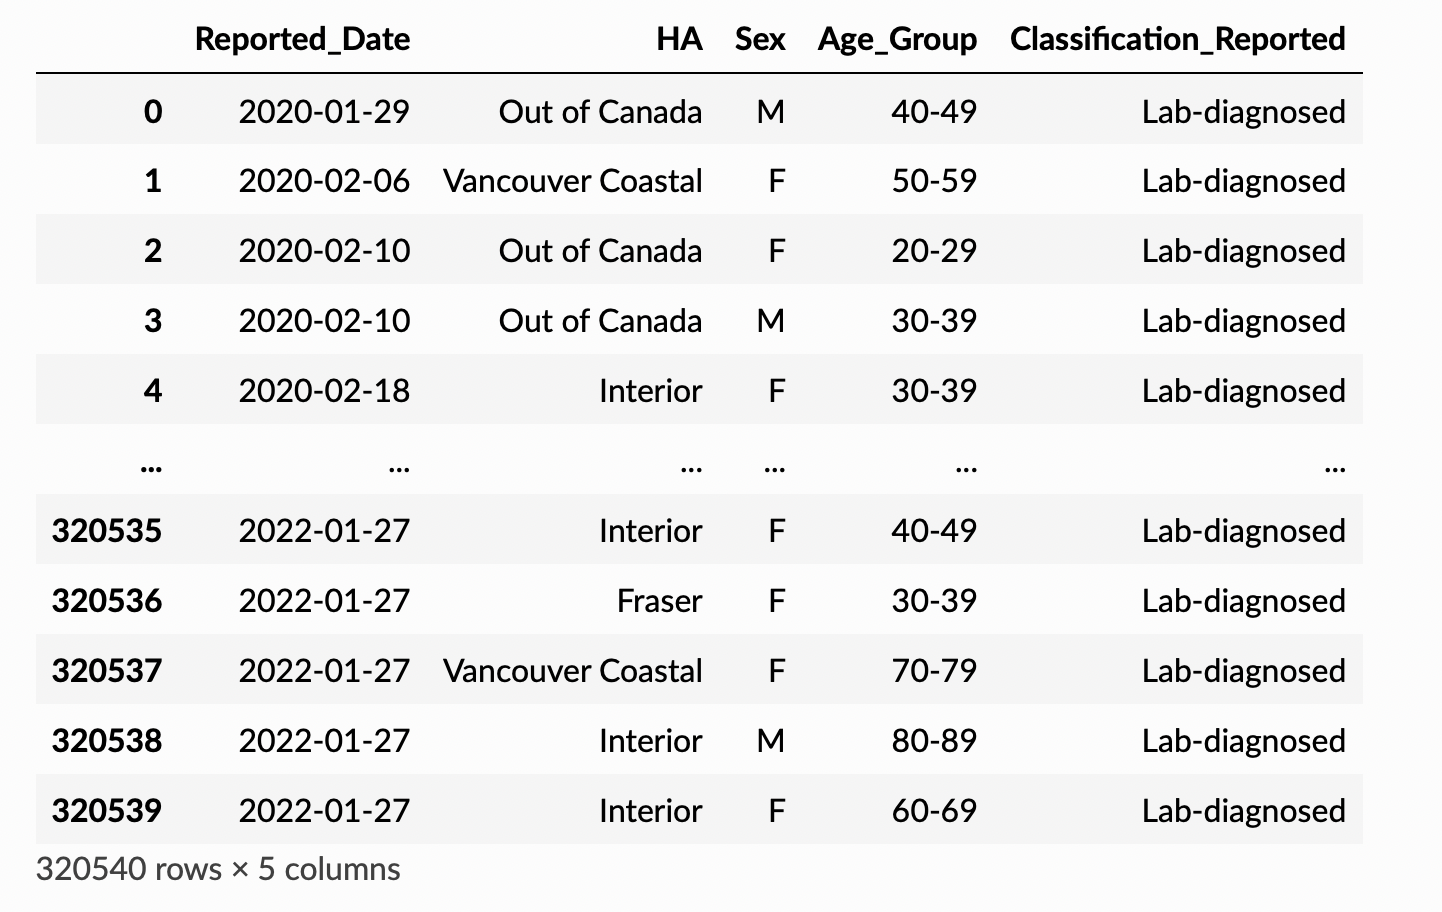
The British Columbia Center for Disease Control (BCCDC) manages a range of provincial programs and clinics that contribute to public health and help control the spread of disease in BC. It administers and distributes the latest daily data on COVID-19 in British Columbia, which it provides in csv format along case-, lab- and regional-specific features as well as in comprehensive ArcGIS format via the COVID-19 webpage (under "Download the data"). This package leverages daily case-specific COVID-19 data, allowing users to conveniently download the latest case data, and - per specified date range interval - compute several key statistics, visualize time series progression along age-related and regional parameters, and generate exploratory data analysis in the form of histogram figures supporting on-demand analysis. COVID-19 case detail parameters extracted using this package:
- Reported_Date (in YYYY-MM-DD format)
- HA (provincial health region, e.g., "Vancouver Coast Health")
- Sex (M or F)
- Age_Group (reported along 10-yr age group bins, e.g., "60-69")
- Classification_Reported (diagnosis origin, e.g., "Lab-diagnosed")
Installation
bccovideda can be installed from PyPI using the following terminal command:
$ pip install bccovideda
Package Functions
-
get_data()- This function downloads the latest detailed daily case-specific COVID-19 from BCCDC's dedicated COVID-19 homepage. It returns a dataframe containing the extracted raw data.
-
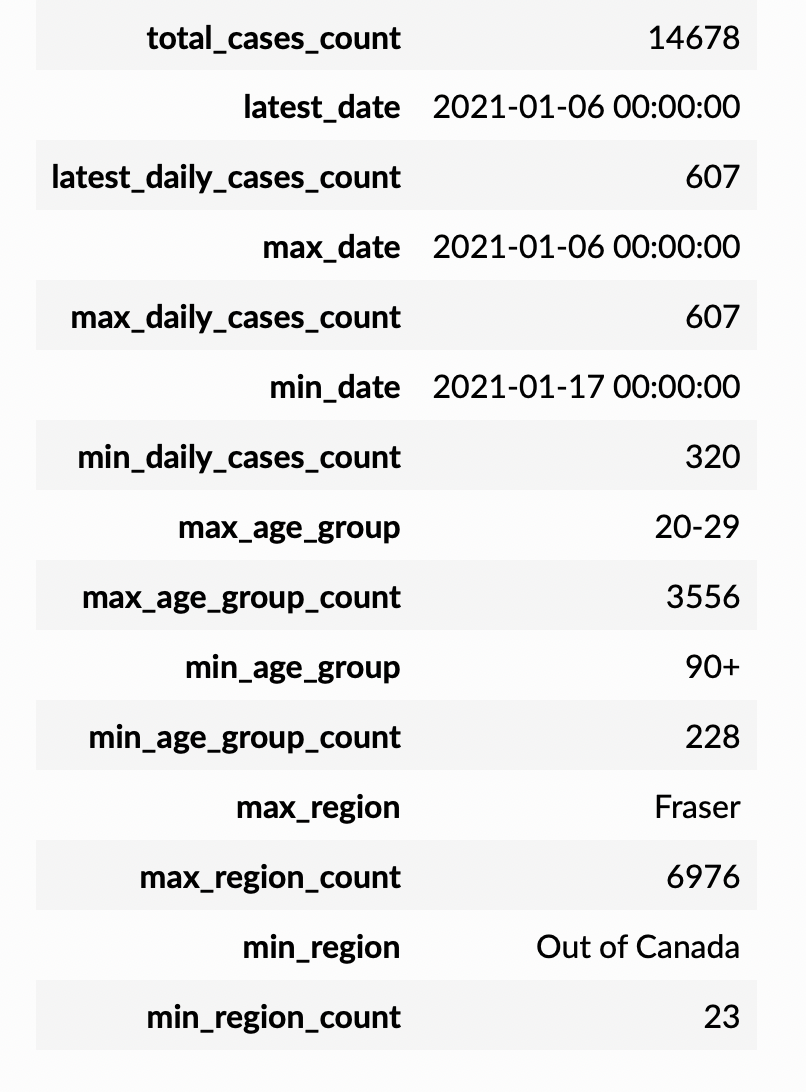
show_summary_stat()- This function computes summary statistics from the available case-specific parameters, such as age-related and regional aggregate metrics. It returns a dataframe listing key identified summary statistics specified per the time interval queried.
-
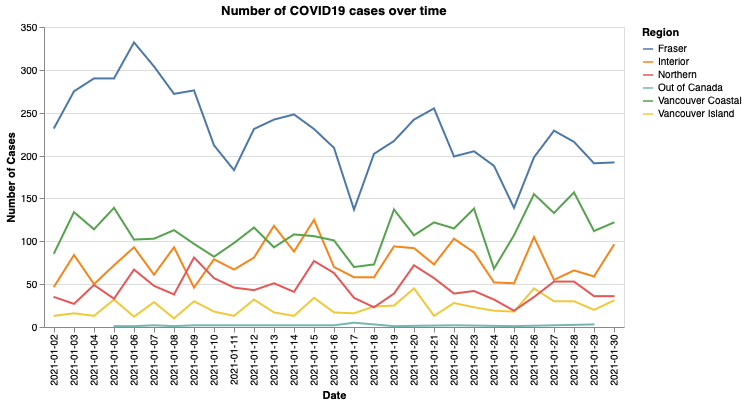
plot_line_by_date()- This function returns a line chart plot of daily case counts, based on parameters and grouping selected by the user, per the time interval queried.
-
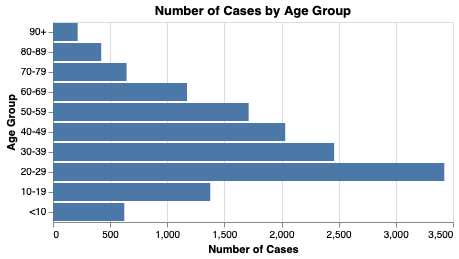
plot_hist_by_cond()- This function returns a histogram plot based on parameters and grouping selected by the user, per the time interval queried, allowing for on-demand exploratory data analysis.
Usage
bccovideda can be used to download and compute summary statistics, generate exploratory data analysis histogram plots, and plot time series chart data as follows:
from bccovideda.get_data import get_data
from bccovideda.show_summary_stat import show_summary_stat
from bccovideda.plot_hist_by_cond import plot_hist_by_cond
from bccovideda.plot_line_by_date import plot_line_by_date
get_data()
show_summary_stat("2022-01-01", "2022-01-13")
plot_hist_by_cond("2021-01-01", "2021-01-30", "Age")
plot_line_by_date("2021-01-01", "2021-01-30")
Role within Python Ecosystem
Given the relatively adequate accessibility of latest aggregate COVID-19 data combined with its persistent impact on socio-economics since early 2020, there are a number of rather comprehensive Python packages that perform similar data extract and exploratory data analysis functions, such as covid, covid19pyclient, covid19pandas. In contrast to existing packages, bccovideda provides a simple user interface that focuses on the localized provincial context of British Columbia, utilizing features specific to BCCDC's data administration conventions for generating a quick overview and on-demand analysis of trends and statistics pertaining to age-related and regional case characteristics.
Dependencies
-
Python 3.9 and Python packages:
- pandas==1.3.5
- requests==2.27.1
- altair==4.2.0
- altair-saver==0.5.0
Documentation
Documentation bccovideda can be found at Read the Docs
Contributing
Interested in contributing? Check out the contributing guidelines. Please note that this project is released with a Code of Conduct. By contributing to this project, you agree to abide by its terms.
Contributors
Group 25 Contributors:
- Lianna Hovhannisyan: @liannah
- John Lee: @johnwslee
- Vadim Taskaev: @vtaskaev1
- Vanessa Yuen: @imtvwy
License
The bccovideda project was created by DSCI 524 (Collaborative Software Development) Group 25 within the Master of Data Science program at the University of British Columbia (2021-2022). It is licensed under the terms of the MIT license.
Credits
bccovideda was created with cookiecutter and the py-pkgs-cookiecutter template.
Release history Release notifications | RSS feed


Download files
Download the file for your platform. If you're not sure which to choose, learn more about installing packages.
Source Distribution
Built Distribution
Filter files by name, interpreter, ABI, and platform.
If you're not sure about the file name format, learn more about wheel file names.
Copy a direct link to the current filters
File details
Details for the file bccovideda-1.1.0.tar.gz.
File metadata
- Download URL: bccovideda-1.1.0.tar.gz
- Upload date:
- Size: 9.6 kB
- Tags: Source
- Uploaded using Trusted Publishing? No
- Uploaded via: twine/3.8.0 pkginfo/1.8.2 readme-renderer/32.0 requests/2.27.1 requests-toolbelt/0.9.1 urllib3/1.26.8 tqdm/4.62.3 importlib-metadata/4.10.1 keyring/23.5.0 rfc3986/2.0.0 colorama/0.4.4 CPython/3.9.10
File hashes
| Algorithm | Hash digest | |
|---|---|---|
| SHA256 |
623dac57c850b20873a3d835f2d73d4c5913195daa7d010e655fe074687a20ef
|
|
| MD5 |
0fda82d459aa06f52e353c6fee80f9a9
|
|
| BLAKE2b-256 |
aba3a5a71ca08c8cfcf7a3e023ddcda50755de89966139c6be7595288597ce51
|
File details
Details for the file bccovideda-1.1.0-py3-none-any.whl.
File metadata
- Download URL: bccovideda-1.1.0-py3-none-any.whl
- Upload date:
- Size: 9.2 kB
- Tags: Python 3
- Uploaded using Trusted Publishing? No
- Uploaded via: twine/3.8.0 pkginfo/1.8.2 readme-renderer/32.0 requests/2.27.1 requests-toolbelt/0.9.1 urllib3/1.26.8 tqdm/4.62.3 importlib-metadata/4.10.1 keyring/23.5.0 rfc3986/2.0.0 colorama/0.4.4 CPython/3.9.10
File hashes
| Algorithm | Hash digest | |
|---|---|---|
| SHA256 |
709f73b07e8a9cc9701a01aab67a542a608e0a41b2e249589ca9c174e5831ff9
|
|
| MD5 |
07f24bd4d7b68c40aa7a7c8ce97d9357
|
|
| BLAKE2b-256 |
80d02dabf1935bcde1cd832abdedf047b77ef806f4ff421ce8705a29bffa688f
|


