A tool for determining the valid P/P0 range in BET isotherms


Project description

What is BEaTmap?


Obtaining surface area of a porous sample from the interpretation of gas adsorption isotherms is very widely done using the theory developed by Brunauer, Emmett, and Teller in the 1950s. The BET (or BEaT) theory is so commonly place that the acronym has is synonymous with surface area. The BET theory was derived with several assumptions, and these must be met for the predicted surface area to be valid.
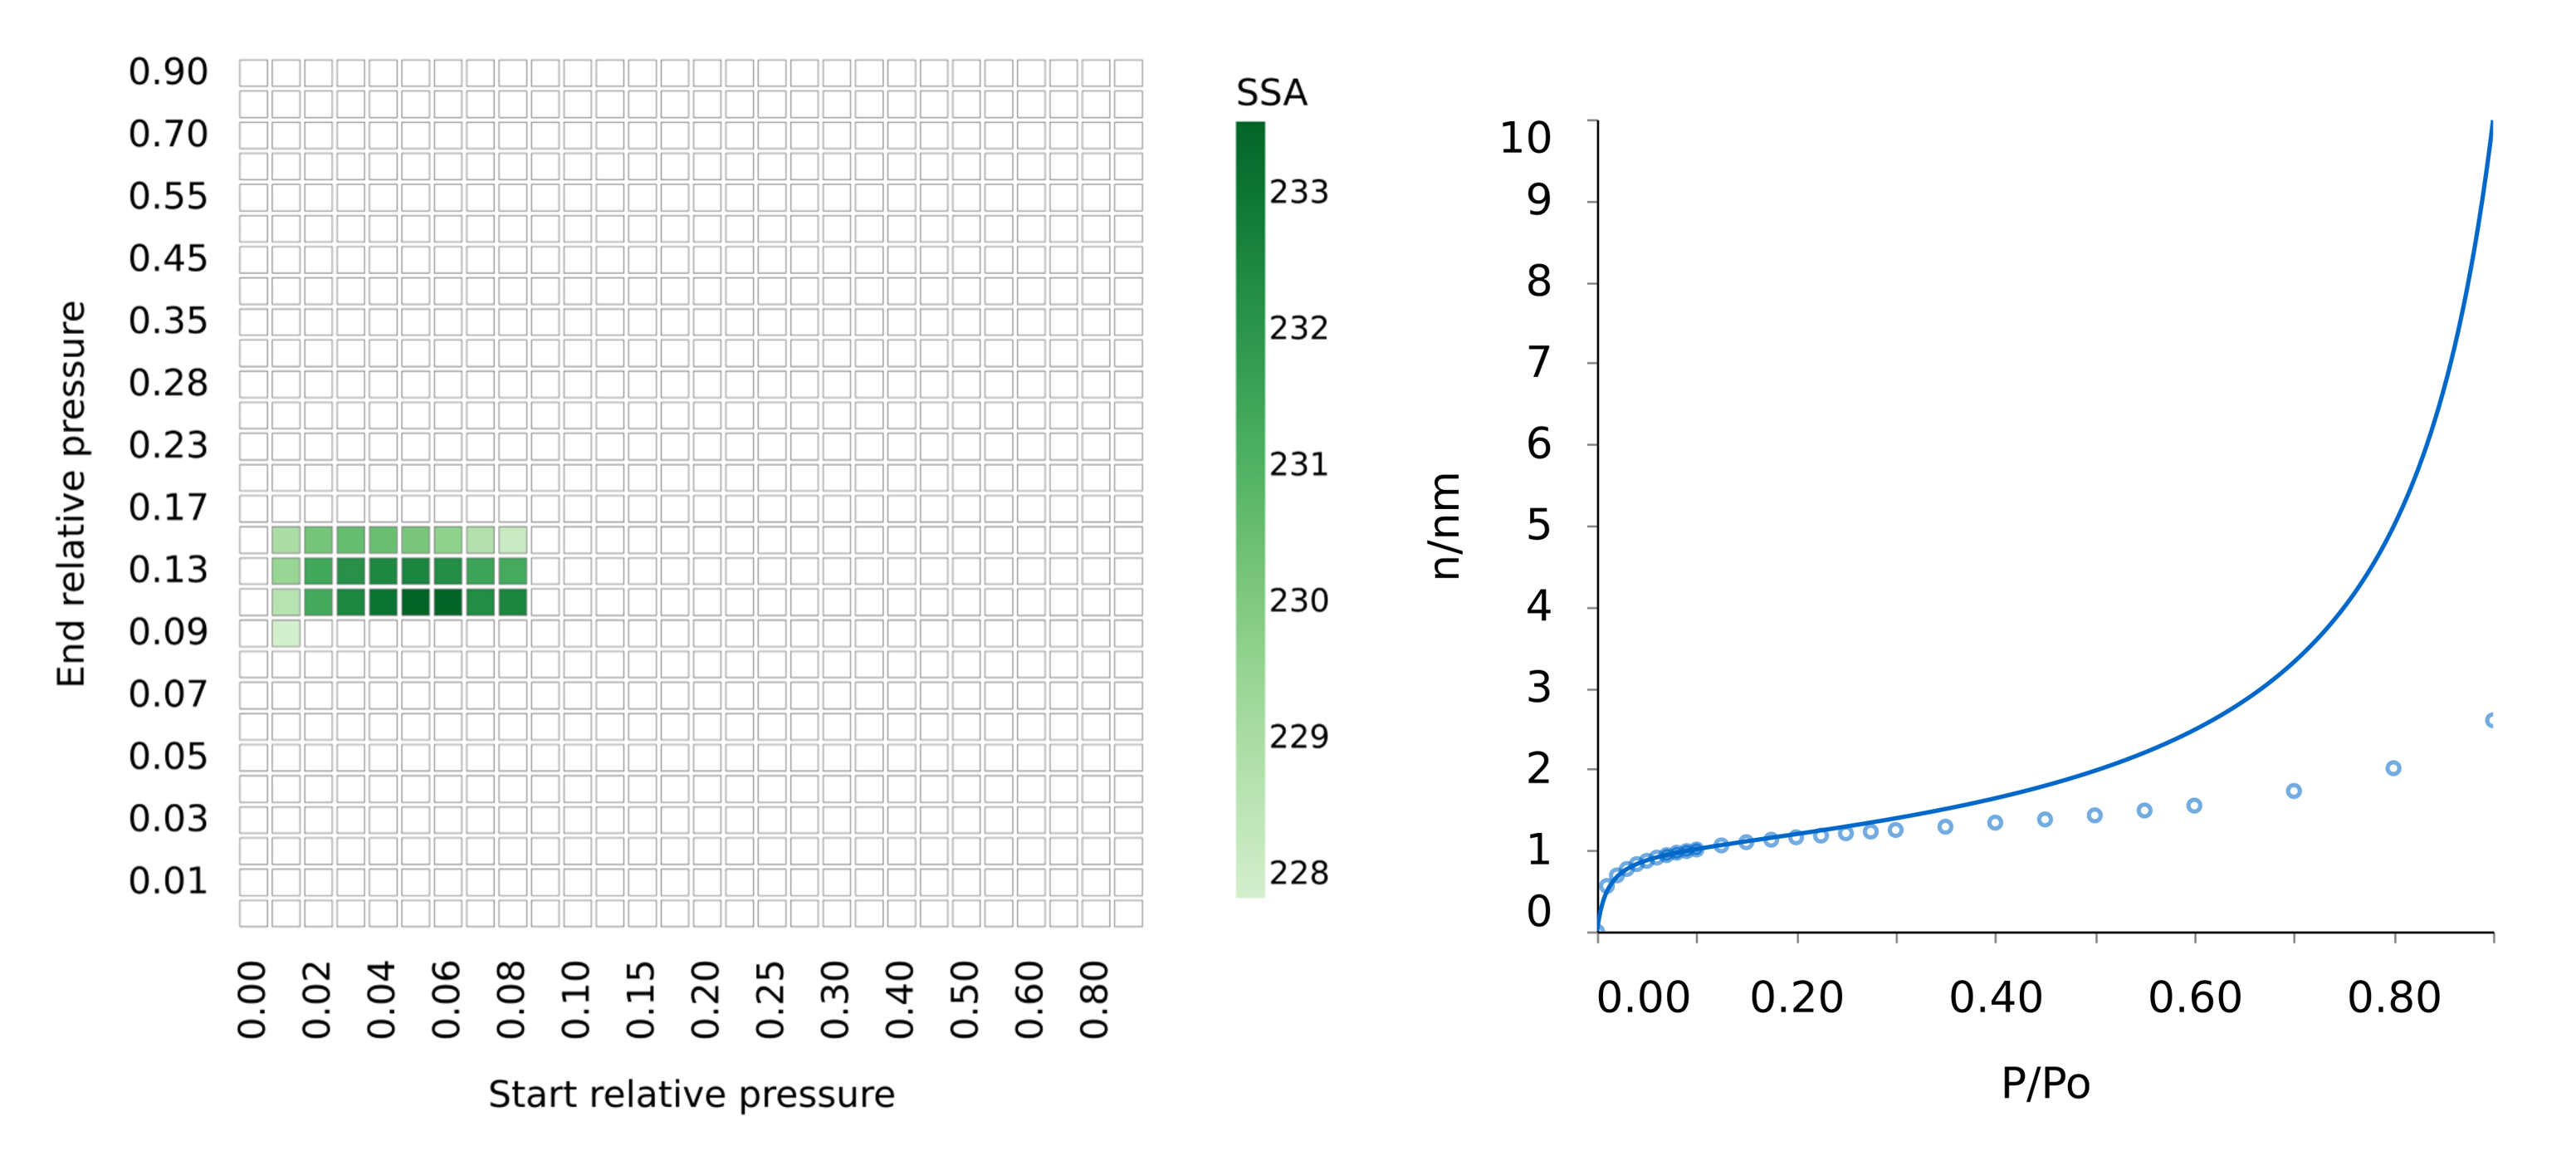
Rouquerol et al have put forth criteria to evaluate whether isothermal adsoprtion data meets the assumptions of BET analysis. Applying these criteria to all relative pressure ranges of an isotherm allows one to eliminate relative pressure ranges that do not adhere to BET theory. Visualizing the results of BET analysis as a heatmap where "invalid" relative pressure ranges are masked provides a quick and comprehensive representation of BET results for an isotherm.
BEaTmap was developed as a conceptulization and vizualization tool for BET analysis utilizing the "Rouquerol criteria".
Capabilities
BEaTmap consists of the following modules:
core: Functions that perform BET analysis, evaluate Rouquerol critieria, and provide a single specific surface area answerio: Functions for import data from .csv files or lists, and exporting processed data to .xlsx filesutils: Various small functions used in other BEaTmap modulesvis: Functions to create heatmaps, BET plots, isotherm plots, tables of BET analysis results, etc
Try It Live
We have created a web-based GUI for BEaTmap using Streamlit. This app is hosted on the Streamlit servers and is available here. If the app is not used for a certain period then Streamlit will hibernate it then wake it up on request, so it may take a few moments to load. The app includes a link to some sample data which you can use to explore the interface. Enjoy.
Installation
BEaTmap depends heavily on the Scipy Stack. The best way to get a fully functional environment is the Anaconda distribution. Be sure to get the Python 3.9+ version.
Once you've installed conda, you can then install BEaTmap. It is available on the Python Package Index and can be installed by typing the following at the conda prompt:
pip install beatmap
On Windows, you should have a shortcut to the "Anaconda Prompt" in the start menu. This will open a Windows command console with access to the Python features added by conda, such as installing things via pip.
On Mac or Linux, you need to open a normal terminal window, then type source activate {env} where you replace {env} with the name of the environment you want to install BEaTmap. If you don't know what this means, then use source activate base, which will install BEaTmap in the base environment which is the default.
If you think you may be interested in contributing to BEaTmap and wish to both use and edit the source code, then you should clone the repository to your local machine, and install it using the following pip command:
pip install -e path/to/beatmap/root/folder
For information about contributing, refer to the contributors guide.
Examples
The following code snippets illustrate how to import data, perform BET analysis, evaluate Rouquerol criteria, and produce figures in BEaTmap. An example is included in this repo, and can be browsed here.
Automated BET analysis
An "envelope" function, that will import data, perform BET analysis, evaluate the Rouquerol criteria, and produce all figures for the user has been built. The file path, information about the data (later used for naming exported files), and the adsorbate cross sectional area in square Angstrom need to be specified. It allows the user to access much of BEaTmap's functionality in one line.
import beatmap as bt
import matplotlib.pylot as plt

fpath = bt.utils.get_datasets_path() / 'vulcan_chex.csv'

rouq_criteria = {
    "enforce_y_intercept_positive": True,
    "enforce_pressure_increasing": True,
    "enforce_absorbed_amount": True,
    "enforce_relative_pressure": True,
    "enforce_enough_datapoints": True,
    "min_num_points": 5
}

aux_params = {
    "save_figures": True,
    "export_data": False,
    "ssa_gradient": "Greens",
    "err_gradient": "Greys"
}

results = bt.run_beatmap(
    file=fpath,
    info="chex on vulcan"
    a_o=39,
    ssa_criterion="error",
    **rouq_criteria,
    **aux_params
)
Manual BET analysis
Alternatively, you can use the individual functions in BEaTmap to perform BET analysis and evaluate the Rouquerol criteria. This allows the user to access more of BEaTmap's functionality, and to customize the analysis.
Import the dataset
The import_data function can be used to import a isotherm data from a .csv file where the first column is relative pressure and the second column is the amount adsorbed.
The function returns a named tuple where the first entry is a dataframe of the imported isotherm, and the 2nd-4th fields are the cross sectional area of the adsorbate, information about the data, and file path, respectively. Indexing of named tuple elements is in order of priority, data used by other function are given priority.
import beatmap as bt
import matplotlib.pylot as plt

isotherm_data = bt.io.load_vulcan_dataset()

# Alternatively, you can manually import the CSV data as shown below
# fpath = bt.utils.get_datasets_path() / 'vulcan_chex.csv'
# isotherm_data = bt.io.import_data(file=fpath, info='vulcan-chex', a_o=39)
BET analysis
BET analysis is performed on every relative pressure range within the isotherm data by the bet function. The function accepts the dataframe of isotherm data, cross sectional area of the adsorbate, and information about the data (information stored in the named tuple created by the import_data function). Rather than pass individual parameters, this function can accept *isotherm_data (where isotherm_data is a named tuple output by a data import function).
The function returns a named tuple containing the results of BET analysis as well as information about the isotherm (raw data, file path, etc). Again, the indexing of named tuple elements is in order of priority, data used by other function are given priority.
bet_results = bt.core.bet(
    iso_df=isotherm_data.iso_df,
    a_o=isotherm_data.a_o,
    info=isotherm_data.info
)
Rouquerol criteria
The Rouquerol criteria, used to mask out results of BET analysis for invalid relative pressure ranges are evaluated by the rouq_mask function. Rather than pass individual parameters, this function can accept *bet_results (where bet_results is a named tuple output by the bet function).
The function returns a named tuple containing a numpy mask array, and individual arrays corresponding to the results of each criterion.
mask_results = bt.core.rouq_mask(
    intercept=bet_results.intercept,
    iso_df=bet_results.iso_df,
    nm=bet_results.nm,
    slope=bet_results.slope,
    enforce_y_intercept_positive=True,
    enforce_pressure_increasing=True,
    enforce_absorbed_amount=True,
    enforce_relative_pressure=True,
    enforce_enough_datapoints=True,
    min_num_points=5
)
Supplementary analysis
The bet_results and mask_results can used to create a heatmap of specific surface area values for each relative pressure range. This visualization concept is the central idea of BEaTmap. The ssa_heatmap function requires the named tuples produced by the bet function and the rouq_mask function.
Other figures, such as a plot of experimental data and the model isotherm can be created in this manner. See the documentation for a full summary of figures.
bt.vis.ssa_heatmap(bet_results, mask_results)
bt.vis.iso_combo_plot(bet_results, mask_results, save_file=True)
Export the results
It might be desireable to have a spreadsheet that contains all results of BET analysis and the Rouquerol criteria. This sheet can be created and saved in the parent directory with the export_processed_data function.
bt.io.export_processed_data(bet_results)


Download files
Download the file for your platform. If you're not sure which to choose, learn more about installing packages.
Source Distribution
Built Distribution
Filter files by name, interpreter, ABI, and platform.
If you're not sure about the file name format, learn more about wheel file names.
Copy a direct link to the current filters
File details
Details for the file beatmap-0.3.0.tar.gz.
File metadata
- Download URL: beatmap-0.3.0.tar.gz
- Upload date:
- Size: 710.7 kB
- Tags: Source
- Uploaded using Trusted Publishing? No
- Uploaded via: python-httpx/0.25.0
File hashes
| Algorithm | Hash digest | |
|---|---|---|
| SHA256 |
b1cdb06d860f0809d3b3c69ab67986063196d488a4fd11865f372e6989149067
|
|
| MD5 |
e27b43935eb6e95e12a6108d1cf93c5b
|
|
| BLAKE2b-256 |
66b29dc508886f0f1c9ffa27adde37894940fc3f7d61d34af752a6584122d51a
|
File details
Details for the file beatmap-0.3.0-py3-none-any.whl.
File metadata
- Download URL: beatmap-0.3.0-py3-none-any.whl
- Upload date:
- Size: 23.9 kB
- Tags: Python 3
- Uploaded using Trusted Publishing? No
- Uploaded via: python-httpx/0.25.0
File hashes
| Algorithm | Hash digest | |
|---|---|---|
| SHA256 |
1744964d454c30465387c09d3e1daae1e6a4f403397774bcf9f21f614a42e773
|
|
| MD5 |
f6e21a274e2fe3faccdd4bfc2e1358cb
|
|
| BLAKE2b-256 |
dd36e74bdd64b9bcf45a2b44ba60dad743f10a4b2d1d8f0c2ab13326c0ff2d6d
|


